To evaluate the changes over time (trend) in sign and magnitude for SSVO2 and SVO2 during and after cardiac surgery.
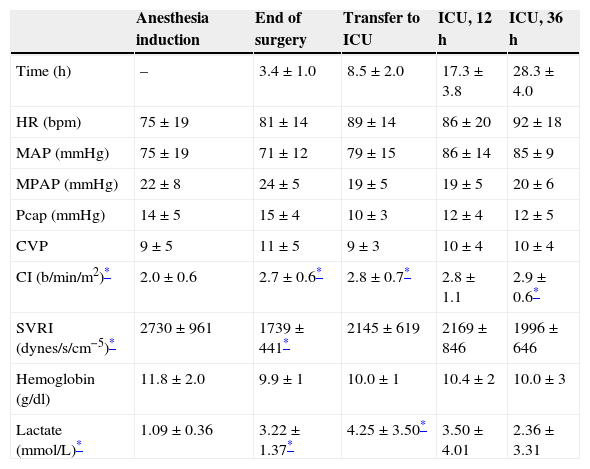
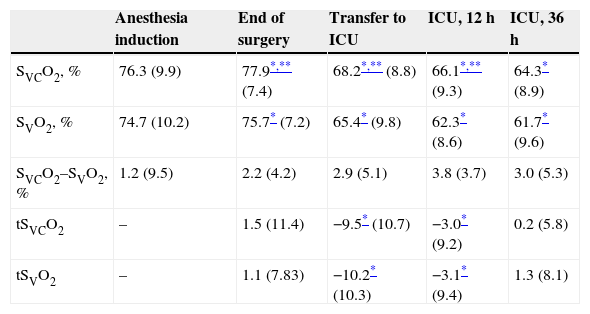
Patients and methodsA prospective and observational study was conducted on 34 cardiac surgery patients. Venous blood samples were taken simultaneously from the introductory (SVCO2) and distal (SVO2) port of the pulmonary artery catheter at predefined intervals. Systemic and pulmonary hemodynamic variables were measured at the same time. The trend was calculated as the difference between 2 consecutive measurements (tSO2). Data were processed with ANOVA for multiple comparisons, Pearson correlation coefficient and Bland–Altman analysis.
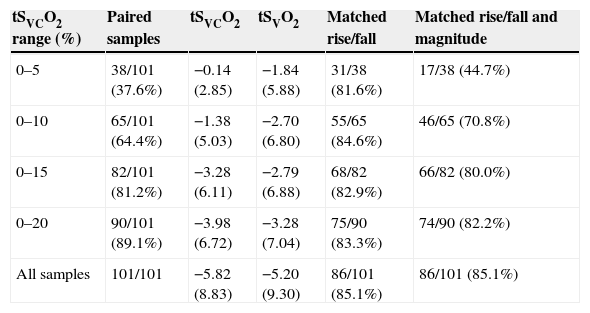
ResultsThere was a significant correlation between SVCO2 and tSVO2 (R2=0.55), the mean of the differences was 0.36±7.75%, and the limits of agreement ranged from −15.1 to 15.9%. The sign of the trend was similar in 85.1% of the paired data. However, the magnitude of the changes in tSVCO2 and tSVO2 were not always equivalent. Between 0 and 5% of the change in the tSVCO2 was coincident with only 44.7% of the tSVO2. A wide variation was found between both trends when the signs and magnitudes of the changes were taken into account.
ConclusionsWhen considering the sign and magnitude, the change over time of central venous O2 saturations were not interchangeable in cardiac surgery patients. Clinical decisions based exclusively on tSVCO2 monitoring should be taken with caution.
Comparar los cambios de signo y magnitud de las tendencias (tSO2) de las saturaciones venosas de arteria pulmonar (tSVO2) y de vena cava superior (tSVCO2) en pacientes sometidos a cirugía cardíaca.
Pacientes y métodosRealizamos un estudio prospectivo y observacional en 34 pacientes sometidos a cirugía cardíaca. Las medidas hemodinámicas y las extracciones de sangre se realizaron a intervalos predefinidos. Se extrajeron muestras simultáneamente del puerto distal del catéter pulmonar (SVO2) y del introductor del mismo (SVCO2). Las tSO2 se calcularon como la diferencia entre 2 medidas consecutivas. Los datos fueron procesados por test ANOVA, correlación de Pearson y análisis de Bland-Altman.
ResultadosLas tSO2 de ambas variables mostraron una correlación positiva (R2=0,55), siendo la diferencia de las medias de 0,36±7,75% y los límites de discordancia desde −15,1 a 15,9%. La probabilidad de que un cambio direccional en tSVCO2 pueda ser seguido de un cambio similar en tSVO2, mostró que el signo de las mismas coincidió en el 85,1%. Sin embargo, la magnitud del cambio coincidió en un porcentaje menor, dependiendo del considerado. Entre 0 y 5% de cambio en la tSVCO2, se encontró coincidencia con la tSVO2 en el 44,7% de los casos.
ConclusionesConsiderando que el signo y magnitud de las tendencias de ambas SO2 no son intercambiables, las decisiones terapéuticas basadas en la consideración de estos parámetros deben hacerse con precaución.
Artículo
Comprando el artículo el PDF del mismo podrá ser descargado
Precio 19,34 €
Comprar ahora


