


To establish a conceptual model that links arthritis, functional disability in activities of daily living, and quality of life (QoL).
MethodsA multicentre, cross-sectional, observation study was performed. The location of the arthritis (presence/absence) was recorded. Disability was measured using the Health Assessment Questionnaire Disability Index and the QoL determined using the EQ-5D-3 Level questionnaire. The relationship between the arthritis, disability, and the QoL was evaluated using the structural equation model (SEM).
ResultsPatients: 965 patients with arthritis (mean age=64 years, with 75% females). Arthritis: mean areas affected: 2.8. Areas most frequently affected: knees (67%); lumbar spine (60%) and cervical spine (45%). QoL: the majority of patients did not mention serious problems in the five domains assessed. Disability: “other activities” (mean=1.2); “reach” (mean=1.1) and “walking” (mean=1.0) were the categories that demonstrated greater disability. The SEM showed arthritis, disability and QoL as associated latent variables. Although 92% of the QoL explained the disability, only 5% of the disability was due to the presence/absence of arthritis. The global model that describes arthritis as a cause of disability, and disability was affecting the QoL, had a reasonable goodness of fit (CMIN/DF=5.42; RMR=0.026; RMSEA=0.069).
ConclusionsFunctional disability can explain the decrease in QoL. In theory, arthritis is closely related with disability and QoL, but the model did not mange to fully explain this link. As statistical techniques required good measurement models to correctly determine relationships, conventional medical records seem to be insufficient for this purpose. Other valid measurements of arthritis are needed to provide tests of its direct effect on disability and QoL.
Establecer un modelo conceptual que vincule la afectación artrósica, la discapacidad funcional en las actividades cotidianas y la calidad de vida (CdV).
MétodosEstudio multicéntrico, observacional y transversal. Se registró clínicamente la afectación artrósica (presencia/ausencia), según la localización; se valoró la discapacidad mediante el índice de discapacidad del cuestionario de evaluación de la salud y se determinó la CdV mediante el cuestionario EQ-5D-3L. El vínculo entre la artrosis, la discapacidad y la CdV se evaluó mediante la modelización de ecuación estructural (SEM).
ResultadosPacientes: 965 pacientes con artrosis (edad media=64 años; 75% mujeres). Artrosis: zonas medias afectadas: 2,8. Zonas afectadas con más frecuencia: rodillas (67%); columna lumbar (60%) y cervical (45%). CdV: la mayoría de los pacientes no refirió problemas graves en los 5 dominios evaluados. Discapacidad: «otras actividades» (media=1,2); «alcanzar» (media=1,1) y «caminar» (media=1,0) fueron las categorías que mostraron mayor discapacidad. La SEM presentó la artrosis, la discapacidad y la CdV como variables relacionadas latentes. Aunque el 92% de la CdV explicó la discapacidad, solo el 5% de la discapacidad se debió a la presencia/ausencia de artrosis. El modelo global que describió la artrosis como causante de discapacidad y discapacidad que afectaba a la CdV, tuvo un buen ajuste general (CMIN/DF=5,42; RMR=0,026; RMSEA=0,069).
ConclusionesLa discapacidad funcional puede explicar la disminución de la CdV. En teoría, la artrosis se relaciona estrechamente con la discapacidad y la CdV, pero el modelo no consiguió explicar por completo este vínculo. Como las técnicas estadísticas requieren buenos modelos de medición para determinar correctamente las relaciones, los registros clínicos convencionales parecen insuficientes para este propósito. Se precisan otras mediciones válidas de la afectación artrósica para proporcionar pruebas de su efecto directo en la discapacidad y la CdV.
Arthritis is a generalised slow-developing disease whose prevalence increases with age.1 About 30–40% of people who are over 60 years old have arthritis in the knee and this probably contributes to the general population's disability because it limits their ability to walk, get up from a chair and go upstairs, and is the most common indication for total knee and hip arthroplasty.2–5 The number of people affected by symptomatic arthritis increased from 21 million to nearly 27 million between 1995 and 2005, probably as a reflection of the ageing population and an increase in obesity.6 As regards Spain, in a health survey carried out in 2000, 10.2% and 6.2% of the Spanish population referred to suffering from symptomatic arthritis of the knee and hand, respectively.7,8
Besides the traditional use of physical and biochemical measurements, assessment criteria focusing on patients are more and more important as intervention measurements.9 For example, disability reported by the patient has become a common assessment criteria in clinical studies for rheumatic diseases.10 Any assessment of the results of arthritis interventions should take into account a disability and quality of life (QoL) measurement.11,12 One of the most used self-assessment measurements for physical disability is the Stanford Health Assessment Questionnaire Disability Index (HAQ-DI, Spanish version).13 Although it is often considered to be a specific measurement of the disease, it assesses general physical disability and is not focused on disabilities related to specific diseases.14 With regard to QoL, EuroQoL-5D is a standardised instrument used to measure health. It is applicable to a large variety of states of health and treatments; it provides a simple descriptive profile and an individual index of the state of health.15
The aims of this study were to establish a conceptual model to link arthritis, functional disability in daily life activities and QoL in a population of patients with arthritis that took part in an observational and prospective study (EXPECT16), and evaluate the fit of the model using the structural equation model (SEM).
Patients and methodsDesign of the studyThis was a multicentre, cross-sectional, observational study.16 Patients were required to give written informed consent before they could take part in the study. The trial was performed in accordance with the local ethical committee's and the Spanish Ministry of Health's guidelines, with good clinical practices, as well as with the principles of the Declaration of Helsinki. The protocol was approved by the Clinical Research Ethics Committee of the Hospital Universitario de la Princesa (Madrid, Spain).
Patient populationEach participating doctor recruited a sample from their arthritic patients seen at the centre. Selection/inclusion criteria were: patients of both sexes, over the age of 18 years old; informed consent of their participation in the study; diagnosed with arthritis with at least 1 year of development and with indication of at least 1 prescription for drug treatment (analgesics, non-steroidal anti-inflammatory drugs [NSAIDs] or COX-2 inhibitors) for arthritis; they understood the study procedures and could complete the questionnaire. Amongst the exclusion criteria were taking part in clinical trials or programmes that could change usual clinical practice.
MethodsCompilation of patient dataDuring the visit to the doctor's consultation, the patients completed the questionnaire that recorded basal demographic data (age, gender, level of education) and clinical variables related to arthritis (year it was diagnosed, location, last prescribed treatment and number of treatments received according to the diagnosis).
Assessment criteria communicated by the patientsThe assessment criteria communicated by the patients (ACCP) consisted of questions relating to the general state of health using the Likert scale, pain intensity (visual scale of 0=“no pain” to 10=“maximum pain”) and the perception of health using the visual analogue scale of the EuroQoL EQ-VAS group, the European self-assessment quality of life questionnaire EQ-5D-3L (QoL in 5 aspects, Spanish version) and the HAQ-DI. All the questionnaires were completed by the patients on their own.
Health assessment questionnaire disability index scoreThe HAQ-DI consists of 20 questions that refer to the limitations patients experience in carrying out daily physical activities. Patients were asked what degree of difficulty they found in carrying out an activity on a scale of 0 (no difficulty) to 3 (unable to do so). Patients were also asked if they required assistance or aids for the activity. The HAQ-DI questions were arranged into 8 categories regarding their daily lives, covering themselves, standing up, walking, dressing and grooming, reaching, eating, grasping, activities and hygiene. The maximum score of the category items was used as that score for that category, which essentially reduced the HAQ-DI into a scale of 8 items. If the patient needed assistance or aids for a category and the maximum score of that category items was 0 or 1, the score for the category was increased to 2. A mean score of the categories was calculated to obtain a single total score.
EQ-5D-3L scoreThe EQ-5D-3L consists of the descriptive EQ-5D system and the visual scale of EQ (EQ-VAS). The EQ-5D descriptive system covers the following 5 aspects: mobility, personal care, usual activities, pain/discomfort and anxiety/depression. Each aspect has 3 levels: no problems, some problems and serious problems. Patients were asked to indicate their state of health, ticking the box that corresponded to the most suitable sentence in each of the 5 aspects. The decision is expressed as a 1 digit number that expresses the level selected for that aspect. The numbers for the 5 aspects can be combined into a 5-digit number that describes the patient's state of health.15
Statistical analysisA descriptive analysis of socio-demographic and clinical variablesThe mean and standard deviation for the quantitative variables that followed a normal distribution were calculated. A frequency distribution was presented for the qualitative variables.
Analysis of criteria assessment results reported by patientsThe mean and standard deviation for the quantitative variables that followed a normal distribution were calculated.
Relationship between arthritis, disability and quality of lifeThe link between arthritis, disability and QoL was determined using SEM. This multi-factorial analysis technique makes a hypothesis of the multiple relationships between the unobserved variables (latent) possible and verifies the model with an equation system. This model has 2 parts: (1) a measurement model to identify factors (concepts or latent variables, such as in the factor confirmation analysis17), and (2) a structural model, used to assess causal links and correlations between the theoretical variables.
The relationships between the variables of interest were initially defined by applying theoretic criteria for this study: arthritis was described as having a direct effect on disability and that the disability affected the QoL, and the relationship of the 3 concepts was determined at the same time. Each concept was also assessed using its own measurement model (that is, clinical criteria for arthritis, HAQ-DI for disability and the EuroQoL-5D questionnaire for QoL). Finally, model fit was verified by examining the covariance pattern of the group of data observed. The variables were defined as observed (item responses) or latent (concepts that should be assessed by variables observed, that is, arthritis, disability and QoL, the concepts related).
The SEM model was assessed using the AMOS programme for a structural equation model.18
The statistical program SPSS v.15, Spanish version 14.0, was used for all the statistical analysis.
ResultsSocio-demographic and clinical characteristicsDemographic characteristicsThe clinical data of 965 patients were analysed. The majority of patients (75%) were females, with a mean age of 64 years (SD=11 years); they were mostly housewives (40.4%) or retired people (30.6%).
Clinical characteristicsThe mean interval from the diagnosis of arthritis was 9 years and the mean number of body areas affected was 2.81 (mean=2; SD=1.61). The most frequently affected areas were the knees, lumbar spine and cervical spine. With regard to arthritis treatment, the most commonly prescribed drugs were analgesics, followed by NSAIDs. Nearly 64% of patients had received between 2 and 5 different treatments for arthritis in the last 12 months.16
Assessment criteria communicated by the patientsGeneral state of health (Likert scale)There were 38.5% of patients that qualified their state of health as very good, good or quite good, 33.6% as normal and 45.2% as quite bad, bad or very bad.
Intensity of pain (visual scale)The mean intensity of pain reported by patients was 5.7 (mean: 6; interquartile range [IQR]: 4.2–7.4).
Score for general state of health (visual analogue scale)The score for general state of health was 58.2 (mean: 60; IQR: 45–73). Around 12% of patients indicated that, as a result of their disease, they had great difficulty or impossibility of carrying out physical activities that required little effort; 28%, activities they had great difficulty or impossibility for those that required moderate effort; and up to 75%, for activities that required a great effort16 (Table 1).
Clinical characteristics of the patients.
| Clinical characteristics | No. (%) |
| Years since arthritis diagnosis, mean (SD) | 9.4 (7.6) |
| Location of the arthritis | |
| Hand | 338 (30.1) |
| Hip | 297 (26.4) |
| Knee | 751 (66.9) |
| Shoulder | 218 (19.4) |
| Cervical spine | 513 (45.7) |
| Dorsal spine | 300 (26.7) |
| Lumbar spine | 664 (59.1) |
| Others | 83 (7.4) |
| Treatment for arthritis | |
| Analgesics | 798 (71.1) |
| Non-steroidal anti-inflammatories | 689 (61.4) |
| COX-2 inhibitor anti-inflammatory drug | 406 (36.2) |
| Infiltration and chondroprotectors | 247 (22) |
| Non-pharmacological | 271 (24.1) |
| Number of pharmacological treatments during the last 12 months | |
| 1 | 363 (33.1) |
| 2–5 | 702 (64) |
| >5 | 32 (2.9) |
SD, standard deviation.
The mean HAQ-DI was 0.75 (SD: 0.63). The values that correspond to each category are summarised in Table 2. The areas that showed great disability were “reach” and “other everyday activities.” On the contrary, the area with the least disability was “eating.”
HAQ-DI categories.
| No. | Mean (SD) | |
| HAQ-DI mean | 964 | 0.8 (0.6) |
| Walking | 961 | 1 (0.9) |
| Dressing | 965 | 0.6 (0.8) |
| Standing up | 965 | 0.8 (0.8) |
| Eating | 965 | 0.5 (0.8) |
| Hygiene | 964 | 0.8 (0.8) |
| Reach | 964 | 1.1 (0.9) |
| Grasp | 964 | 0.7 (0.9) |
| Other activities | 962 | 1.2 (1) |
HAQ-DI, Stanford health assessment questionnaire disability index; SD, standard deviation.
As can be seen in Table 3, a large number of patients (88.6%) reported moderate to intense pain and more than 53.2%, mobility problems.
EQ-5D-3L levels.
| No. (%) | |
| Mobility (n=965) | |
| No problem | 451 (46.7) |
| Some problems | 502 (52.0) |
| Have to remain in bed | 12 (1.2) |
| Personal care (n=964) | |
| No problem | 683 (70.9) |
| Some problems | 264 (27.4) |
| Disability | 17 (1.8) |
| Daily activity (n=963) | |
| No problem | 501 (52.0) |
| Some problems | 428 (44.4) |
| Disability | 34 (3.5) |
| Pain/discomfort (n=964) | |
| No pain or discomfort | 110 (11.4) |
| Moderate pain/discomfort | 647 (67.1) |
| Extreme pain/discomfort | 207 (21.5) |
| Anxiety/depression (n=961) | |
| No anxiety or depression | 610 (63.5) |
| Moderate anxiety/depression | 299 (31.1) |
| Extreme anxiety/depression | 52 (5.4) |
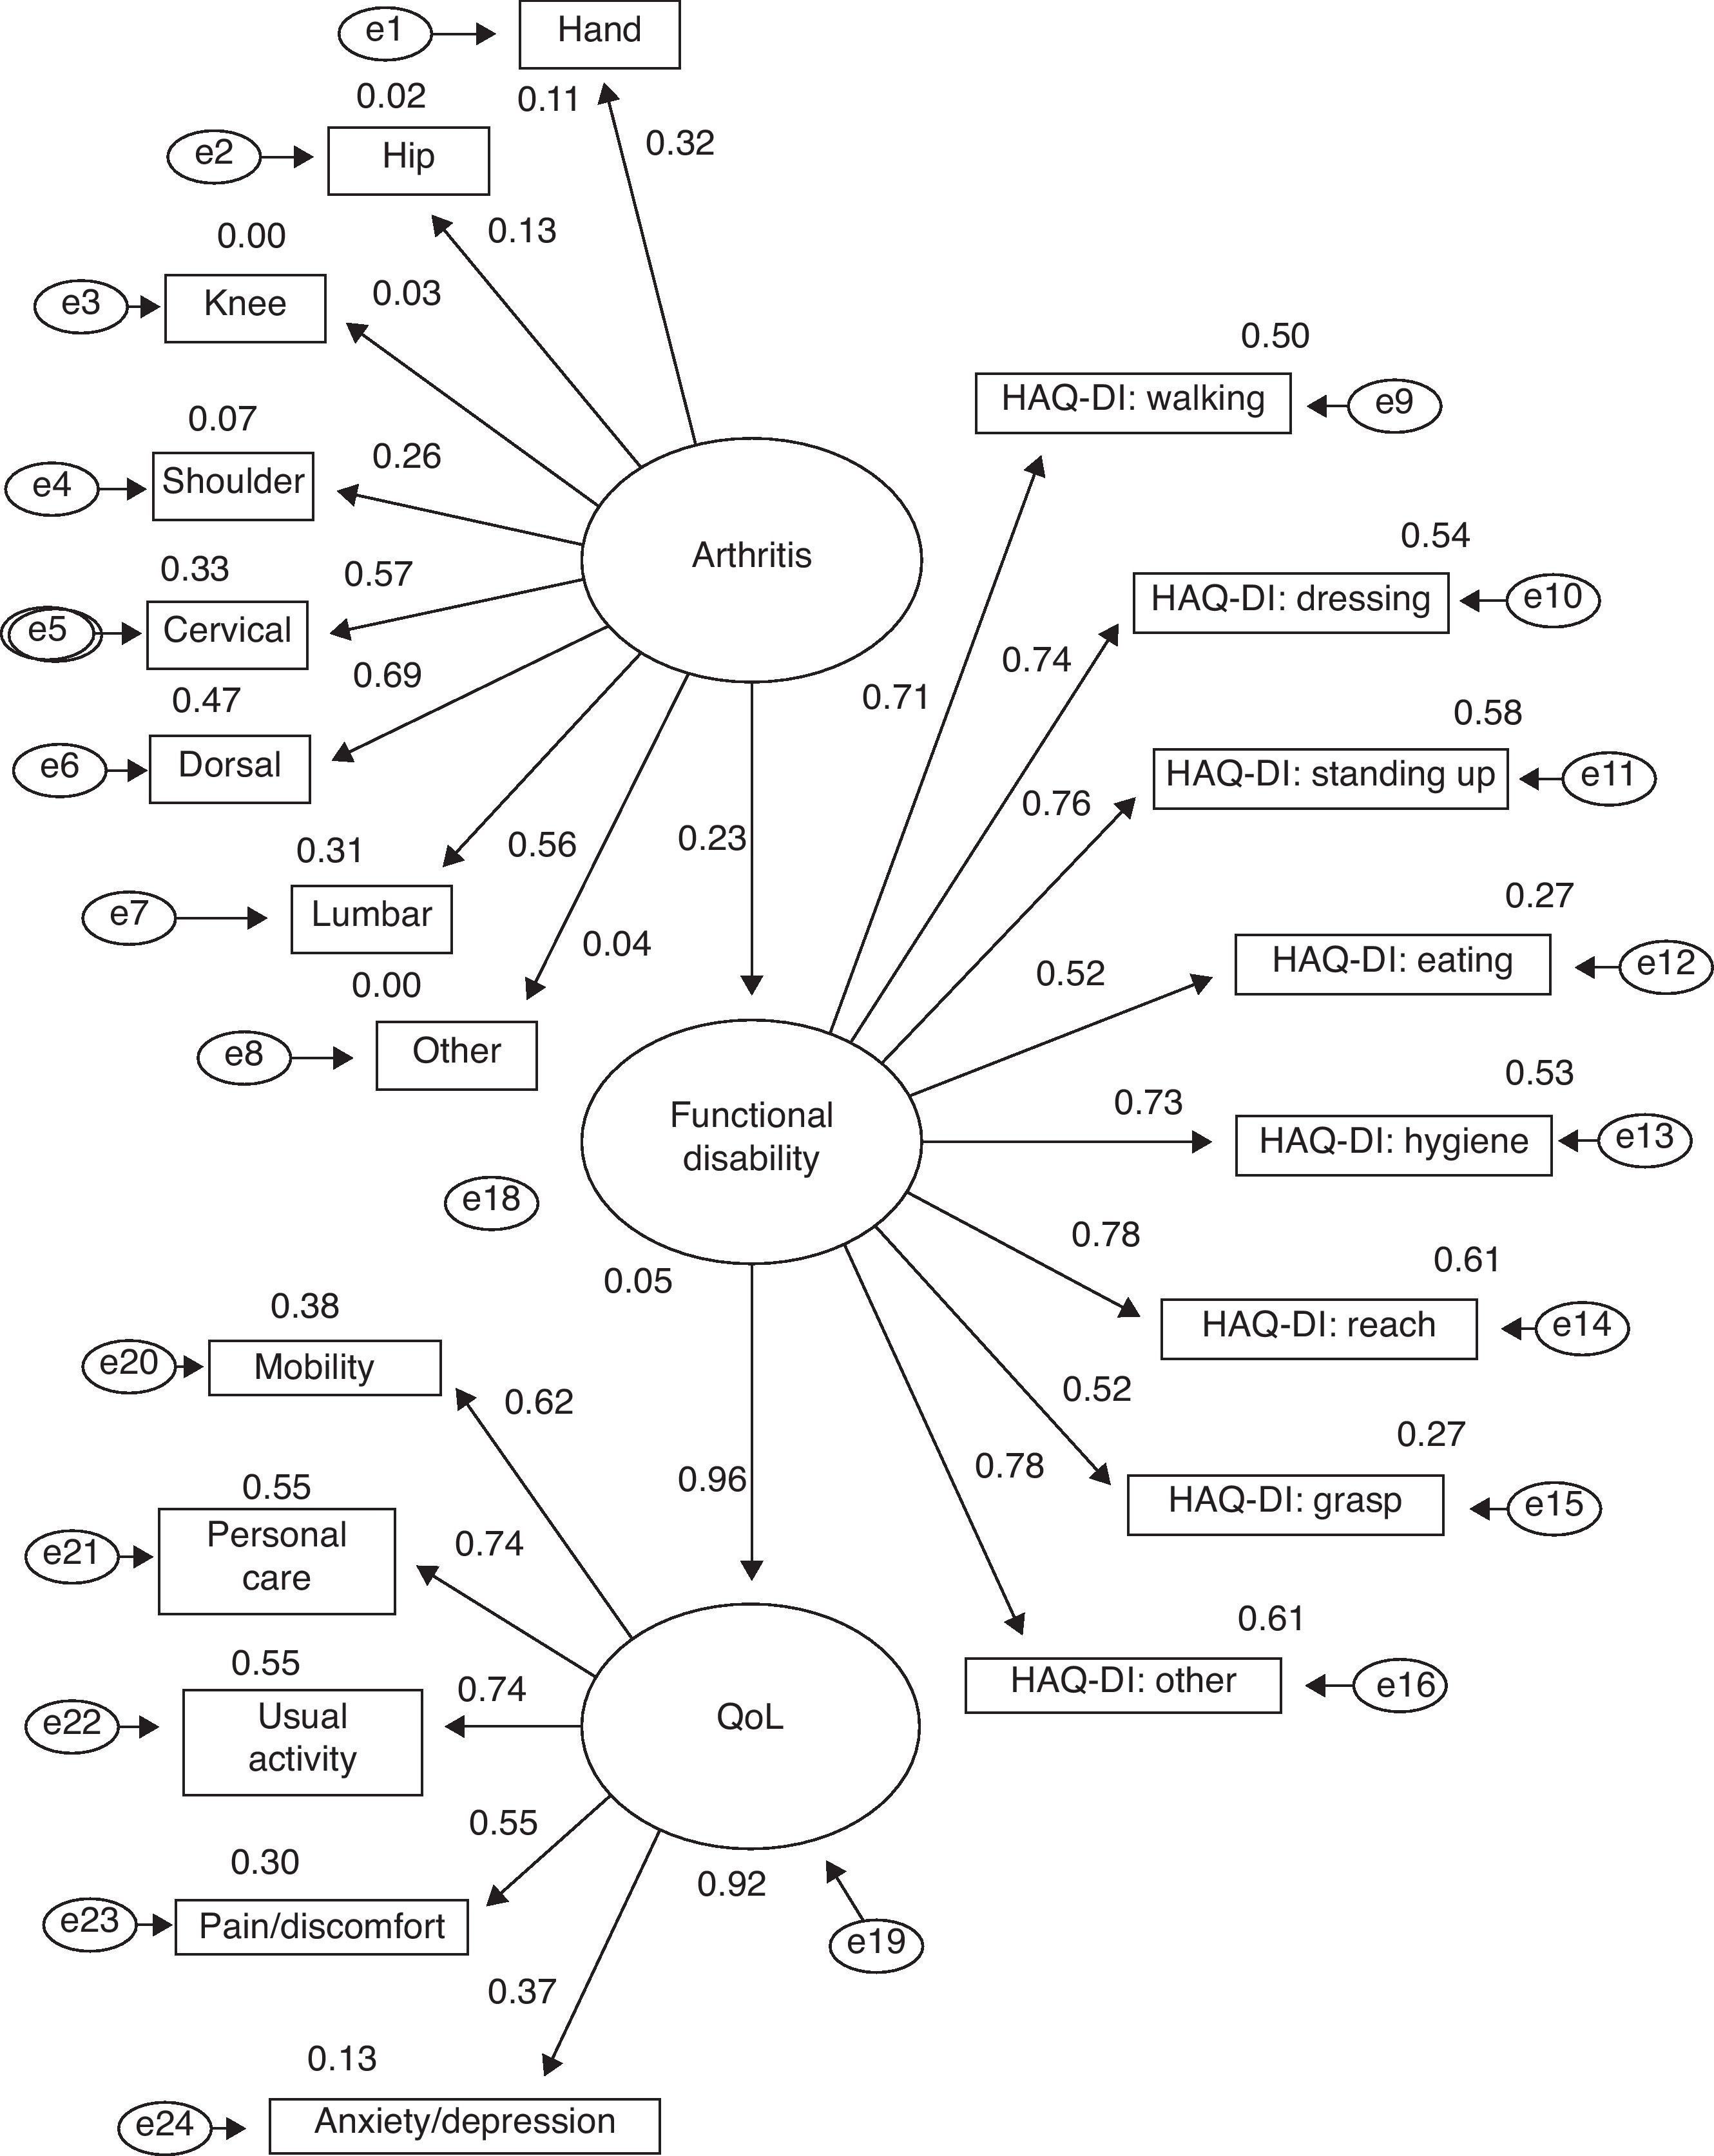
The relationship between arthritis, disability and QoL was determined in a sample of 923 patients with valid values of all the variables included in the SEM model. In Fig. 1, we see the relationships proposed, the measurement model for each concept and the parameter estimates (standardised to help in the interpretation).
. The regression weights (figures over the arrows) express the estimated linear relationship between the factors and between the factor and the items. They are standardised, so they vary between −1 and 1. The figures over the observed variables (squares) and latent variables (ovals) are the regression weights squared. They can be interpreted as the proportion of the variation of the variable that explains the “causal” variable. Consequently, they are values that represent the magnitude of the effect.")
Relationships proposed, the measurement model for each concept and the parameter estimates: standardised estimates. All the assessment instruments have a measurement error, which must be taken into account in estimating the parameters. These are described in the model (e1–e24). The regression weights (figures over the arrows) express the estimated linear relationship between the factors and between the factor and the items. They are standardised, so they vary between −1 and 1. The figures over the observed variables (squares) and latent variables (ovals) are the regression weights squared. They can be interpreted as the proportion of the variation of the variable that explains the “causal” variable. Consequently, they are values that represent the magnitude of the effect.
The adjustment of the model to the empirical data was assessed in 3 different ways. First, we used general adjustment indices (absolute indices such as Chi-squared or the less restrictive Chi-square/degrees of freedom (CMIN/DF) ratio; Goodness of Fit Index (GFI) and Adjusted Goodness of Fit Index (AGFI); and residual indices such as the Root Mean Square Residual (RMR) and Root Mean Square Error of Approximation (RMSEA). Secondly, we used statistical significance of individual parameter estimates which complete the model and, thirdly, the interpretation of the magnitude and direction of the parameter estimates.
“Model assessment” was performed using global measurements. As seen in Table 4, the global model describing arthritis as the cause of disability and the disability affecting QoL had a good general fit: CMIN/DF=5.42 (the recommended value is ≤5); GFI=0.895 and AGFI=0.870 (the perfect adjustment is 1 and the reference value for a good adjustment is 0.9); RMR=0.026 (RMR is the best index when the value is nearer to 0); RMSEA=0.069; confidence interval (CI) of 95%: 0.065–0.073 (RMSEA values that vary between 0.05 and 0.08 indicate a good adjustment).19–23 The second phase to interpret the model is that of “statistical significance of the parameter estimates.” Only 3 parameter estimates, 3 location categories for arthritis (knee, hip and other area), did not reach a statistical significance level (with a level of 0.05). The other 18 parameter estimates were significant and indicated a relationship between the variables that was not attributable to chance.
The third phase in assessing the model fit refers to the “assessment of the magnitude and direction of the parameter estimates.” All the variables observed seem to be good indicators of their related factor, not only for disability but for QoL as well, but not so for the arthritis (Table 5). Only 5% of the disability was explained by the presence/absence of arthritis (regression weight of 0.23; R2=0.05). However, 92% of the QoL was explained by the disability (regression weight of 0.96; R2=0.92).
DiscussionThe results of this observational and prospective study reveal that the majority of patients included had 2 or more areas affected by arthritis, with the most frequent locations being: knee and lumbar and cervical spine. With respect to QoL, the majority of patients did not report serious problems in the 5 areas assessed (mobility, personal care, daily activities, pain/discomfort and anxiety/depression). With regard to disability, the 2 categories with the greatest disability were “other activities” and “reach”.
With respect to the development of the conceptual model to link arthritis, functional disability and QoL in the arthritic population analysed, this presented variables as related latent variables. Thus, 92% of QoL was explained by disability and only 5% of the disability was explained by arthritis. The global model describing arthritis as the cause of disability and the disability affecting the QoL had a good general fit. It is well known that the limitations of functional capacity reduce the QoL of arthritis patients.24–27 Similarly, we generally consider that arthritis is the main cause of disability in adults.28–37 In effect, there is no doubt that arthritis is specifically related to disability, as adults age. The risk of arthritis increases with age, so that at 80 years of age nearly everybody shows radiographic signs of joint degeneration.38,39 However, a lot is still to be discovered on the specific contributions of arthritis and the intervening variables in the development of the disability. Ferrucci et al. showed that as people age, a larger proportion of disability is produced with a slower and progressive evolution, compared to a “catastrophic disability” with a slower onset.40–42 The relationship dependent on the time between arthritis and disability could explain the low percentage of disability due to arthritis. Exploratory factorial analysis is a common instrument of grounded theory (that is, from theories that derive from data analysis). However, SEM models constitute an explicit compromise with the previous theory extracted from clinical expertise.23 The first SEM model described showed the relationships expected among the concepts and this was later verified with empirical data (comparing the covariance matrix observed with the one expected by the model described; this is the reason why the models are sometimes called structural covariance models24). Therefore, if the model fit is good, we say that the model is “confirmed”. These models can also indicate causal relationships between the variables.25 However, we must point out that the data that make up the covariance matrix are transversal, which is why the conclusions extracted from the results must be interpreted with care. Only experimental designs in data compilation guarantee causal relationships among concepts.24–34 With respect to the second study aim (that is, the assessment of model fit using integral SEM), several models were assessed. We should point out that arthritis directly affects QoL in 2 ways (as arthritis affects disability and disability has its own effect on QoL). However, once this alternative model had been assessed, we proved that the new specification did not improve the results. Consequently, although the general adjustment indices were maintained practically the same, less than 1% of the QoL was explained by arthritis (regression weight of 0.02; R=0.004). Therefore, by using the parsimony criterion, the simplest model was chosen. In second place, with the data available, functional disability could explain the reduction of QoL (92% of the variation). In theory, arthritis has a close relationship to disability and QoL, but the model was not able to completely explain this link (5% of the variation). Given that technical statistics require good measurement models to correctly assess the relationships, the information usually noted in clinical records seemed insufficient for this purpose. Dichotomous variables (such as the recording of arthritis, with values of presence/absence) worked badly with the parameter estimate records because the quantification of these estimates was based on the correlation matrix between the variables. Although there are some methods that use tetrachoric correlation coefficients, which partly resolve this problem, other valid measurements for arthritis are needed to properly determine their repercussion in disability and QoL.43,44
With respect to the limitations of the study, the main one is its nature, as it is an observational study, with a non-probability sampling. However, there is no sense in carrying out these type of studies in a clinical trial environment and although a probability sampling was not performed, the method used in this study is the one with the least bias. Another point to highlight with regard to the seriousness of the patients examined is that patients consulted or followed up by traumatologists are generally patients with more severe arthritis than the mean of patients with arthritis.
It is appropriate to conclude that functional disability explained the reduction of QoL. In theory, arthritis has a close relationship to disability and QoL, but the SEM was not able to completely explain this link. This could be attributed to insufficient collection of clinical data in the records. Therefore, other valid measurements for arthritis are necessary, amongst which are included functional measurements that better define the severity of the arthritis, to properly determine their repercussion in disability and QoL.
Level of evidenceEvidence level III.
Ethical responsibilitiesProtection of people and animals. The authors declare that the procedures followed conform with the ethical guidelines of the human experimentation committee in charge and are in accordance with the World Medical Association and the Declaration of Helsinki.
Data confidentiality. The authors declare that they followed their working centres’ protocols regarding patient data publication and that all the patients included in this study received sufficient information and gave their written informed consent to take part in this study.
Right to privacy and informed consent. The authors obtained the informed consent of the patients and/or subjects referred to in this article. This document is filed with the corresponding author.
Conflict of interestsJCA, AD and JS have no conflict of interests to declare. MTC and GC declare that they are employees of Merck Sharp & Dohme de España S.A. (Madrid, Spain).
This researcher-initiated project was funded with a grant from Merck Sharp & Dohme. The medical writing was carried out by Pipeline Biomedical Resources S.L.
Please cite this article as: Cordero-Ampuero J, et al. Vinculación de la afectación artrósica, la discapacidad fun-cional y la calidad de vida mediante un modelo de ecuación estructural. Rev Esp Cir Ortop Traumatol. 2012;56:197-204.
This work was partially presented at the 13 European Congress of the ISPOR, held in Prague from 6 to 9 November 2010 (summary PMS61).

www.publicationethics.org.