

Nearly 168 species of Mammillaria are endangered at the global level; most of these cactus species exhibit a narrow distribution range and/or small population size. Recently, the first population genetics studies showed low to moderate levels of heterozygosity in this genus. This study examines Mammillaria huitzilopochtli and M. supertexta, 2 threatened species endemic to the central semiarid region of Mexico, to propose conservation actions, as well as to identify the underlying processes that determine the levels of population genetic diversity in these species. A total of 106 and 148 individuals from 5 populations were sampled for M. huitzilopochtli and M. supertexta, respectively. Each individual was genotyped at 8 microsatellite loci. The levels of heterozygosity were high in the 2 species, but differences in allelic richness were detected. Genetic differentiation between populations was significant in both species, with evidence for isolation by distance in M. supertexta but not in M. huitzilopochtli. We postulated that genetic drift; geographic isolation and inbreeding are the most important processes shaping the populations' genetic variability and differentiation. We identified 3 and 4 genetic groups for M. huitzilopochtli and M. supertexta, respectively. In the Tehuacán-Cuicatlán valley these groups may be used as references to guide plant conservation efforts under ecosystem-based approach.
Cerca de 168 especies of Mammillaria están amenazadas a nivel global, la mayoría de estas especies muestran una distribución restringida y/o poblaciones pequeñas. Recientemente, los primeros estudios de genética poblacional mostraron niveles de heterocigosidad bajos a moderados en este género. Este trabajo estudia a Mammillaria huitzilopochtli y M. supertexta, dos cactus amenazados que son endémicos a la región semiárida central de México para proponer acciones de conservación así como para identificar los procesos subyacentes que determinan sus niveles de diversidad genética poblacional. Un total de 106 y de 148 individuos de 5 poblaciones se muestrearon para M. huitzilopochtli y M. supertexta, respectivamente. Para cada individuo se determinó su genotipo con 8 loci de microsatélites. Los niveles de heterocigosidad fueron altos en las dos especies, pero fueron detectadas diferencias en su riqueza alélica. La diferenciación genética entre poblaciones fue significativa en las dos especies, con evidencia de aislamiento por distancia en M. supertexta pero no en M. huitzilopochtli. Proponemos que la deriva génica, el aislamiento geográfico y la endogamia son los procesos más importantes que moldean la variabilidad genética de las poblaciones y la diferenciación en estas especies. Identificamos 3 y 4 grupos genéticos para M. huitzilopochtli y M. supertexta, respectivamente. En el valle de Tehuacán-Cuicatlán estos grupos podrían ser usados como una referencia para guiar los esfuerzos de conservación de las plantas bajo una perspectiva de conservación del ecosistema.
Population genetic studies may be useful for identifying potential conservation actions for short-globose cacti (Ibarra-Suárez, 2009; Solórzano et al., 2009; Tapia-Salcido, 2011; Terry et al., 2012). However, in Cactaceae, most population genetic studies based on allozymes markers have been conducted in conspicuous columnar cacti (e.g., Nassar et al., 2001; Hamrick et al., 2002 and studies cited therein; Moraes et al., 2005; Parra et al., 2008). The genetic results obtained for these cacti cannot be used as references for inconspicuous short-globose cacti (cacti ~ 7 to 15cm in length) because there are notable differences in life-history traits and demographic parameters between the 2 groups. The genera that are most representative of short-globose cacti are Ariocarpus, Astrophytum and Mammillaria (Arias et al., 1997). Recently, molecular technologies based on microsatellites were developed for species of these genera (Terry et al., 2006; Hughes et al., 2008; Solórzano et al., 2009). However, these cacti continue to be underrepresented in population genetics studies; this is despite the fact that a number of them are of national or international conservation concern (e.g., Semarnat, 2010, IUCN, 2013, USDA-Plant Database, 2013) with trade regulated by international agreements (UNEP-CITES, 2013). Fragmentation and habitat loss, as well as illegal trade, are mentioned as the main threats to the long-term conservation of these cacti (Glass, 1998, IUCN, 2013). The effects of these threats on the genetic diversity and levels of differentiation in the short-globose cacti have not been studied. However, the results obtained in other plants can provide guidelines to predict possible effects on the genetic diversity of short-globose cacti populations.
In plants, the geographical distribution, population size, pollination system and seed dispersion are the main factors that determine the levels of genetic diversity within and among populations (e.g., Ellstrand, 1992; Ellstrand and Elam, 1993; Nassar et al., 2001). These processes and factors do not have to act in conjunction to have a significant impact on the genetic properties of populations. For example, pollination performed by generalist insects promotes high genetic differentiation (Kramer et al., 2011; Magalhaes et al., 2011), whereas plants that are pollinated by wind or vertebrates tend to be genetically homogenous (Ellstrand, 1992; Nassar et al., 2001), irrespective of the geographical distribution pattern of the populations. In contrast, small population size combined with a narrow distribution range has been associated with low levels of genetic diversity (cf. Purdy and Bayer, 1996; Dodd and Helenurm, 2002; Gibson et al., 2008) and with high intraspecific genetic differentiation promoted by genetic drift (Frankham et al., 2002).
This study focused on Mammillaria, which consists of approximately 171 species (Anderson, 2001; cf 199 species, Hunt, 1999). All these species differ in their geographic distribution range, in the number and size of the populations thus, we chose Mammillaria huitzilopochtli D. R. Hunt and M. supertexta Mart. Ex Pfeiff as biological models for the genus, to contrast them in order to determine the relevant processes involved in their genetic variability. At global level, the former is listed as Least Concern Species, whereas the latter is Endangered species (IUCN, 2013). The worldwide distribution of these short-globose cacti species is limited to a small portion of the semiarid region of the Tehuacán-Cuicatlán valley, in central Mexico. There are approximately 7 small populations of M. huitzilopochtli and only 5 of M. supertexta (Peters and Martorell, 2001). Additionally, these species have an insular distribution pattern, which has been a correlated to highly specialized pH and organic matter contents of the soils in which they grow (Solórzano et al., 2010). The total occupancy area covers nearly 1057 ha and 451 ha for M. huitzilopochtli and M. supertexta, respectively (Peters and Martorell, 2001). These 2 species have low population densities that vary from 0.045 to 0.60 individuals / m1 for M. huitzilopochtli and from 0.015 to 0.63 individuals / m2 for M. supertexta (Peters and Martorell, 2001). Fecundity data are unknown, which limits understanding of population size dynamics in these species, but a declining population size has been predicted for both by modeling simulations (Avendaño-Calvo, 2007, Flores-Martínez et al., 2010). No data are available regarding the pollination biology and seed dispersion of the studied species. The flowers of M. huitzilopochtli are red-colored and measure 12 to 17mm long while those of M. supertexta are dark-pink and measure 10 to 13mm long (Arias et al., 1997); these observations suggest that some small insects could be the pollinators. Seed dispersion appears to occur by passive mechanisms such as gravity and precipitation (Peters and Martorell, 2001).
Based on the above information, particularly the restricted geographic distribution, low population densities and poor gamete dispersion; we hypothesized that M. huitzilopochtli and M. supertexta show depleted levels of genetic variation and high genetic differentiation among populations. We further propose that genetic drift and gene flow are the main processes that have shaped the extent of the genetic variability in these cacti species. Strong genetic differentiation among populations would enable us to determine which of them might represent genetic reservoirs for conservation efforts.
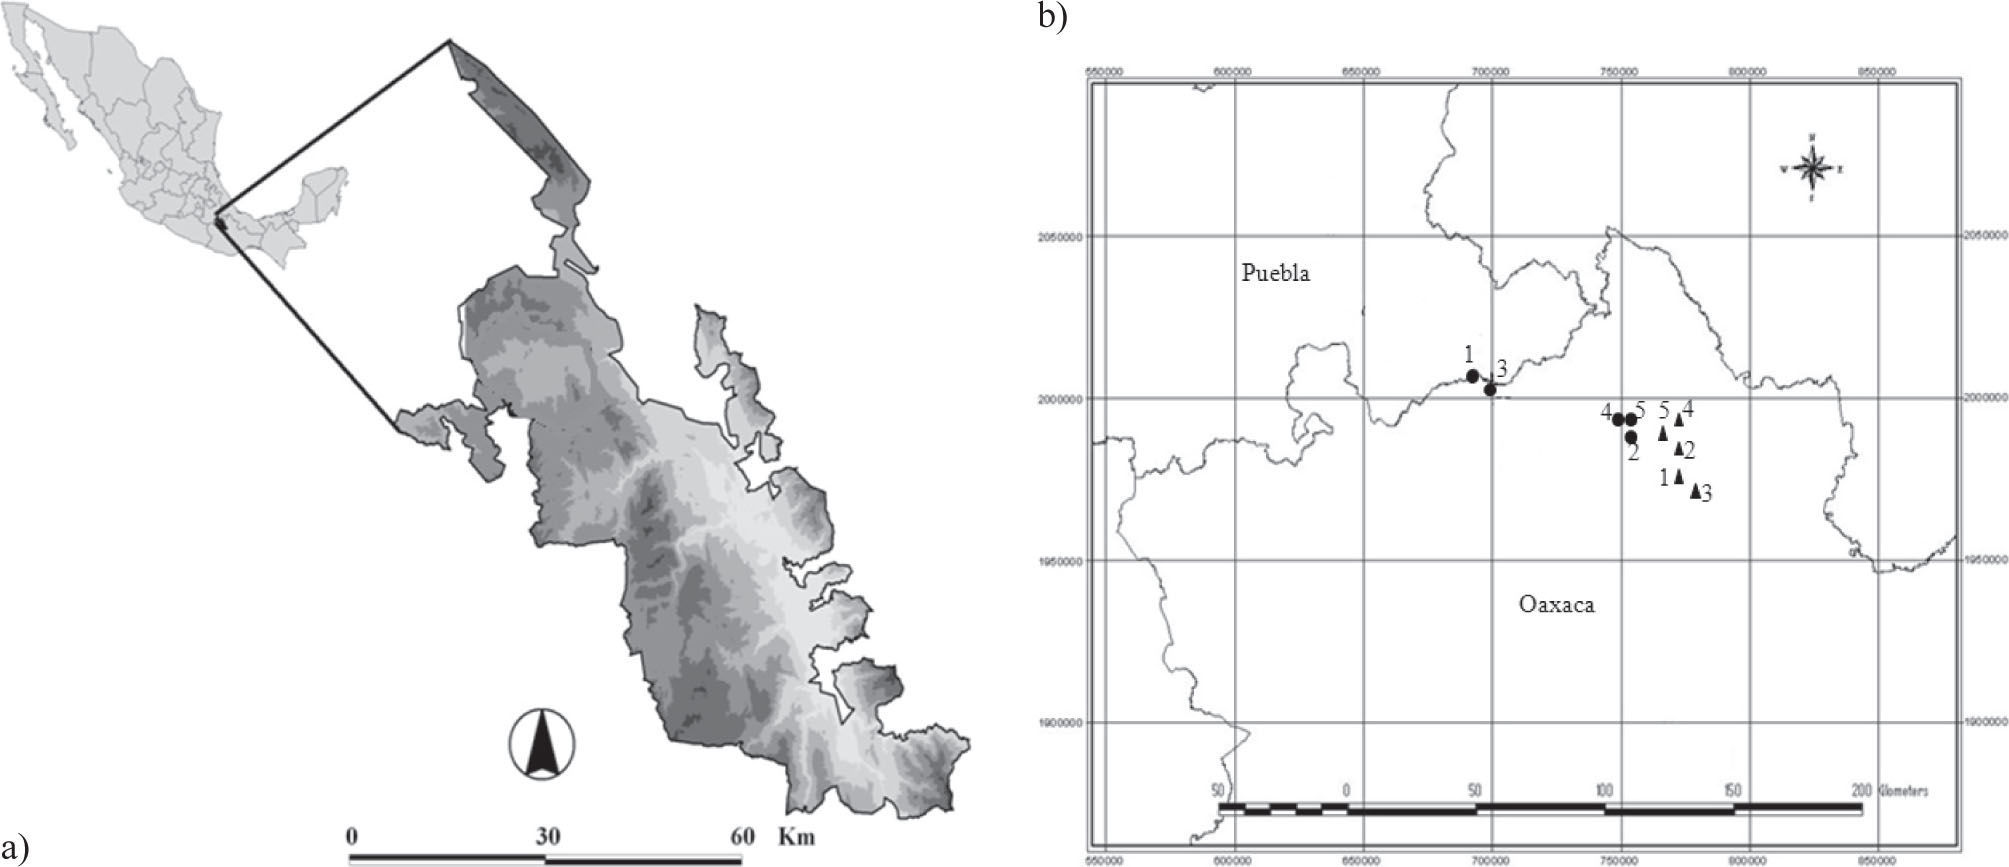
Materials and methodsThe 10 sampled populations are located in the semiarid region of the Tehuacán-Cuicatlán valley, which is situated in southeast Puebla and northwestern Oaxaca states, Mexico (Fig. 1). This valley is geographically isolated from the northern arid region and is enclosed by the mountain chains of East Sierra Madre Oriental and West Sierra Madre. This valley is considered a world biodiversity pool because it contains approximately 3 000 vascular plant species, of which 14% are endemic (Dávila et al., 2002). In this valley, 81 cacti species have been recorded (Arias et al., 1997); 22 of them belong to the Mammillaria genus and 13 are endemic to this valley (Peters and Martorell, 2001). In addition, this valley shows high microenvironmental heterogeneity defined by a mosaic of vegetation types (Valiente-Banuet et al., 2000), temperatures, annual precipitation levels and edaphic substrates (INEGI 2011).
, Location of the study areas within the Tehuacán-Cuicatlán valley; b), the inset shows the worldwide distribution range of M. huitzilopochtli (triangle symbol) (1= Cacahuatal, 2= Coyula, 3= Cuicatlán, 4= Ruinas, 5= Santiago) and M. supertexta (circle symbol) (1= Comulco, 2= La Escoba, 3= Lucia, 4= Puente, 5= Quiotepec).")
a), Location of the study areas within the Tehuacán-Cuicatlán valley; b), the inset shows the worldwide distribution range of M. huitzilopochtli (triangle symbol) (1= Cacahuatal, 2= Coyula, 3= Cuicatlán, 4= Ruinas, 5= Santiago) and M. supertexta (circle symbol) (1= Comulco, 2= La Escoba, 3= Lucia, 4= Puente, 5= Quiotepec).
Because the studied species exhibit an allopatric distribution, 5 different sites were sampled for each species (Fig. 1). For genetic analyses (Table 1) a small tissue sample of approximately 0.5cm2 was collected from 17 to 36 individuals in each of the 10 sampled sites (Fig. 1). In total, 106 and 148 samples from 5 populations were sampled for M. huitzilopochtli (Table 2) and M. supertexta (Table 3), respectively. Each sample was individually wrapped in a plastic bag and stored in liquid nitrogen at −70°C.
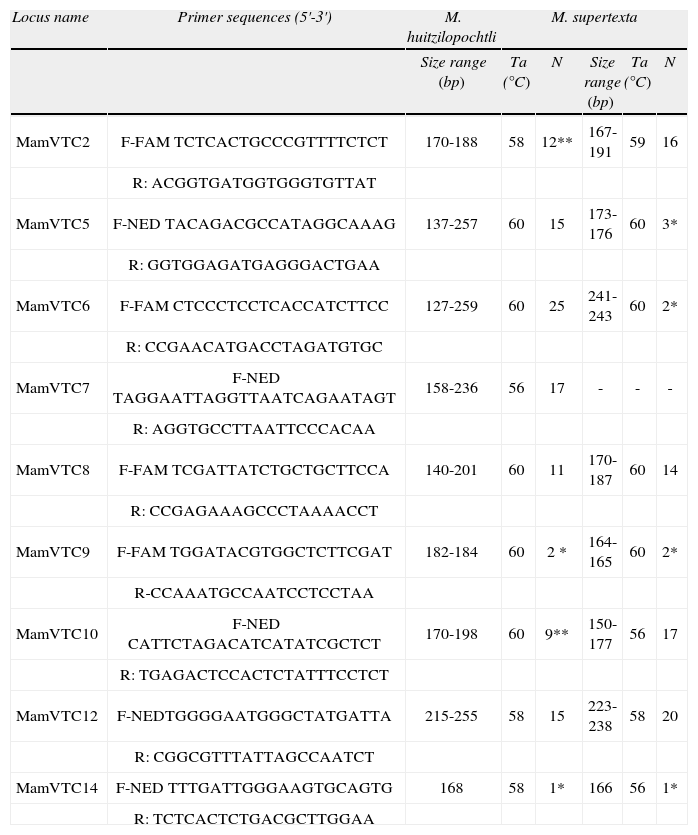
Names of the microsatellite loci amplified for M. huitzilopochtli and M. supertexta, with sequences for forward (F) and reverse (R) primers, including the added fluorochrome (FAM or NED). For each species, the size range of amplified fragments, annealing temperatures (Ta) and the total number of alleles per locus (N) is listed. The asterisk indicates monomorphic loci and a double asterisk indicates that the locus was discarded due to the presence of null alleles. The sequences and repeat motifs of loci MamVTC6, MamVTC7 and MamVTC14 are published here for the first time because these loci were monomorphic in the source species M. crucigera
| Locus name | Primer sequences (5'-3') | M. huitzilopochtli | M. supertexta | ||||
| Size range (bp) | Ta (°C) | N | Size range (bp) | Ta (°C) | N | ||
| MamVTC2 | F-FAM TCTCACTGCCCGTTTTCTCT | 170-188 | 58 | 12** | 167-191 | 59 | 16 |
| R: ACGGTGATGGTGGGTGTTAT | |||||||
| MamVTC5 | F-NED TACAGACGCCATAGGCAAAG | 137-257 | 60 | 15 | 173-176 | 60 | 3* |
| R: GGTGGAGATGAGGGACTGAA | |||||||
| MamVTC6 | F-FAM CTCCCTCCTCACCATCTTCC | 127-259 | 60 | 25 | 241-243 | 60 | 2* |
| R: CCGAACATGACCTAGATGTGC | |||||||
| MamVTC7 | F-NED TAGGAATTAGGTTAATCAGAATAGT | 158-236 | 56 | 17 | - | - | - |
| R: AGGTGCCTTAATTCCCACAA | |||||||
| MamVTC8 | F-FAM TCGATTATCTGCTGCTTCCA | 140-201 | 60 | 11 | 170-187 | 60 | 14 |
| R: CCGAGAAAGCCCTAAAACCT | |||||||
| MamVTC9 | F-FAM TGGATACGTGGCTCTTCGAT | 182-184 | 60 | 2 * | 164-165 | 60 | 2* |
| R-CCAAATGCCAATCCTCCTAA | |||||||
| MamVTC10 | F-NED CATTCTAGACATCATATCGCTCT | 170-198 | 60 | 9** | 150-177 | 56 | 17 |
| R: TGAGACTCCACTCTATTTCCTCT | |||||||
| MamVTC12 | F-NEDTGGGGAATGGGCTATGATTA | 215-255 | 58 | 15 | 223-238 | 58 | 20 |
| R: CGGCGTTTATTAGCCAATCT | |||||||
| MamVTC14 | F-NED TTTGATTGGGAAGTGCAGTG | 168 | 58 | 1* | 166 | 56 | 1* |
| R: TCTCACTCTGACGCTTGGAA | |||||||
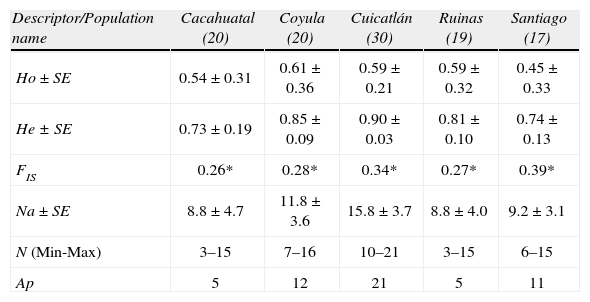
Mean values ± SE of the descriptors of genetic variability estimated for each population of M. huitzilopochtli; the number of individuals analyzed for each population is given in parenthesis. Ho and He refer to the observed and expected heterozygosity levels, respectively. Significant inbreeding coefficient (FIS) differences from zero are indicated with an asterisk (p<0.05). The mean number of alleles estimated over loci (Na), the minimum and maximum number of alleles (N) across loci by population and the total number of private alleles per population (Ap) are given
| Descriptor/Population name | Cacahuatal (20) | Coyula (20) | Cuicatlán (30) | Ruinas (19) | Santiago (17) |
| Ho ± SE | 0.54±0.31 | 0.61±0.36 | 0.59±0.21 | 0.59±0.32 | 0.45±0.33 |
| He ± SE | 0.73±0.19 | 0.85±0.09 | 0.90±0.03 | 0.81±0.10 | 0.74±0.13 |
| FIS | 0.26* | 0.28* | 0.34* | 0.27* | 0.39* |
| Na ± SE | 8.8±4.7 | 11.8±3.6 | 15.8±3.7 | 8.8±4.0 | 9.2±3.1 |
| N (Min-Max) | 3–15 | 7–16 | 10–21 | 3–15 | 6–15 |
| Ap | 5 | 12 | 21 | 5 | 11 |
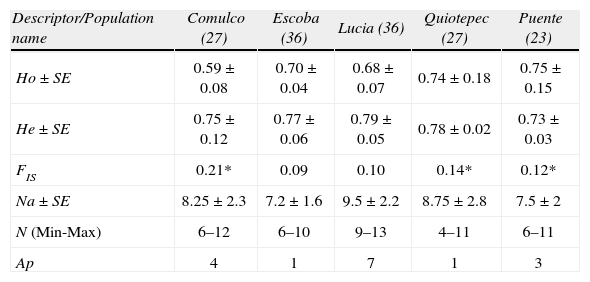
Mean values ± (SE) of genetic variability descriptors estimated for each population of M. supertexta, in parenthesis the number of individuals analyzed by population. Ho and He refer to the observed and expected heterozygosity levels, respectively. Significant inbreeding coefficient (FIS) differences from zero are indicated with an asterisk (p<.05). The Na represents the mean number of alleles estimated over loci; the minimum and maximum number of alleles (N) across loci by population. Ap represents the total number of private alleles recorded by population
| Descriptor/Population name | Comulco (27) | Escoba (36) | Lucia (36) | Quiotepec (27) | Puente (23) |
| Ho ± SE | 0.59±0.08 | 0.70 ± 0.04 | 0.68 ± 0.07 | 0.74 ± 0.18 | 0.75 ± 0.15 |
| He ± SE | 0.75±0.12 | 0.77±0.06 | 0.79±0.05 | 0.78±0.02 | 0.73±0.03 |
| FIS | 0.21* | 0.09 | 0.10 | 0.14* | 0.12* |
| Na ± SE | 8.25±2.3 | 7.2±1.6 | 9.5±2.2 | 8.75±2.8 | 7.5±2 |
| N (Min-Max) | 6–12 | 6–10 | 9–13 | 4–11 | 6–11 |
| Ap | 4 | 1 | 7 | 1 | 3 |
Total genomic DNA was isolated using a QIAGEN DNeasy Plant Mini Kit following the manufacturer's instructions (QIAGEN, Germantown, Maryland, USA). Isolated DNA was visualized on 0.8 % agarose gels stained with ethidium bromide using UV light. A total of 11 loci were screened including 8 polymorphic primers designed for M. crucigera (Solórzano et al., 2009), as well as the loci MamVTC6, MamVTC7 and MamVTC14, which proved to be monomorphic in M. crucigera this species. The program MicroChecker (Oosterhout et al., 2004) was used to search null alleles. Those loci with significant differences between the observed and the expected values in the allele frequencies were discarded of all statistical analyses (Table 1).
Each of the primers was assayed in individual PCR reactions of 10μL of final volume, each one prepared with 10–20ng of total genomic DNA, 5μM of forward and reverse primers, 0.4μM of dNTP mix, 2.0mM of MgCl2, 4mM Tris-HCl (pH 8.3), 4X BSA and 2 U Taq (Invitrogen). The PCR reactions were performed in the Mastercycler Gradient (Eppendorf) program initiated with a denaturing at 94 °C for 3min, followed by 35 cycles with denaturing for 10s at 94 °C, 10s at the annealing temperatures listed in Table 1 and a 10s extension at 72 °C, followed by a final extension at 72 °C for 5min. The PCR products were visualized on 1.2 % agarose gels stained with ethidium bromide; a negative control and a 100 bp ladder size standard (Invitrogen) were included on each gel. To determine the allele sizes new PCR reactions were prepared following the same conditions above described but using the forward primers fluorescently labeled with the fluorochromes NED or FAM (Table 1) and the size standard used was ROX 500. These electrophoretic reactions were run on an ABI 3100 sequencer (Applied Biosystems Inc., Foster City, California, USA). All of the microsatellite electropherograms were analyzed with Peak Scanner V1.0 (Applied Biosystems Inc.) and visually checked to reduce overestimation of alleles.
Genetic diversityFor each species, the observed heterozygosity (Ho) and the expected heterozygosity (He) were estimated. In addition, the mean number of alleles (Na) for the population was estimated for each species using the program Arlequin V.3 (Excoffier, 2006). The number of private alleles (Ap) in each population of each species was calculated using the DAF software (Lewis and Zaykin, 2001). Inbreeding coefficients were calculated for each species (FIT) and for each population (FIS) following Nei's (1987) equations. Deviations from Hardy-Weinberg equilibrium (HWE) were calculated following the procedure developed by Guo and Thompson (1992), which is based on the Fisher's exact test with 1 million Markov chains programmed in Arlequin V.3 (Excoffier, 2006). This program was also used to test the linkage equilibrium (LE) between each pair of loci based on a likelihood-ratio test (Slatkin and Excoffier, 1996). We performed a Bonferroni correction test described in Sokal and Rohlf (2003) to test the significance of multiple comparisons for HWE and LE. The program BOTTLENECK 1.2.02 (Cornuet and Luikart, 1996) was used to infer a population bottleneck based on the significant differences between observed and expected heterozygosity excess under 2 mutation models, IAM (infinite alleles model) and SMM (stepwise mutation model). Altogether 100 000 simulations were run in each population of the 2 species. If the p<0.05 associated to the sign test the hypothesis of mutation-drift equilibrium is refused, consequently a population bottleneck might have occurred.
Genetic differentiationFor each species, population genetic structure was described by calculating the mean genetic differentiation with the RST that is equivalent of Wrights's FST. The values of FST are conventionally interpreted as little differentiation (0–0.05), moderate (0.05–025) and pronounced differentiation (> 0.25) (Freeland, 2008). Here, we calculated the RST associated to a p-value, both among all populations and in paired comparisons between populations. Rates of gene flow (Nm) were calculated assuming gene flow-genetic drift equilibrium model (Wright, 1951). To define the number of genetic groups in each species, we used the SAMOVA 1.0 program (Dupanloup et al., 2002), then the K (number of groups) and their values of ΦCT (differentiation among groups) were based on simulated annealing processes of 100 in all runs. This program failed (errors encountered during the computations), in those cases when we supposed K=1, and 5 groups in each species. The GDA software (Lewis and Zaykin, 2001) was used to estimate Nei's (1978) unbiased genetic identity between populations
ResultsPopulation genetic diversityIn M. huitzilopochtli, mean Ho was of 0.55 and mean He was 0.80. The total number of alleles was of 107, and the Na was 11.8. The inbreeding coefficient calculated for whole populations was high and significantly different of zero (FIT=0.58, p=0.004). Across populations, the observed heterozygosity levels were lower (HO=0.45–0.61) than the expected levels (0.73–0.90). The 4 populations had pronounced and significant levels of inbreeding (FIS, Table 2). Across populations, heterogeneity in allelic richness was detected (N (min-max), Table 2); the largest number of Ap was recorded in Cuicatlán (Table 2). The 18 comparisons between observed and expected heterozygosities by locus across populations showed that only MamVTC8 was in HWE in Quiotepec, Cacahuatal and Coyula and only MamVTC12 was in HWE in Quiotepec and Coyula. The locus MamVTC7 was also in HWE in Coyula. However, of the 36 paired comparisons conducted to determine LE, only 4 were at equilibrium. The population bottleneck analyses show that IAM model detected that in Coyula and Cuicatlán the loci MamVTC2, MamVTC5 and MamVTC6 have an excess of heterozygosity (p<0.01), whereas the model SMM did not find evidence of drastic reduction in the population size (p>0.09).
In M. supertexta, also mean observed heterozygosity (0.69) was lower than the expected heterozygosity (0.76). The total number of alleles was of 75, and the Na was 9.3; the greatest number of Ap was concentrated in Lucia population (Table 3). However, the inbreeding coefficient calculated for the entire population was moderate but significant (FIT=0.17, p=0.001). Across the 4 populations, the inbreeding coefficients varied from low to moderate, with 3 populations showing a significant value (Table 3). Across populations, only 4 loci were in HWE after Bonferroni correction: MamVTC2 and MamV5 in the Puente population, MamV5 in Comulco and MamVTC8 at La Escoba. LE was found in all comparisons, except between the MamVTC2 and MamVTC5 alleles at the La Escoba site.
The results of the population bottleneck indicate that only the model IAM shows that the locus, MamVTC2 has an excess of heterozygosity in Puente and Quiotepec population, whereas the MamVTC8 has heterozygosity excess (p<0.002) in all populations except in Quiotepec (p>0.08). The results obtained with the model SMM do not suggest population bottleneck for any of the loci non significant (p>0.1).
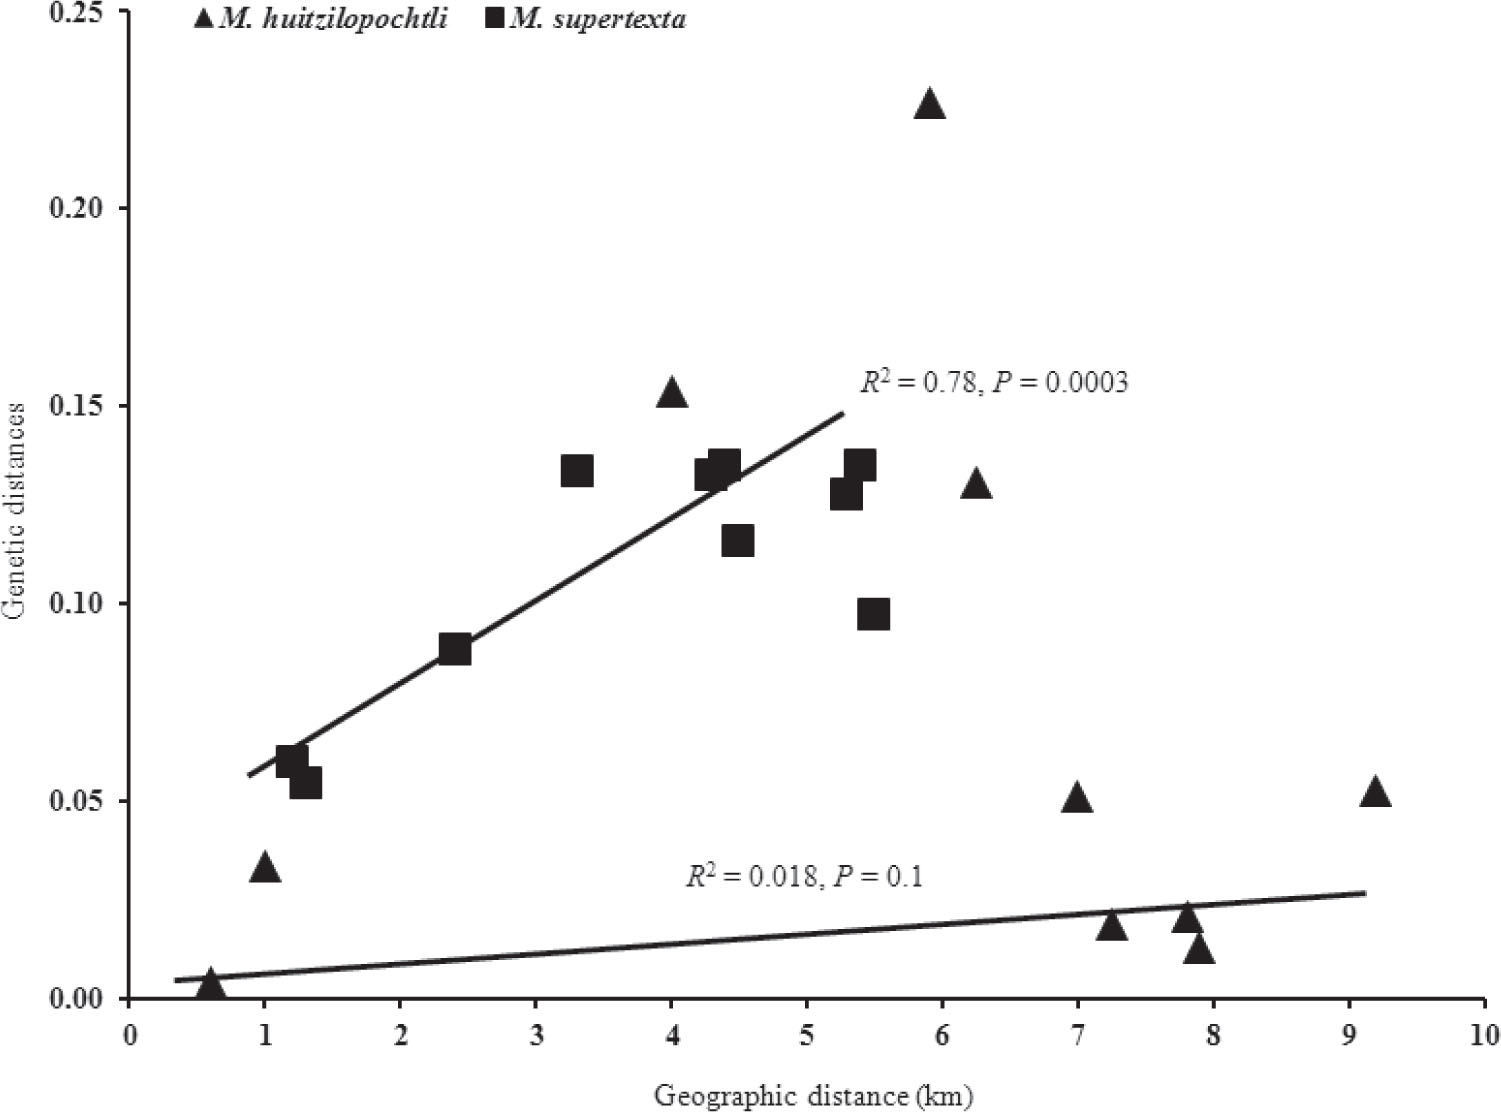
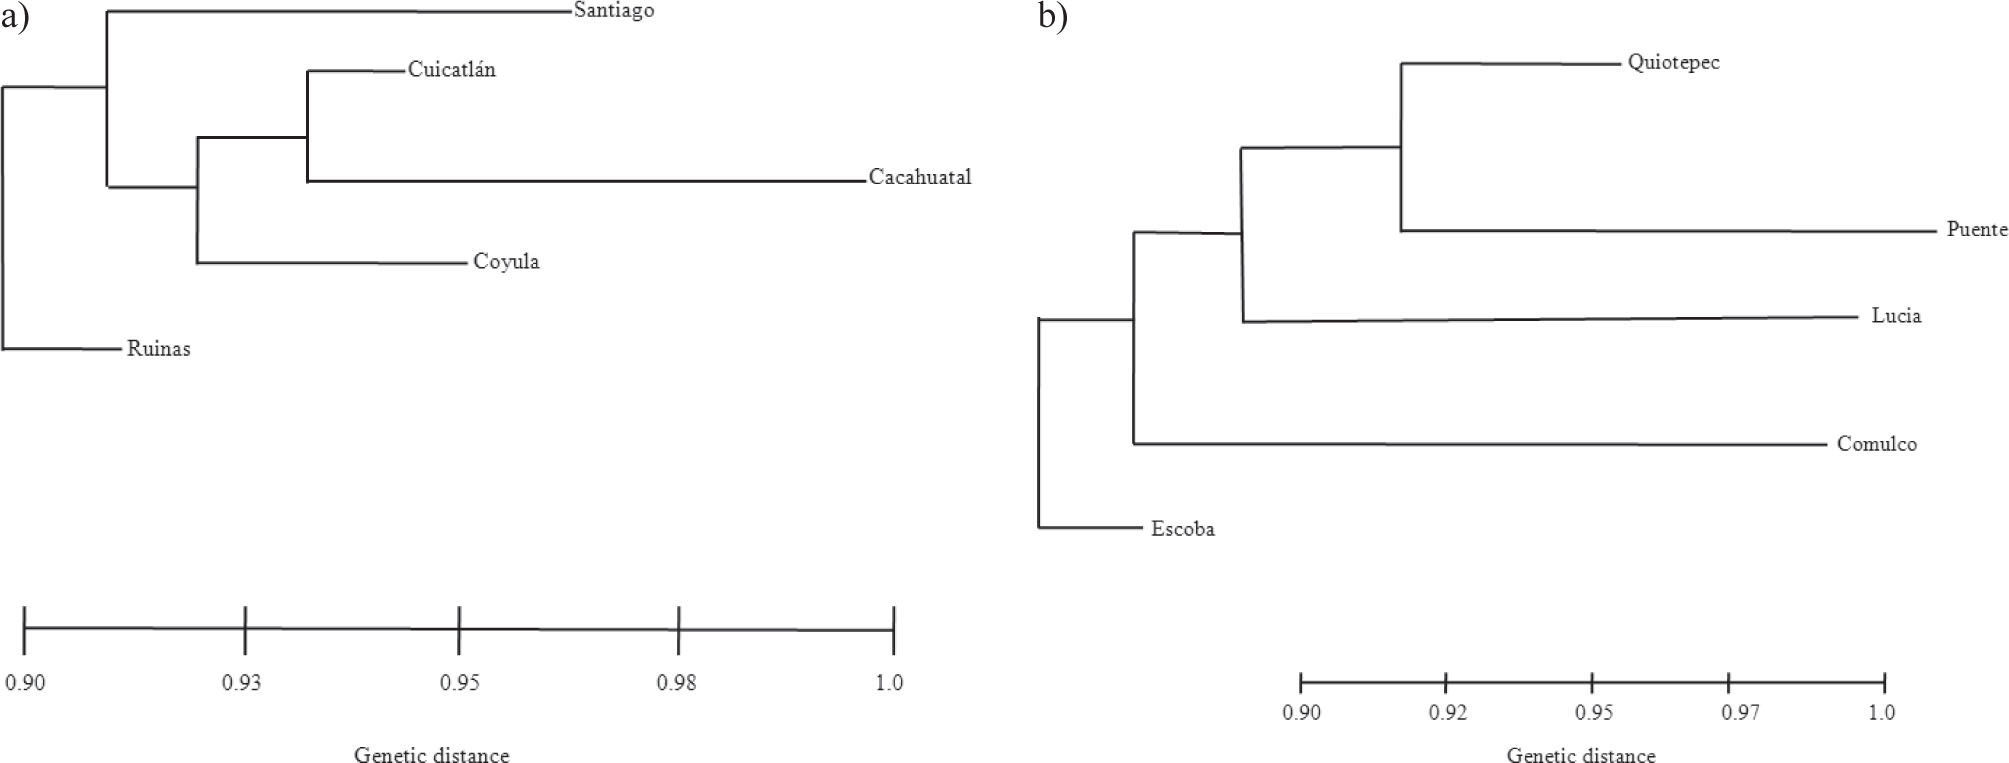
Population genetic differentiationThe global test of differentiation showed that M. huitzilopochtli has a moderate and significant level of genetic structure (RST=0.23 p=0.0002). Most of the paired comparisons between populations based on RST showed a significant genetic differentiation (p<0.05). The values of this estimator varied from low (0.0043) to high (0.29). The highest genetic differentiation values were found between Cuicatlán and Ruinas (0.29), between Cuicatlán and Quiotepec (0.26) and between Cacahuatal and Ruinas (0.18). However, genetic differentiation was not correlated with geographic distances (Fig. 2), or levels of gene flow (R2=−0.36, p=0.15). The genotype assignment test estimated that the highest probability of assignment was to the location where the individuals were collected. On the other hand, the phenetic tree based on the pairwise distances between populations of M. huitzilopochtli did not mirror geographic location (Fig. 3a).

, M. huitzilopochtli and b), M. supertexta.")
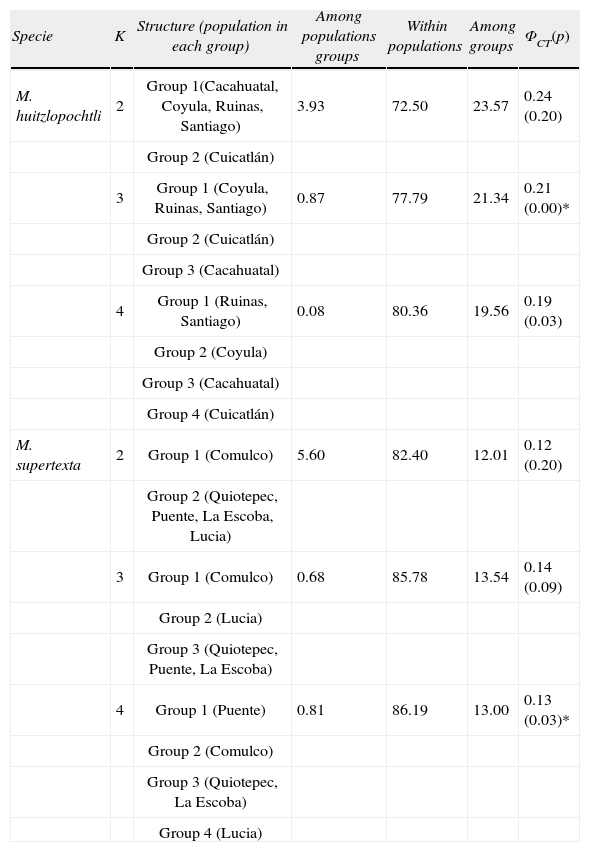
In M. huitzilopochtli, when K=3, a lower and significant value of ΦCT was obtained than for K=2, however, the latter was not significant (p>0.05). In the 3 calculations (K=2, K=3 and K=4) Cuicatlán population separated in a different group (Table 4).
Percentage of variation at hierarchal levels estimated in each K groups tested for the 2 studied species. The last column shows the value of ΦCT, in parenthesis its P value associated. In M. huitzilopochtli the highest value of ΦCT, was estimated when K=2, however it was not statistical significant. A similar situation occurred in M. supertexta, when K=3. The asterisk indicates significant p value
| Specie | K | Structure (population in each group) | Among populations groups | Within populations | Among groups | ΦCT(p) |
| M. huitzlopochtli | 2 | Group 1(Cacahuatal, Coyula, Ruinas, Santiago) | 3.93 | 72.50 | 23.57 | 0.24 (0.20) |
| Group 2 (Cuicatlán) | ||||||
| 3 | Group 1 (Coyula, Ruinas, Santiago) | 0.87 | 77.79 | 21.34 | 0.21 (0.00)* | |
| Group 2 (Cuicatlán) | ||||||
| Group 3 (Cacahuatal) | ||||||
| 4 | Group 1 (Ruinas, Santiago) | 0.08 | 80.36 | 19.56 | 0.19 (0.03) | |
| Group 2 (Coyula) | ||||||
| Group 3 (Cacahuatal) | ||||||
| Group 4 (Cuicatlán) | ||||||
| M. supertexta | 2 | Group 1 (Comulco) | 5.60 | 82.40 | 12.01 | 0.12 (0.20) |
| Group 2 (Quiotepec, Puente, La Escoba, Lucia) | ||||||
| 3 | Group 1 (Comulco) | 0.68 | 85.78 | 13.54 | 0.14 (0.09) | |
| Group 2 (Lucia) | ||||||
| Group 3 (Quiotepec, Puente, La Escoba) | ||||||
| 4 | Group 1 (Puente) | 0.81 | 86.19 | 13.00 | 0.13 (0.03)* | |
| Group 2 (Comulco) | ||||||
| Group 3 (Quiotepec, La Escoba) | ||||||
| Group 4 (Lucia) |
In the case of M. supertexta, the global test of genetic differentiation showed little but significant genetic structure (RST=0.15 p=0.001). The total pairwise RST indicated that there was significant genetic differentiation between populations (p<0.05), except between the Quiotepec and Escoba sites (RST=0.0006, p=0.13). Gene flow levels, adjusted to an isolation by distance model (Fig. 2), were correlated with geographic distances between populations (R2=0.79, p=0.01). The highest probability of assignment was to the location where individuals were collected, except for one individual collected in Quiotepec but with the highest probability of assignment to the Puente site.
The phenetic tree based on the pairwise distances between populations of M. supertexta separated Comulco from the other sites (Fig. 3b). In contrast, the simulation of K=4 shows significant p value, although its ΦCT has a lower value than for K=3, (Table 4). In this species the Comulco populations separated in a different group in the calculations of K=2, K=3 and K=4.
DiscussionA discussion of our results compared with those of other short-globose cacti indicates that M. huitzilopochtli (HO=0.55) has a relatively low heterozygosity value that is similar to the value documented for M. napina (0.58, Tapia-Salcido, 2011). However, the lowest heterozygosity has been documented for M. crucigera (0.37, Ibarra-Suárez, 2009). In contrast, M. supertexta (0.70) is among the species with the highest heterozygosity together with for M. solisioides (0.77; Macias-Arrastio, 2013) and M. zephyranthoides (0.80; López-Ortiz et al., 2013). In other short-globose cactus, Astrophytum asterias (Terry et al., 2012) were documented with similar values of heterozygosity (0.48). We concluded that the use of microsatellites is a relevant factor to estimate genetic variability, since each of these 4 species show higher values of genetic variability than those usually obtained with allozymes for columnar cacti (Hamrick et al., 2002 and studies cited herein, cf. Parra et al., 2008). This high genetic variability may be an effect of the high levels of polymorphism detected by microsatellites. Despite the relative high genetic variability detected in the studied populations, they show a high degree of inbreeding effects as evidenced by the large number of loci in HW disequilibrium. These 2 effects may be associated with negative effects of genetic drift and small population size in the 2 studied species. Although more genetic data are required to detect a possible pattern of genetic variation for the short-globose cacti species, we detected different effects to the geographic distance, gene flow patterns and population size as is discussed below.
We detected a lack of concordance between the levels of heterozygosity and allelic richness between the 2 cacti here studied is notorious. In M. huitzilopochtli, a relatively high allelic richness contrasts with the low heterozygosity level, whereas, high heterozygosity but relatively low allelic richness was found in M. supertexta. The non-concordance between high heterozygosity levels but low allelic richness has been explained by the occurrence of a brief but intense bottleneck, which will cause a rapid loss of allelic richness without notable depletions in heterozygosity levels. This is in contrast to a diffuse bottleneck, occurring over many generations, which may result in similar depletions in heterozygosity, but not a severe loss of allelic diversity (Allendorf and Luikart, 2008). Our results support the hypothesis of a population bottleneck occurred in the 2 species studied. Then, we suggest the intensive illegal harvesting, habitat fragmentation and historical land use transformation recorded in the Tehuacán-Cuicatlán valley as possible causes of such population bottlenecks. In particular, the habitats of the studied species may have been impacted because human management has been recorded in the area from as long as 7 000 year ago (MacNeish and Eubanks, 2000). Moreover, 1 population of M. huitzilopochtli (Ruinas) was collected in the remains of spectacular ruins attributed to the deity Huitzilopochtli of ancient Aztec mythology. Currently, land transformation continues and has already been identified as a relevant threat to the survival of the 2 species studied here (Martorell and Peters, 2008).
The genetic differentiation in both species was significant; however, the factors and processes affecting them are likely different. In the case of M. huitzilopochtli such differentiation was not correlated with gene flow levels or with geographic distance. In this species, we suggest that the strong effects of genetic drift have overwhelmed the effects of gene flow effect. It is recognized that within small populations genetic drift increases homozygosity levels (Lacy, 1987) and accelerates the loss of alleles, which drives alleles to fixation in a few generations, causing a reduction in allelic frequencies (Frankham et al., 2002). In contrast, the cactus M. supertexta did not show high levels of homozygosity. However, for this species gene flow patterns were affected by geographic distance between populations, which indicates that is necessary to try to avoid the genetic isolation. For each species, the SAMOVA test indicated that the individuals of each population represent a source of genetic variability, which may be considered for conservation actions. For this, we recommend that long-term monitoring programs be established for the 2 studied species to avoid the continued decrease in population size across their distribution range. However, it is a fact that not all populations may be protected in the long-term, and then based on the genetic groups and the high allelic richness, particularly the private alleles content, we conclude that Cuicatlán, Cacahuatal represent 2 separated genetic groups, and another composed by Coyula-Ruinas-Santiago for M. huitzilopochtli. For M. supertexta 4 groups defined separately by Comulco, Puente, Lucia and another group composed by Escoba-Quiotepec populations. These groups represent a reference to conservation efforts in the ecosystems where these populations are found, taking into consideration, which in conservation biology is a priority to conserve the genetic diversity of endangered species (Frankham et al., 2002).
However, the conventional approach of conserving “single” species may be replaced by the ecosystem-based approach. This approach proposes that plants species must be conserved since they are key elements in the ecosystem, provide ecosystem services, and maintain complex biotic interactions in the natural communities. Under this approach all types of production have to be integrated, agriculture, livestock grazing, and all sustainable uses of the plants (Hamilton et al., 2012). In addition, the conservation of the plant species requires the prevention of land-degradation (Given, 1994, Hamilton et al., 2012), as well as it is necessary to control all those activities that cause reduction of the plant population size (e.g. illegal harvesting, invasive plant species) and the genetic isolation (e.g. habitat loss and fragmentation) (Hamilton et al., 2012). If we consider that the Tehuacán-Cuicatlán valley outstands by its biological richness (Dávila et al., 2002), besides its high multicultural diversity (MacNeish and Eubanks, 2000) an ecosystem-based approach based on the endangered plant species may bring extensive benefits for the entire community. In particular, in this valley not only the endemic cacti species may be used as a reference to implement conservation strategies, but other plant species according to its evolutionary, economic or taxonomic importance. One other example that can be used as a reference to guide the plant conservation efforts in the Tehuacán- Cuicatlán valley is the well-known endangered rare cycad, Dioon caputoi. For this species population genetic diversity has been evaluated (Cabrera-Toledo et al., 2008; 2010), the pollen and seed dispersion was documented (Cabrera-Toledo et al., 2012), as well as its biogeographic and the evolutionary history (Cabrera-Toledo et al., 2010). These studies demonstrated that illegal harvesting has severe effects on the reproductive adults, which may need between 100 and 300 years to recover their abundance. In contrast, the effects are not so severe on the seeds. Moreover, high levels of heterozygosity are not concordant with the eroded situation of the demographic processes (Cabrera-Toledo et al., 2008). However, a high heterozygosity may indicate that a population bottleneck occurred in the past (Allendorf and Luikart, 2008). Presently, the illegal harvesting of seedling and juveniles is not controlled, and it has been recommended that to maintain the natural populations of this cycad it is necessary the reintroduction of artificially propagated plants (Cabrera-Toledo et al., 2008).
Finally the species, M. huitzilopochtli (Least Concern category) and M. supertexta (Endangered) were recently added to the Red List of IUCN (IUCN, 2013), according to its narrow distribution range and the small population size. In contrast, our genetic results apparently are not concordant to such concern status. This is because the genetic population properties apparently are not immediately affected when a stochastic events cause a population size decrease. In contrast, this event has immediately effects on the demographic processes of recruitment, as well as modifies the effective population size (Lande, 1988, Lande et al., 2003). As a consequence, the relatively high levels of genetic diversity found in M. huizilopochtli and M. supertexta, as was discussed at the beginning of this section, should be taken with caution, given that the geographic isolation and the low population size already recorded may cause a loss of genetic variability.
This study was supported by PAPIIT-DGAPA, UNAM (IN217208). The Macroproyecto Manejo de Ecosistemas y Desarrollo Humano provided us with logistical support (UNAM-SDEI-PTID-02) for our fieldwork. Project Seed Bank (FESI, UNAM-Kew Royal Botanical Garden) provided sampling permissions. We thank to the local authorities of Santiago Quiotepec, Santa María Ixcatlán and San Juan Bautista Cuicatlán. L. Marquez (IB, UNAM) assisted with the electrophoresis of the samples. The comments of two anonymous reviewers improved the quality of this study. P. Gaytán and E. López (IBT, UNAM) synthesized the non-fluorescent primers. U. Guzmán, F. Rivera, and C. Vega supported the fieldwork sampling.