The purposes of this study are the characterization the lipid profile and the suitability of the statins treatment according to the cardiovascular profile. Also, in statin-treated patients, we aim to determine the prevalence of persistent lipid abnormalities.
Material and methodsObservational and retrospective study of outpatient diabetic patients of a hospital consultation, between Jun/2014 and Jun/2015.
ResultsOf the 199 diabetic patients included, 58.6% were treated with statins and only 13.9% were treated with statin dose adequate for its cardiovascular profile. The patients without overt cardiovascular disease had higher total cholesterol (178.0 vs 157.5mg/dl; p=0.003), HDL-C (51.0 vs 43.0mg/dl; p=0.005), LDL-C (97.0 vs 79.0mg/dl; p=0.004) and non-HDL-C (127.0 vs 112.5mg/dl; p=0.04) and higher prevalence of patients who achieved HDL-C goals (64.3 vs 33.3%; p<0.0001). Almost half of statin-treated patients (46.8%) failed to achieve the LDL-C goals, 35.8% and 51.6% failed the triglycerides and HDL-C goals, respectively. Only 11.7% achieved all three goals. In statin-treated patients, we found a statistically significant difference between patients with and without cardiovascular disease on the prevalence of patients reaching the target HDL-C (68.1 vs 35.4%; p=0.001). There were no differences in the prevalence of patients who achieved LDL-C and triglyceride goals.
Discussion/conclusionThere is a suboptimal utilization of statins and a substantial percentage of diabetic patients that do not achieve the therapeutic goals. We emphasize the need for an effort to optimize the lipid profile of diabetics in order to contribute to reducing the prevalence of cardiovascular diseases in this population.
Os objetivos são a caracterização do perfil lipídico e a avaliação do tratamento com estatinas de acordo com o perfil cardiovascular. Adicionalmente, pretendemos determinar prevalências de anomalias lipídicas persistentes nos doentes tratados com estatinas.
Materiais e métodosEstudo observacional e retrospetivo de diabéticos acompanhados numa consulta hospitalar entre 06/2014 e 06/2015.
ResultadosDos 199 doentes, 58,6% estavam tratados com estatinas e 13,9% estavam tratados com doses de estatinas adequadas para o perfil cardiovascular. Os doentes sem doença cardiovascular (DCV) tinham níveis mais elevados de colesterol total (178,0 vs. 157,5mg/dl; p=0,003), HDL-C (51,0 vs. 43,0mg/dl; p=0,005), LDL-C (97,0 vs. 79,0mg/dl; p=0,004), e não-HDL-C (127,0 vs. 112,5mg/dl; p=0,04) e uma maior prevalência de doentes que alcançaram metas de HDL-C (64,3 vs. 33,3%; p<0,0001). Quase metade dos doentes tratados com estatinas (46,8%) não atingiram o valor alvo de LDL-C, 35,8 e 51,6% falharam as metas de HDL-C e de triglicerídeos, respetivamente. Apenas 11,7% atingiram todos os 3 objetivos. Nos doentes tratados com estatinas, encontramos diferença estatisticamente significativa entre os doentes com e sem DCV, sobre a prevalência de atingimento do alvo HDL-C (68,1 vs. 35,4%, p=0,001). Não houve diferenças na prevalência de doentes que atingiram os objetivos de LDL-C e triglicerídeos.
Discussão e conclusãoVerifica-se uma utilização subótima das estatinas e uma percentagem substancial de diabéticos que não alcançam os objetivos terapêuticos. Salienta-se a necessidade de um esforço para otimizar o perfil lipídico dos diabéticos de forma a contribuir para a diminuição da prevalência de DCV nesta população.
Cardiovascular disease (CVD) is the leading cause of death among adult diabetic patients.1 Although the multifactorial etiology of atherosclerotic vascular disease, dyslipidemia is a common and an important predictor of cardiovascular risk.2 Dyslipidemia is usually present at diagnosis of type 2 diabetes and persists regardless of the treatment of hyperglycemia. The main therapy goal in the management of dyslipidemia is to decrease the levels of LDL-cholesterol (LDL-C) and other apolipoprotein-B-containing lipoproteins, which is primarily achieved with dietary modifications and statins.3,4
Data from randomized controlled trials of statin therapy show highly significant reductions in the incidence of major CVD events in diabetic patients, with or without established CVD. Moreover, the reductions in major CVD events are proportional to the reduction in LDL cholesterol. Despite the widespread evidence of the benefits of lipid-lowering treatment, particularly with statins, for reducing cardiovascular disease and mortality in diabetic patients, a considerable proportion of diabetic patients do not achieve the therapeutic goals in LDL cholesterol.5,6
The aim of this study is to characterize lipid profile of diabetic patients, according the presence or absence of previous cardiovascular event and the evaluation of the suitability of the treatment with statins according to the cardiovascular profile. Additionally, our purpose is to determine in the statin-treated patients, the prevalence of persistent lipid abnormalities.
Material and methodsData sources and subjectsThis article describes an observational, analytical and retrospective study of outpatient diabetic patients followed at Educational Therapy of Diabetes Consultation (CTED) in Centro Hospitalar do Porto (CHP), between June 2014 and June 2015. CTED is a multidisplinary consultation composed of endocrinologists, nurses, nutritionists, psychologists and podiatrists. The main purpose of this consult is diabetes self-management education and support. The patients are referenced to this consult by family physician or by another specialty consultation in HSA.
Outpatients eligible for inclusion were age ≥18 years old. Patients were excluded if they were type 1 diabetic and if was impossible to obtain the file of the patient. The source of information was electronic or paper file.
Data collectionData were collected from medical records and clinical examination at the time of the consults. Demographics (age and gender) and anthropometric variables [weight, height and body mass index (BMI)] were recorded at first visit, as well as glycosylated hemoglobin (DCA2000 method). Lipid profile [total cholesterol (TC), triglycerides (TG), LDL-C, HDL-cholesterol (HDL-C) and apolipoprotein B (apoB)] were obtained on the second visit. The measurements were made in the same laboratory, by standard hospital assays – CT, HDL-C and TG through enzymatic methods (Roche®) in freshly drawn lithium-heparin plasma samples. The value of LDL-C was calculated using the Friedewald equation (LDL-C=TC-HDL-C-[TG/5]), if TG levels <400mg/dl and measured directly at higher levels. Non-HDL cholesterol (non HDL-C) was also calculated (TC-HDL-C). Apolipoproteins were measured through immunoturbidimetric assays. Because of its influence on lipid profile, we excluded thyroid dysfunction in all patients through TSH measurement by electrochemiluminescence.
The presence of cardiovascular risk factors (smoking, hypertension, dyslipidemia and physical inactivity), of diabetic kidney disease and history of cardiovascular disease (ischemic heart disease, cerebrovascular disease and peripheral artery disease) were registered.
Definition of dyslipidemiaTo determine the persistence of lipid abnormalities, in terms of dyslipidemia treatment and goals of lipid levels, it was applied the American Diabetes Association (ADA) recommendations of 2014. Accordingly, patients without overt CVD the goal of LDL-C is less than 100mg/dl, and in individuals with overt CVD the goal of LDL-C is less than 70mg/dl. Although the LDL-target statin therapy is the preferred strategy, additional targets are triglyceride levels less than 150mg/dl and HDL-C superior to 40 or 50mg/dl, in men and women, respectively.7
The lipid levels goals correspond to a range of values defined by an upper limit without a lower limit. Although the term target is commonly used interchangeably, achieving targets could result in the undertreatment of many patients who could benefit from having LDL-C, triglyceride values below the target values or HDL-C above the target value.
To analyze the suitability of the dose of statins were used the recommendations of the ADA in 2015. Therefore, diabetic patients were divided in groups considering the age and the presence or absence of overt CVD [previous cardiovascular events or acute coronary syndromes] and cardiovascular (CV) risk factors [LDL≥100mg/dl, high blood pressure, smoking, overweight or obesity]. Patients of all ages with diabetes and overt CVD should be medicated with an high-dose statin. Patients with diabetes under 40 years of age and with additional CVD risk factors, it should be considered using moderate or high-dose statin. For patients with diabetes aged 40–75 years without additional CVD risk factors, it should be considered using moderate-dose statin. For patients with diabetes aged 40–75 years with additional CVD risk factors, it should be considered using high-dose statin. For diabetics over 75 years old without additional CVD risk factors, it should be considered using moderate-dose statin therapy. And for patients over 75 years with additional CVD risk factors, it should be considered using moderate or high-dose statin therapy.8
The statins were classified in high-intensity and moderate-intensity according to the potency for lowering LDL-C. High-intensity statins lowers LDL-C by 50% (atorvastatin 40mg, atorvastatin 80mg, rosuvastatin 20mg and rosuvastatin 40mg). Moderate-intensity statins lowers LDL-C 30–50% (atorvastatin 10mg, atorvastatin 20mg, rosuvastatin 5mg, rosuvastatin 10mg, simvastatin 20mg, simvastatin 40mg, pravastatin 40mg, pravastatin 80mg, lovastatin 40mg, fluvastatin XL 80mg, fluvastatin 40mg bid, pitavastatin 2mg, pitavastatin 4mg).8
Statistical analysisContinuous variables are expressed as the mean and standard deviation (SD) or median and interquartile range (IQR) (25th–75th percentile), according to the distribution of variables. Age was the only continuous variable with a normal distribution and was expressed as mean and SD. The others continuous variables had a non-normal distribution and were expressed as median and IQR. Categorical variables are expressed as frequencies, percentages and confidence interval of 95% (95% CI). Group comparisons were made using the Mann–Whitney U test or the Wilcoxon rank-sum test for continuous variables and the chi-square (χ2) test for categorical variables. Statistical significance was defined at p<0.05. Statistical analysis was performed using SPSS™ software version 20.
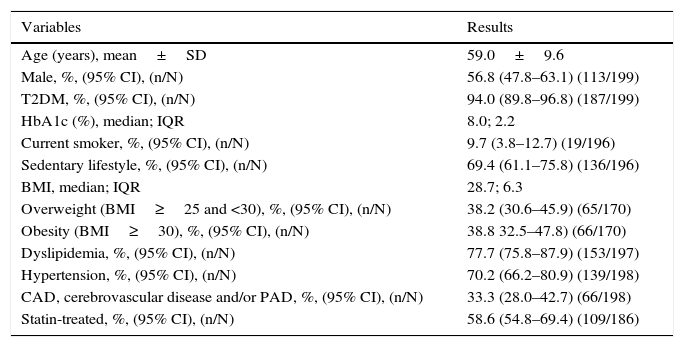
ResultsThe study included 199 diabetic patients with a mean age of 59.0±9.6 years and with a preponderance (56.8%; n=113) of males. In this population, type 2 diabetes was the predominant type of diabetes (94.0%; n=187) and the median HbA1c were 8.0% IQR 2.2. The majority of these patients was overweight (BMI≥25) (77.0%; n=131) and had a sedentary lifestyle (69.4%; n=136). Also, we found a high prevalence of dyslipidemia (77.7%; n=153) and hypertension (70.2%; n=139). More than a third (33.3%; n=66) had a previous cardiovascular event and 58.6% (n=109) were treated with statins (Table 1).
The characteristics of study population (n=199).
| Variables | Results |
|---|---|
| Age (years), mean±SD | 59.0±9.6 |
| Male, %, (95% CI), (n/N) | 56.8 (47.8–63.1) (113/199) |
| T2DM, %, (95% CI), (n/N) | 94.0 (89.8–96.8) (187/199) |
| HbA1c (%), median; IQR | 8.0; 2.2 |
| Current smoker, %, (95% CI), (n/N) | 9.7 (3.8–12.7) (19/196) |
| Sedentary lifestyle, %, (95% CI), (n/N) | 69.4 (61.1–75.8) (136/196) |
| BMI, median; IQR | 28.7; 6.3 |
| Overweight (BMI≥25 and <30), %, (95% CI), (n/N) | 38.2 (30.6–45.9) (65/170) |
| Obesity (BMI≥30), %, (95% CI), (n/N) | 38.8 32.5–47.8) (66/170) |
| Dyslipidemia, %, (95% CI), (n/N) | 77.7 (75.8–87.9) (153/197) |
| Hypertension, %, (95% CI), (n/N) | 70.2 (66.2–80.9) (139/198) |
| CAD, cerebrovascular disease and/or PAD, %, (95% CI), (n/N) | 33.3 (28.0–42.7) (66/198) |
| Statin-treated, %, (95% CI), (n/N) | 58.6 (54.8–69.4) (109/186) |
BMI: body mass index; CAD: coronary artery disease; PAD: peripheral artery disease; T2DM: type 2 diabetes mellitus.
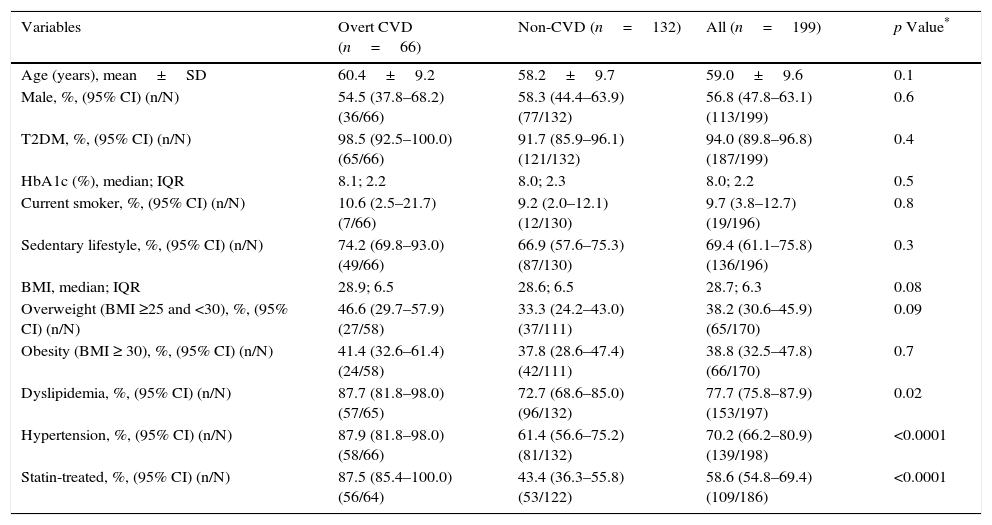
The study population was divided in two groups according to the presence or absence of previous cardiovascular event, as shown in Table 2. There were no differences between the groups in terms of age, sex, metabolic control (HbA1c) and prevalence of obesity. The group of patients with previous cardiovascular events had higher prevalence of dyslipidemia (87.7 vs 72.7%; p=0.02), hypertension (87.9 vs 61.4%; p<0.0001) and was more frequently statin-treated (87.5 vs 43.4%; p<0.0001).
Characteristics of the groups: with and without overt CVD.
| Variables | Overt CVD (n=66) | Non-CVD (n=132) | All (n=199) | p Value* |
|---|---|---|---|---|
| Age (years), mean±SD | 60.4±9.2 | 58.2±9.7 | 59.0±9.6 | 0.1 |
| Male, %, (95% CI) (n/N) | 54.5 (37.8–68.2) (36/66) | 58.3 (44.4–63.9) (77/132) | 56.8 (47.8–63.1) (113/199) | 0.6 |
| T2DM, %, (95% CI) (n/N) | 98.5 (92.5–100.0) (65/66) | 91.7 (85.9–96.1) (121/132) | 94.0 (89.8–96.8) (187/199) | 0.4 |
| HbA1c (%), median; IQR | 8.1; 2.2 | 8.0; 2.3 | 8.0; 2.2 | 0.5 |
| Current smoker, %, (95% CI) (n/N) | 10.6 (2.5–21.7) (7/66) | 9.2 (2.0–12.1) (12/130) | 9.7 (3.8–12.7) (19/196) | 0.8 |
| Sedentary lifestyle, %, (95% CI) (n/N) | 74.2 (69.8–93.0) (49/66) | 66.9 (57.6–75.3) (87/130) | 69.4 (61.1–75.8) (136/196) | 0.3 |
| BMI, median; IQR | 28.9; 6.5 | 28.6; 6.5 | 28.7; 6.3 | 0.08 |
| Overweight (BMI ≥25 and <30), %, (95% CI) (n/N) | 46.6 (29.7–57.9) (27/58) | 33.3 (24.2–43.0) (37/111) | 38.2 (30.6–45.9) (65/170) | 0.09 |
| Obesity (BMI ≥ 30), %, (95% CI) (n/N) | 41.4 (32.6–61.4) (24/58) | 37.8 (28.6–47.4) (42/111) | 38.8 (32.5–47.8) (66/170) | 0.7 |
| Dyslipidemia, %, (95% CI) (n/N) | 87.7 (81.8–98.0) (57/65) | 72.7 (68.6–85.0) (96/132) | 77.7 (75.8–87.9) (153/197) | 0.02 |
| Hypertension, %, (95% CI) (n/N) | 87.9 (81.8–98.0) (58/66) | 61.4 (56.6–75.2) (81/132) | 70.2 (66.2–80.9) (139/198) | <0.0001 |
| Statin-treated, %, (95% CI) (n/N) | 87.5 (85.4–100.0) (56/64) | 43.4 (36.3–55.8) (53/122) | 58.6 (54.8–69.4) (109/186) | <0.0001 |
BMI: body mass index; CAD: coronary artery disease; CVD: cardiovascular disease; PAD: peripheral artery disease; T2DM: type 2 diabetes mellitus.
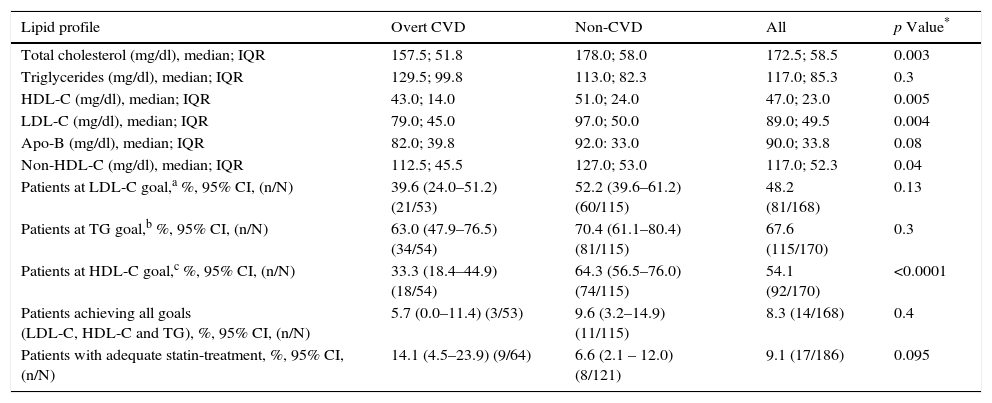
The group of patients without overt CVD had higher TC (178.0 vs 157.5mg/dl; p=0.003), HDL-C (51.0 vs 43.0mg/dl; p=0.005), LDL-C (97.0 vs 79.0mg/dl; p=0.004) and non-HDL (127.0 vs 112.5mg/dl; p=0.04) and higher prevalence of patients who achieved HDL-C goals (64.3 vs 33.3%; p<0.0001), as demonstrated in Table 3. There were no statistical differences on the median of the triglycerides and of the apo-B.
Lipid profile in diabetics with and without overt CVD.
| Lipid profile | Overt CVD | Non-CVD | All | p Value* |
|---|---|---|---|---|
| Total cholesterol (mg/dl), median; IQR | 157.5; 51.8 | 178.0; 58.0 | 172.5; 58.5 | 0.003 |
| Triglycerides (mg/dl), median; IQR | 129.5; 99.8 | 113.0; 82.3 | 117.0; 85.3 | 0.3 |
| HDL-C (mg/dl), median; IQR | 43.0; 14.0 | 51.0; 24.0 | 47.0; 23.0 | 0.005 |
| LDL-C (mg/dl), median; IQR | 79.0; 45.0 | 97.0; 50.0 | 89.0; 49.5 | 0.004 |
| Apo-B (mg/dl), median; IQR | 82.0; 39.8 | 92.0: 33.0 | 90.0; 33.8 | 0.08 |
| Non-HDL-C (mg/dl), median; IQR | 112.5; 45.5 | 127.0; 53.0 | 117.0; 52.3 | 0.04 |
| Patients at LDL-C goal,a %, 95% CI, (n/N) | 39.6 (24.0–51.2) (21/53) | 52.2 (39.6–61.2) (60/115) | 48.2 (81/168) | 0.13 |
| Patients at TG goal,b %, 95% CI, (n/N) | 63.0 (47.9–76.5) (34/54) | 70.4 (61.1–80.4) (81/115) | 67.6 (115/170) | 0.3 |
| Patients at HDL-C goal,c %, 95% CI, (n/N) | 33.3 (18.4–44.9) (18/54) | 64.3 (56.5–76.0) (74/115) | 54.1 (92/170) | <0.0001 |
| Patients achieving all goals (LDL-C, HDL-C and TG), %, 95% CI, (n/N) | 5.7 (0.0–11.4) (3/53) | 9.6 (3.2–14.9) (11/115) | 8.3 (14/168) | 0.4 |
| Patients with adequate statin-treatment, %, 95% CI, (n/N) | 14.1 (4.5–23.9) (9/64) | 6.6 (2.1 – 12.0) (8/121) | 9.1 (17/186) | 0.095 |
CVD: cardiovascular disease.
A strong and positive correlation between apo-B and non-HDL-C was verified (r=0.87; p<0.001).
The group of patients without overt CVD had significantly higher prevalence of patients that met the HDL-C goals (64.3 vs 33.3%; p<0.0001). Although, we found no statistical difference on prevalence of patients that met the LDL-C and TG goals.
The study of suitability of the dose of the statin has shown that there were no differences between the groups (14.1 vs 6.6%; p=0.095).
To evaluate the persistence of lipid abnormalities, the patients were divided in statin-treated and non-statin treated.
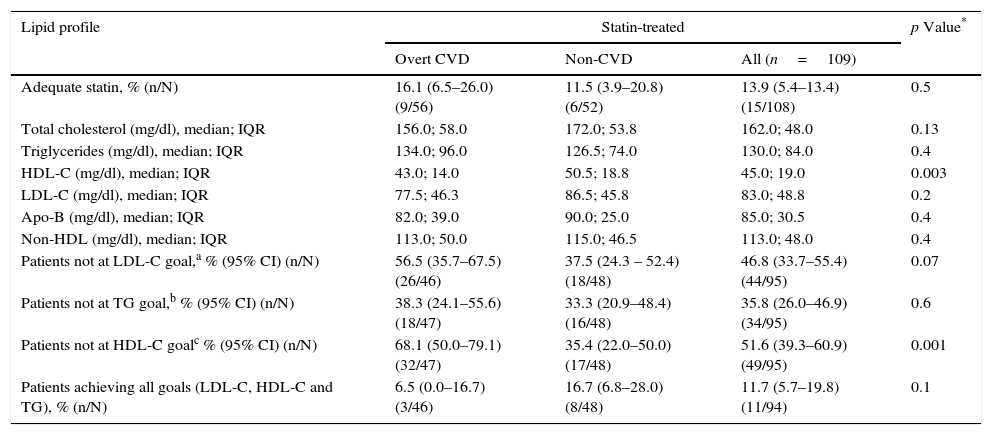
In statin-treated patients, 13.9% were treated with statins with adequate potency to their cardiovascular profile. There were no differences between the patients with and without overt CVD in the adequacy of statin treatment (Table 4). Less than half (46.8%, n=44) failed to achieve the LDL-C goal. Half (51.1%; n=48) and 35.1% (n=33) of these patients failed to achieve HDL-C and TG goals, respectively. Only 11.7% (n=11) of these patients achieved all three goals. In this group of patients, we found a statistically significant difference between those with and without cardiovascular disease in HDL-C median level (43.0 vs 50.5; p=0.003) and in the prevalence of patients reaching the target of HDL-C (68.1 vs 35.4%; p=0.001). There were no differences in the prevalence of patients who achieved LDL-C and triglyceride goals (Table 4).
Persistence of lipid abnormalities.
| Lipid profile | Statin-treated | p Value* | ||
|---|---|---|---|---|
| Overt CVD | Non-CVD | All (n=109) | ||
| Adequate statin, % (n/N) | 16.1 (6.5–26.0) (9/56) | 11.5 (3.9–20.8) (6/52) | 13.9 (5.4–13.4) (15/108) | 0.5 |
| Total cholesterol (mg/dl), median; IQR | 156.0; 58.0 | 172.0; 53.8 | 162.0; 48.0 | 0.13 |
| Triglycerides (mg/dl), median; IQR | 134.0; 96.0 | 126.5; 74.0 | 130.0; 84.0 | 0.4 |
| HDL-C (mg/dl), median; IQR | 43.0; 14.0 | 50.5; 18.8 | 45.0; 19.0 | 0.003 |
| LDL-C (mg/dl), median; IQR | 77.5; 46.3 | 86.5; 45.8 | 83.0; 48.8 | 0.2 |
| Apo-B (mg/dl), median; IQR | 82.0; 39.0 | 90.0; 25.0 | 85.0; 30.5 | 0.4 |
| Non-HDL (mg/dl), median; IQR | 113.0; 50.0 | 115.0; 46.5 | 113.0; 48.0 | 0.4 |
| Patients not at LDL-C goal,a % (95% CI) (n/N) | 56.5 (35.7–67.5) (26/46) | 37.5 (24.3 – 52.4) (18/48) | 46.8 (33.7–55.4) (44/95) | 0.07 |
| Patients not at TG goal,b % (95% CI) (n/N) | 38.3 (24.1–55.6) (18/47) | 33.3 (20.9–48.4) (16/48) | 35.8 (26.0–46.9) (34/95) | 0.6 |
| Patients not at HDL-C goalc % (95% CI) (n/N) | 68.1 (50.0–79.1) (32/47) | 35.4 (22.0–50.0) (17/48) | 51.6 (39.3–60.9) (49/95) | 0.001 |
| Patients achieving all goals (LDL-C, HDL-C and TG), % (n/N) | 6.5 (0.0–16.7) (3/46) | 16.7 (6.8–28.0) (8/48) | 11.7 (5.7–19.8) (11/94) | 0.1 |
CVD: cardiovascular disease.
As other similar published studies our study population included diabetic patients with a mean age in the sixties and with a high prevalence of overweight, sedentary lifestyle, dyslipidemia and hypertension.9,10 Also, we found an elevated prevalence of non-statin treated patients (56.8%).
The group of patients without overt CVD was more frequently non-statin treated and had higher TC, LDL-C, HDL-C and non-HDL. Also, there was a trend for statistical significance to higher apo-B levels.
In the Dyslipidemia International Study (DYSIS) the diabetics without a previous CVD also had higher LDL-C and HDL-C.10 Those facts may reflect better lipid-focused treatment in patients with a previous event of CVD. The group of patients without previous CVD had significantly higher prevalence of patients that achieved the HDL-C goals, and this is concordant with the findings of DYSIS.10 A higher level HDL-C in patients without overt CVD can be the reflection of their cardioprotective effect.
In our study, half of the statin-treated diabetic patients (53.2%) achieved LDL-C goals. This finding is similar to the analysis of Leiter et al. and Feher et al., however are in contrast with the analysis of Silva et al. of Portuguese subpopulation of the DYSIS (77.1%).9–11 We verified that over one third (35.8%) did not achieved TG goals, half (51.6%) did not achieved HDL-C goals and only a minority (11.7%) of patients achieved all three goals. In the Portuguese subpopulation analysis of DYSIS the percentage of patients that not met the TG goals are similar (41.4%) but diverge on the percentage of patients that failed the HDL-C goal (27.7%).9 In DYSIS, a quarter (25.9%) of the diabetic patients and almost 20% (19.9%) did not achieve TG and HDL-C goals, respectively, and 39% of the patients achieve all goals. 10 Feher et al. demonstrated that approximately half of the patients who received statin monotherapy attained the treatment goals for HDL-C and TG.11
When analyzing the suitability of the dose of the statin we verified that there were no differences between the groups, although with a tendency to significance for the group with overt CVD. This can be the expression, again, of a higher attention to lipid treatment in patients with a previous event of CVD.
The vast majority of patients were treated with a dose of statin non-adequate to their cardiovascular profile. This observation must be analyzed very carefully because the study included patients observed from June 2014 to June 2015. As this recommendations were published in November 2013 by the ACC/AHH and adopted by ADA in January 2015, we cannot make firm conclusions about the suitability of statins dose, and this is a considerable limitation of the study.
LimitationsThis study reflects a small sample of patients evaluated in the CTED, analyzed retrospectively and we did not evaluate long-term outcomes. In addition, we lack data of adherence to treatment regime or contraindications to statin therapy.
ConclusionSeveral clinical studies have demonstrated evidence supporting the beneficial effects of statins therapy in patients for both primary and secondary prevention of CVD events and death. Also, recommendations of treatment and management of dyslipidemia are wide spread to guide medical decision. Despite those facts, evidence has shown, in concordance to our results, a suboptimal use of lipid-modifying therapies and a substantial percentage of diabetic patients that do not achieve the therapeutic goals. We emphasize that is necessary an effort to optimize the lipid profile of diabetic patients and, consequently, decrease the prevalence of CVD events in this population.
Ethical disclosuresProtection of human and animal subjectsThe authors declare that no experiments were performed on humans or animals for this study.
Confidentiality of dataThe authors declare that no patient data appear in this article.
Right to privacy and informed consentThe authors declare that no patient data appear in this article.
Conflicts of interestThe authors have no conflicts of interest to declare.


