Two statistical sources provide data on hospital stays and discharges for all Spanish hospitals: Hospital Morbidity Survey (acronym in Spanish: EMH) and Statistics of Health Establishments providing Inpatient Care (acronym in Spanish: EESCRI). Our aim is to contrast these two statistical sources to define their accuracy and relevance in psychiatric epidemiology studies.
Material and methodologyThe analysis is based on two aspects: (1) Compare the number of psychiatric stays and hospital discharges from 1990 to 2009. (2) Analyse and compare how the average stay is provided.
ResultsThe differences between the two statistical sources are significant and increase over time. In 2005–2009 the EMH records 121% of hospitalisations (577,078 vs 475,414) and 46% (14,239,527 vs 30,821,412) of psychiatric stays, compared with EESCRI. Moreover, the average stay estimated by EESCRI shows serious methodological problems, particularly in settings of prolonged hospitalisation (psychiatric hospitals); the estimations are potentially below the real value.
ConclusionsSurprisingly, the questionnaires completed by hospitals to develop the EESCRI provide data on assisted morbidity quite different from that provided by the EMH, despite both statistical sources having the same inpatient records for data processing. It is difficult to attribute these differences to sampling error, as the EMH has a very high sampling fraction, which minimises the sampling error. Given the mismatch between sources, we recommend using the EMH, as it offers more reliable data and allows an accurate determination of the length of stays.
Dos fuentes estadísticas sanitarias proporcionan datos sobre altas y estancias en todos los hospitales españoles: la Encuesta de Morbilidad Hospitalaria (EMH) y la Estadística de Establecimientos Sanitarios con Régimen de Internado (EESCRI). Nuestro objetivo es contrastar ambas fuentes para definir su precisión y pertinencia en estudios de epidemiología psiquiátrica.
Material y métodosSe focaliza el análisis en 2 aspectos: 1.- comparar el número de altas y estancias psiquiátricas recogidas entre 1990–2009; 2.- analizar y comparar el modo en que se proporciona la estancia media.
ResultadosLas diferencias entre ambas fuentes son profundas y aumentan con el tiempo. En 2005–2009 la EMH registró un 121% más de altas (577.078 vs. 475.414) y un 46% (14.239.527 vs. 30.821.412) menos de estancias psiquiátricas que la EESCRI. Por otra parte, la estancia media estimada a través de la EESCRI presenta serios problemas metodológicos, particularmente en entornos con hospitalizaciones prolongadas (hospitales psiquiátricos), siendo la estimación de la EESCRI potencialmente inferior al valour real.
ConclusionesSorprende que los cuestionarios cumplimentados por los hospitales para elaborar la EESCRI proporcionen una morbilidad asistida tan alejada de la que recoge la EMH, cuando ambas fuentes disponen de los mismos registros de pacientes hospitalizados para su elaboración. Resulta difícil atribuir esas diferencias a errores de muestreo, ya que la EMH posee una fracción de muestreo muy elevada, lo que minimiza el error muestral. Ante la discordancia entre fuentes se aconseja utilizar la EMH que ofrece datos más fiables y permite determinar con precisión la duración de las hospitalizaciones.
As the National Strategy for Mental Health itself reflects, the availability of data on psychiatric hospital activity is essential to evaluate psychiatric services or processes like psychiatric reform (dehospitalisation)1–3 as a source of data in psychiatric epidemiology and determine and manage healthcare policies.4 Two sources collect the healthcare activity of all the Spanish hospitals: the Hospital Morbidity Survey (Spanish acronym: EMH)5 and the Statistics of Establishments Providing Inpatient Care (Spanish acronym: EESCRI).6 The EESCRI has been used in many psychiatric studies,7–11 with its use being recommended in the National Strategy for Mental Health.4 In contrast, the EMH has seldom been used in Spain.12 The EMH5 is a survey (sample-based research), while the EESCRI6 is a census-based register (collects each of the cases). These sources of information are dependent on the National Statistics Institute (Spanish acronym: INE) and the Ministry of Health, respectively.
Both statistical sources have the same hospital discharge registers (HDR) available for their preparation, as stipulated by law.5,12 The EMH is handled through INE agents that visit the hospitals and use the HDR directly to extract information. In contrast, to prepare the EESCRI, each hospital receives a questionnaire on resources and healthcare activity, which the hospital fills in annually.
Any possible HDR errors affect the reliability of both statistics equally.12 In addition, EMH reliability depends on sampling error but, in the case of the EESCRI, its reliability depends on the truthfulness and accuracy of the responses that the previously mentioned questionnaires contain.
The EESCRI breaks down morbidity based on the healthcare service in which the patient is treated (for example, psychiatry) and omits diagnoses. The EMH provides diagnoses instead of healthcare services.
MethodComputing stays and dischargesOur objective was to compare psychiatric stays and discharges registered by two statistical sources, the EMH (using European Parliament ICD-9 codes 290-319) and EESCRI (using the psychiatric care service) during the 5-year period of 2005–2009, with a break-down by autonomous community. To ascertain the evolution in agreement between the two sources, we referenced the previous 5-year periods (1990–1994, 1995–1999 and 2000–2004) with respect to the values observed at the national level. Likewise, we analysed the possible correlation between the main characteristics of psychiatric hospitalisation in each community (weight of the psychiatric hospital vs general hospital, public vs private, and state-subsidised vs not state-subsidised) and the degree of mismatch. Lastly, we compared the way in which the two sources estimated the length of stay.
Mean stayThe EMH makes information available on: (1) stays caused by the discharges recorded in a specific year (computation used to calculate mean stay) and (2) stays occurring between 1 January and 31 December of a specific year (computation used to calculate stay rate).13 The EESCRI provides only the stays between 1 January and 31 December of each year. Consequently, the data available to the EESCRI only permits estimating the mean stay as a ratio of stays (numerator) and discharges (denominator) when both are produced in the same natural year,6,14,15 an estimation that does not strictly fit the concept of mean stay.13 The EMH uses the same denominator to estimate the mean stay (discharges), but the numerator reflects the stays caused by these discharges instead of stays within the period between 1 January and 31 December (specific stays happen before the natural year in which the discharges are recorded). To determine the point to which this difference could be relevant, the mean stay estimated according to both tallies will be calculated using the EMH (the only source that provides both tallies).
ResultsComputation of stays and dischargesImportant national differences are seen with respect to the discharges recorded by the two sources (EESCRI vs EMH), 397,304 vs 445,171 in 1990–1994, and 475,414 vs 577,078 in 2005–2009. Even though the EMH contains more psychiatric discharges, it provides fewer stays. Specifically, it provides 66% of the stays collected in the EESCRI in 1990–1994 (26,399,663 vs 40,214,260) and 46% in 2005–2009 (14,239,527 vs 30,821,412). As can be seen, the lack of agreement becomes worse over time (Table 1).
Hospital stays and discharges in Spain between 1 January and 31 December. Data broken down in 5-year periods (1990–1994; 1995–1999; 2000–2004; 2005–2009).
| EESCRIa (psychiatric care services) | EMHb (CIE-9 codes 290-319) | |||||
|---|---|---|---|---|---|---|
| Discharges | Stays | Mean stays | Discharges | Stays | Mean stay | |
| 1 January 1990–31 December 1994 | 397,304 | 40,214,260 | 101 | 445.171±297c | 26.399.663±17.590 | 118 |
| 1 January 1995–31 December 1999 | 445,312 | 36,253,099 | 81 | 519.421±122 | 19.036.993±4.486 | 63 |
| 1 January 2000–31 December 2004 | 478,432 | 33,818,111 | 71 | 558.018±57 | 14.913.663±1.517 | 35 |
| 1 January 2005–31 December 2009 | 475,414 | 30,821,412 | 65 | 577.078±30 | 14.239.527±742 | 27 |
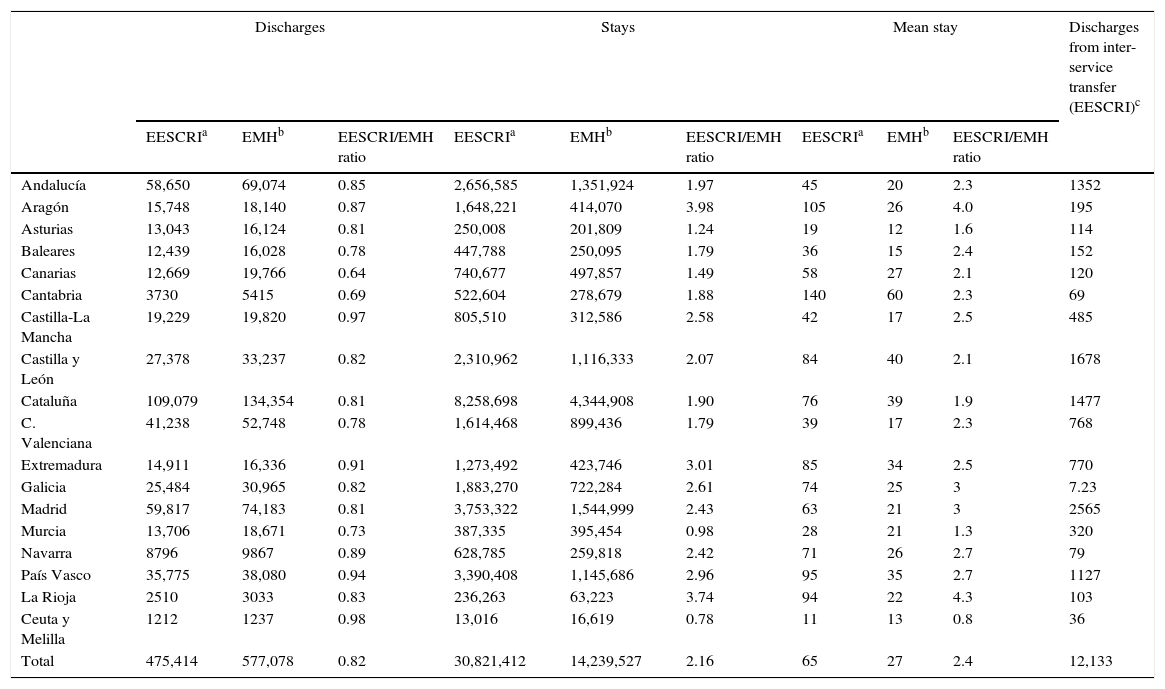
Important differences are seen between the two statistical sources in all the autonomous communities (Table 2). The data by autonomous community reveal that the greater the mismatch between discharges, the greater the mismatch between stays (Spearman rho=0.76; P=.00) (Table 2, Fig. 1).
Hospital stays and discharges caused in 2005–2009. Data broken down by autonomous community.
| Discharges | Stays | Mean stay | Discharges from inter-service transfer (EESCRI)c | |||||||
|---|---|---|---|---|---|---|---|---|---|---|
| EESCRIa | EMHb | EESCRI/EMH ratio | EESCRIa | EMHb | EESCRI/EMH ratio | EESCRIa | EMHb | EESCRI/EMH ratio | ||
| Andalucía | 58,650 | 69,074 | 0.85 | 2,656,585 | 1,351,924 | 1.97 | 45 | 20 | 2.3 | 1352 |
| Aragón | 15,748 | 18,140 | 0.87 | 1,648,221 | 414,070 | 3.98 | 105 | 26 | 4.0 | 195 |
| Asturias | 13,043 | 16,124 | 0.81 | 250,008 | 201,809 | 1.24 | 19 | 12 | 1.6 | 114 |
| Baleares | 12,439 | 16,028 | 0.78 | 447,788 | 250,095 | 1.79 | 36 | 15 | 2.4 | 152 |
| Canarias | 12,669 | 19,766 | 0.64 | 740,677 | 497,857 | 1.49 | 58 | 27 | 2.1 | 120 |
| Cantabria | 3730 | 5415 | 0.69 | 522,604 | 278,679 | 1.88 | 140 | 60 | 2.3 | 69 |
| Castilla-La Mancha | 19,229 | 19,820 | 0.97 | 805,510 | 312,586 | 2.58 | 42 | 17 | 2.5 | 485 |
| Castilla y León | 27,378 | 33,237 | 0.82 | 2,310,962 | 1,116,333 | 2.07 | 84 | 40 | 2.1 | 1678 |
| Cataluña | 109,079 | 134,354 | 0.81 | 8,258,698 | 4,344,908 | 1.90 | 76 | 39 | 1.9 | 1477 |
| C. Valenciana | 41,238 | 52,748 | 0.78 | 1,614,468 | 899,436 | 1.79 | 39 | 17 | 2.3 | 768 |
| Extremadura | 14,911 | 16,336 | 0.91 | 1,273,492 | 423,746 | 3.01 | 85 | 34 | 2.5 | 770 |
| Galicia | 25,484 | 30,965 | 0.82 | 1,883,270 | 722,284 | 2.61 | 74 | 25 | 3 | 7.23 |
| Madrid | 59,817 | 74,183 | 0.81 | 3,753,322 | 1,544,999 | 2.43 | 63 | 21 | 3 | 2565 |
| Murcia | 13,706 | 18,671 | 0.73 | 387,335 | 395,454 | 0.98 | 28 | 21 | 1.3 | 320 |
| Navarra | 8796 | 9867 | 0.89 | 628,785 | 259,818 | 2.42 | 71 | 26 | 2.7 | 79 |
| País Vasco | 35,775 | 38,080 | 0.94 | 3,390,408 | 1,145,686 | 2.96 | 95 | 35 | 2.7 | 1127 |
| La Rioja | 2510 | 3033 | 0.83 | 236,263 | 63,223 | 3.74 | 94 | 22 | 4.3 | 103 |
| Ceuta y Melilla | 1212 | 1237 | 0.98 | 13,016 | 16,619 | 0.78 | 11 | 13 | 0.8 | 36 |
| Total | 475,414 | 577,078 | 0.82 | 30,821,412 | 14,239,527 | 2.16 | 65 | 27 | 2.4 | 12,133 |
Scatter diagram and regression line between the ratios (EESCRI/EMH) of stays and discharges.
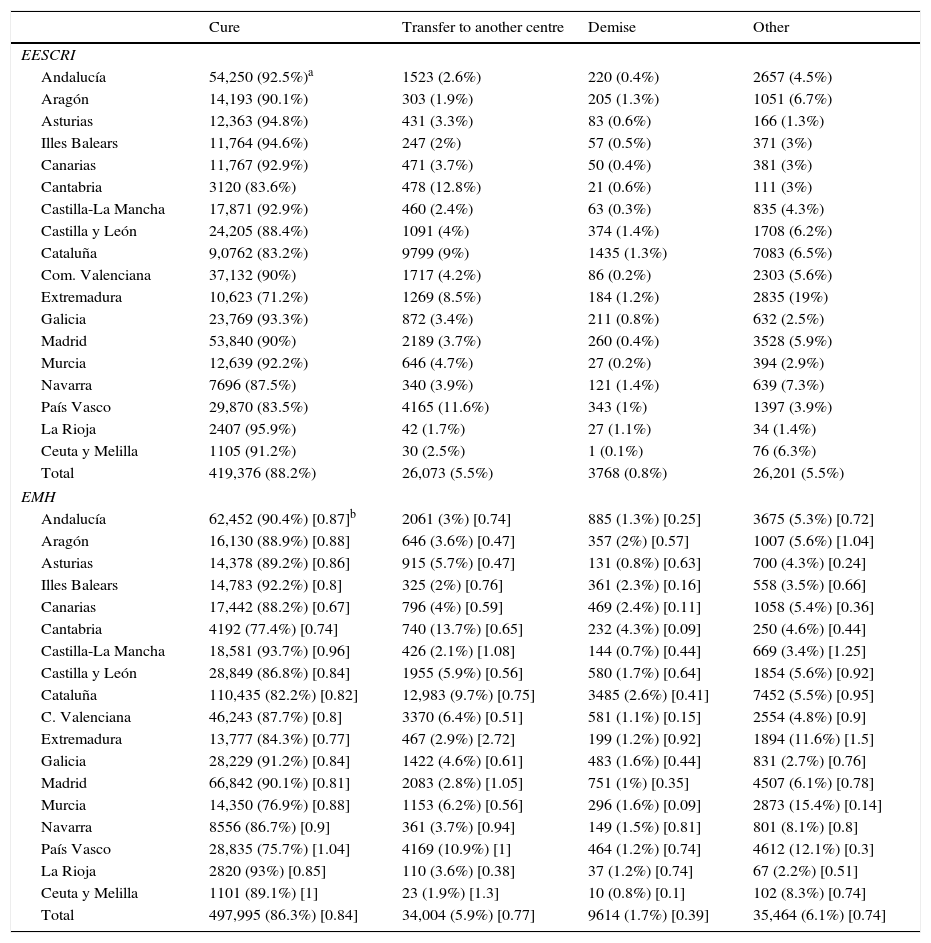
The EESCRI discharges/EMH discharges ratio (the mismatch) varies considerably according to discharge cause: 0.84, 0.77, 0.39 and 0.74 for discharges because of “cure”, “transfer to another centre”, “demise” and “other causes”, respectively (Table 3): the greatest mismatch is seen in the discharges because of demise, both at the national level (0.39) and at the community level. The EMH records 1.7% (9614) psychiatric discharges from demise, while the EESCRI records 0.8% (3768).
Number of discharges collected by two different sources (EESCRI and EMH) during the 2005–2009 period. Data broken down by discharge type and by autonomous community.
| Cure | Transfer to another centre | Demise | Other | |
|---|---|---|---|---|
| EESCRI | ||||
| Andalucía | 54,250 (92.5%)a | 1523 (2.6%) | 220 (0.4%) | 2657 (4.5%) |
| Aragón | 14,193 (90.1%) | 303 (1.9%) | 205 (1.3%) | 1051 (6.7%) |
| Asturias | 12,363 (94.8%) | 431 (3.3%) | 83 (0.6%) | 166 (1.3%) |
| Illes Balears | 11,764 (94.6%) | 247 (2%) | 57 (0.5%) | 371 (3%) |
| Canarias | 11,767 (92.9%) | 471 (3.7%) | 50 (0.4%) | 381 (3%) |
| Cantabria | 3120 (83.6%) | 478 (12.8%) | 21 (0.6%) | 111 (3%) |
| Castilla-La Mancha | 17,871 (92.9%) | 460 (2.4%) | 63 (0.3%) | 835 (4.3%) |
| Castilla y León | 24,205 (88.4%) | 1091 (4%) | 374 (1.4%) | 1708 (6.2%) |
| Cataluña | 9,0762 (83.2%) | 9799 (9%) | 1435 (1.3%) | 7083 (6.5%) |
| Com. Valenciana | 37,132 (90%) | 1717 (4.2%) | 86 (0.2%) | 2303 (5.6%) |
| Extremadura | 10,623 (71.2%) | 1269 (8.5%) | 184 (1.2%) | 2835 (19%) |
| Galicia | 23,769 (93.3%) | 872 (3.4%) | 211 (0.8%) | 632 (2.5%) |
| Madrid | 53,840 (90%) | 2189 (3.7%) | 260 (0.4%) | 3528 (5.9%) |
| Murcia | 12,639 (92.2%) | 646 (4.7%) | 27 (0.2%) | 394 (2.9%) |
| Navarra | 7696 (87.5%) | 340 (3.9%) | 121 (1.4%) | 639 (7.3%) |
| País Vasco | 29,870 (83.5%) | 4165 (11.6%) | 343 (1%) | 1397 (3.9%) |
| La Rioja | 2407 (95.9%) | 42 (1.7%) | 27 (1.1%) | 34 (1.4%) |
| Ceuta y Melilla | 1105 (91.2%) | 30 (2.5%) | 1 (0.1%) | 76 (6.3%) |
| Total | 419,376 (88.2%) | 26,073 (5.5%) | 3768 (0.8%) | 26,201 (5.5%) |
| EMH | ||||
| Andalucía | 62,452 (90.4%) [0.87]b | 2061 (3%) [0.74] | 885 (1.3%) [0.25] | 3675 (5.3%) [0.72] |
| Aragón | 16,130 (88.9%) [0.88] | 646 (3.6%) [0.47] | 357 (2%) [0.57] | 1007 (5.6%) [1.04] |
| Asturias | 14,378 (89.2%) [0.86] | 915 (5.7%) [0.47] | 131 (0.8%) [0.63] | 700 (4.3%) [0.24] |
| Illes Balears | 14,783 (92.2%) [0.8] | 325 (2%) [0.76] | 361 (2.3%) [0.16] | 558 (3.5%) [0.66] |
| Canarias | 17,442 (88.2%) [0.67] | 796 (4%) [0.59] | 469 (2.4%) [0.11] | 1058 (5.4%) [0.36] |
| Cantabria | 4192 (77.4%) [0.74] | 740 (13.7%) [0.65] | 232 (4.3%) [0.09] | 250 (4.6%) [0.44] |
| Castilla-La Mancha | 18,581 (93.7%) [0.96] | 426 (2.1%) [1.08] | 144 (0.7%) [0.44] | 669 (3.4%) [1.25] |
| Castilla y León | 28,849 (86.8%) [0.84] | 1955 (5.9%) [0.56] | 580 (1.7%) [0.64] | 1854 (5.6%) [0.92] |
| Cataluña | 110,435 (82.2%) [0.82] | 12,983 (9.7%) [0.75] | 3485 (2.6%) [0.41] | 7452 (5.5%) [0.95] |
| C. Valenciana | 46,243 (87.7%) [0.8] | 3370 (6.4%) [0.51] | 581 (1.1%) [0.15] | 2554 (4.8%) [0.9] |
| Extremadura | 13,777 (84.3%) [0.77] | 467 (2.9%) [2.72] | 199 (1.2%) [0.92] | 1894 (11.6%) [1.5] |
| Galicia | 28,229 (91.2%) [0.84] | 1422 (4.6%) [0.61] | 483 (1.6%) [0.44] | 831 (2.7%) [0.76] |
| Madrid | 66,842 (90.1%) [0.81] | 2083 (2.8%) [1.05] | 751 (1%) [0.35] | 4507 (6.1%) [0.78] |
| Murcia | 14,350 (76.9%) [0.88] | 1153 (6.2%) [0.56] | 296 (1.6%) [0.09] | 2873 (15.4%) [0.14] |
| Navarra | 8556 (86.7%) [0.9] | 361 (3.7%) [0.94] | 149 (1.5%) [0.81] | 801 (8.1%) [0.8] |
| País Vasco | 28,835 (75.7%) [1.04] | 4169 (10.9%) [1] | 464 (1.2%) [0.74] | 4612 (12.1%) [0.3] |
| La Rioja | 2820 (93%) [0.85] | 110 (3.6%) [0.38] | 37 (1.2%) [0.74] | 67 (2.2%) [0.51] |
| Ceuta y Melilla | 1101 (89.1%) [1] | 23 (1.9%) [1.3] | 10 (0.8%) [0.1] | 102 (8.3%) [0.74] |
| Total | 497,995 (86.3%) [0.84] | 34,004 (5.9%) [0.77] | 9614 (1.7%) [0.39] | 35,464 (6.1%) [0.74] |
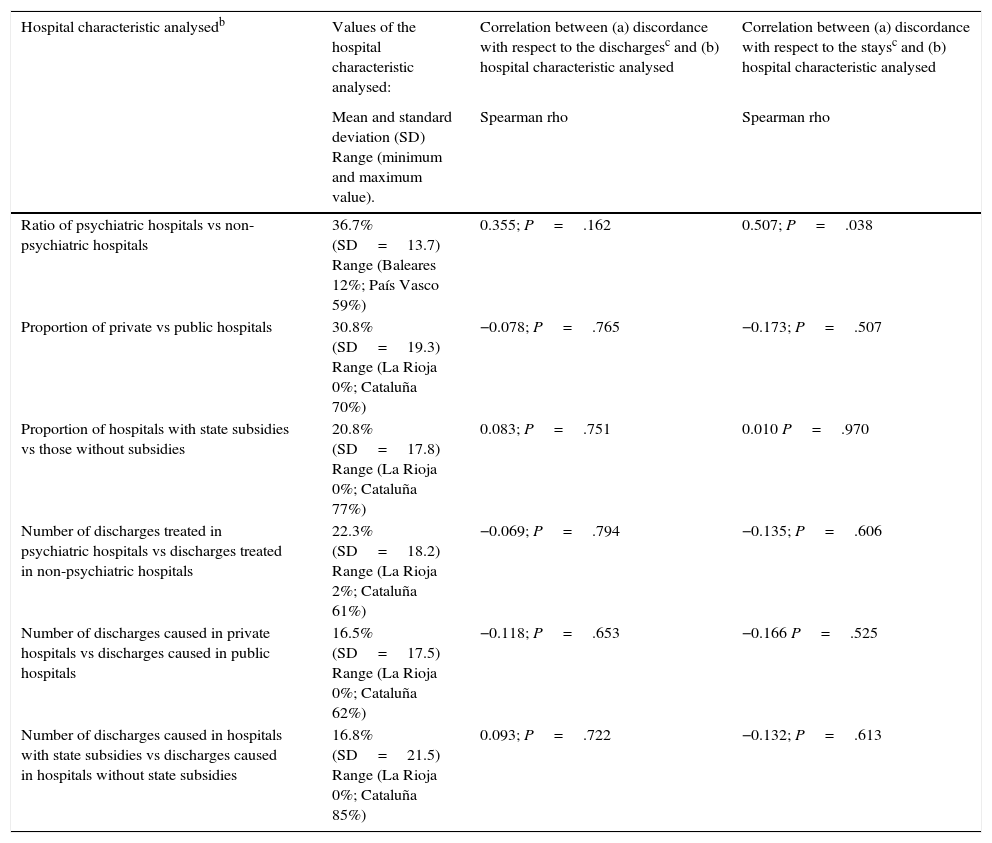
Lastly, we studied the possible correlation between a series of characteristics of community-divided psychiatric hospitalisation and the magnitude of the statistical source mismatch. Through this analysis, carried by autonomous community for the period included between 2005 and 2009, only a moderate association (Spearman rho=0.507) that is statistically significant (P=.038) is seen: the communities with a high ratio of psychiatric hospitals present a greater mismatch (EESCRI/EMH) in the stay registers. The hospital characteristics, the Spearman rho value and their statistical significance are shown in Table 4.
Correlation between hospital characteristics of the different autonomous communities and the mismatch between statistical sources (EESCRI and EMHa) observed at community level.
| Hospital characteristic analysedb | Values of the hospital characteristic analysed: | Correlation between (a) discordance with respect to the dischargesc and (b) hospital characteristic analysed | Correlation between (a) discordance with respect to the staysc and (b) hospital characteristic analysed |
|---|---|---|---|
| Mean and standard deviation (SD) Range (minimum and maximum value). | Spearman rho | Spearman rho | |
| Ratio of psychiatric hospitals vs non-psychiatric hospitals | 36.7% (SD=13.7) Range (Baleares 12%; País Vasco 59%) | 0.355; P=.162 | 0.507; P=.038 |
| Proportion of private vs public hospitals | 30.8% (SD=19.3) Range (La Rioja 0%; Cataluña 70%) | −0.078; P=.765 | −0.173; P=.507 |
| Proportion of hospitals with state subsidies vs those without subsidies | 20.8% (SD=17.8) Range (La Rioja 0%; Cataluña 77%) | 0.083; P=.751 | 0.010 P=.970 |
| Number of discharges treated in psychiatric hospitals vs discharges treated in non-psychiatric hospitals | 22.3% (SD=18.2) Range (La Rioja 2%; Cataluña 61%) | −0.069; P=.794 | −0.135; P=.606 |
| Number of discharges caused in private hospitals vs discharges caused in public hospitals | 16.5% (SD=17.5) Range (La Rioja 0%; Cataluña 62%) | −0.118; P=.653 | −0.166 P=.525 |
| Number of discharges caused in hospitals with state subsidies vs discharges caused in hospitals without state subsidies | 16.8% (SD=21.5) Range (La Rioja 0%; Cataluña 85%) | 0.093; P=.722 | −0.132; P=.613 |
Analysis carried out at the level of autonomous communities for the 2005–2009 period for hospitals having a psychiatric hospitalisation service.
Statistics of Establishments Providing Inpatient Care (EESCRI) and Hospital Morbidity Survey (EMH).
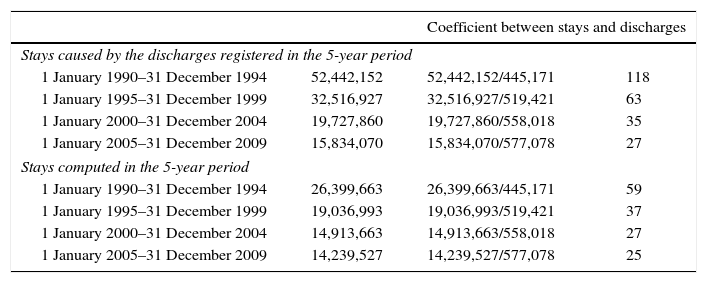
At national level, the EESCRI gives a mean stay of 101 and 65 days and the EMH of 118 and 27 days, for the 1990–1994 and 2005–2009 periods, respectively (Table 1). The differences at the level of the autonomous communities are extraordinary (Table 2). This is attributed to the mismatch between sources with respect to the number of stays and discharges recorded, but also to the way in which mean stay is calculated.
The EESCRI provides only stays caused by natural years; consequently, calculating mean stay is based on stays caused between 1 January and 31 December of a specific year. In contrast, the EMH provides the number of stays caused by the discharges for which the mean stay is to be calculated, independently of whether those stays were produced before 1 January.
We can apply the two formulas to the same data source, the EMH (Table 5). The 445,171 discharges recorded by the EMH in 1990–1994 caused 52,442,152 stays, although only a fraction of these stays (26,399,663) took place between 1 January 1990 and 31 December 1994. The result of dividing discharges by the stays they cause (52,442,152/445,171=118) is far from the result of dividing discharges by the stays produced during the same period (26,399,663/445,171=59), even though we are using the same source of statistics (EMH). The values resulting from the two ways of calculating the mean stay will get father apart as hospitalisations that cause stays before 1 January (that is, prolonged hospitalisations) are produced.
Coefficient between psychiatric stays and discharges. Statistical source: EMH (CIE-9:290-319). Time series: 1990–2009.a
| Coefficient between stays and discharges | |||
|---|---|---|---|
| Stays caused by the discharges registered in the 5-year period | |||
| 1 January 1990–31 December 1994 | 52,442,152 | 52,442,152/445,171 | 118 |
| 1 January 1995–31 December 1999 | 32,516,927 | 32,516,927/519,421 | 63 |
| 1 January 2000–31 December 2004 | 19,727,860 | 19,727,860/558,018 | 35 |
| 1 January 2005–31 December 2009 | 15,834,070 | 15,834,070/577,078 | 27 |
| Stays computed in the 5-year period | |||
| 1 January 1990–31 December 1994 | 26,399,663 | 26,399,663/445,171 | 59 |
| 1 January 1995–31 December 1999 | 19,036,993 | 19,036,993/519,421 | 37 |
| 1 January 2000–31 December 2004 | 14,913,663 | 14,913,663/558,018 | 27 |
| 1 January 2005–31 December 2009 | 14,239,527 | 14,239,527/577,078 | 25 |
The EESCRI records fewer discharges and, paradoxically, more than double the stays than the EMH; the EESCRI offers a mean hospital stay that exceeds twice the one obtained using the EMH figures. The mismatch between sources increases over time. The mismatch is not exceptional; it is found in all the autonomous communities. The data analysed are broken down at the community level: a greater proportion of psychiatric hospitals included in hospital care correlates slightly with a greater degree of mismatch between sources. No other correlations between hospital care characteristics and mismatch have been obtained.
There are few published reports about this. We have found one study contrasting the results from both sources.16 That study, which analyses discharges caused by the set of all the pathologies, indicates that the EMH underestimates the number of discharges with respect to the EESCRI figures (the opposite of what is found in our study, exclusively related to the area of psychiatry); the authors conclude that the mismatch between the two sources should be attributed to possible sampling errors associated with the EMH.
Sample errorHowever, the data that we found in our study makes it impossible to attribute the mismatch to an EMH-associated sampling error, given that the difference between the two sources far exceeds the EHM margin of error (Table 1). For example, in 2005–2009, the difference between sources is 101,664 discharges (475,414 vs 577,078), yielding a sampling error attributable to the EMH of ±30 discharges. There is a decisive argument that lets us conclude that the EESCRI underestimates the number of psychiatric discharges and also makes it impossible to attribute the mismatch to sampling errors. To prepare the EMH, INE agents go to the various hospitals and collect a random sampling of the HDR (number of unweighted discharges). The number of unweighted discharges that the EMH shows (535,721 in 2005–2009, corresponding to 577,078 discharges once the data are weighted) exceeds the discharges recorded by the EESCRI (475,414 in 2005–2009). That is, the INE agents count many more discharges than the EESCRI reports, even using a sample.
Causes of the mismatchWe considered two possible ways of explaining mismatch observed: (1) the first possibility is related to the method by which attenuated morbidity is broken down, based on psychiatric diagnosis (EMH) vs psychiatric care service (EESCRI); (2) the second one is related to the possibility that the EESCRI does not contain accurate/truthful information. The EESCRI is based on information provided by the hospitals themselves (self-report questionnaires), which is information subject to the truthfulness/accuracy of the responses, while the EMH uses the registers of patients discharged from hospital (HDR) directly to prepare its statistics, through INE agents for the data collection. In any case, errors in the patient register (HDR), logically, affect both statistics equally.12,16
Computing dischargesThe attended psychiatric morbidity in psychiatric patients (CIE-9 codes 290-319) could be computed for services different from psychiatry, as the EMH collects morbidity based on the diagnosis (CIE-9) causing the hospitalisation while the EESCRI does so based on the healthcare service in which the patient is given care. It seems plausible to consider that some patients cause hospitalisation due to psychiatric motives but are treated in other services. For example, a patient with a suicide attempt, and a psychiatric diagnosis as the main cause of hospitalisation, could be seen in internal medicine, emergency services or traumatology; likewise, other patients, such as those causing hospitalisation by organic age-related disorders (ICD-9 codes 290, 293-4) could also be seen (and registered) in other services.
As our study, focused on the analysis of psychiatric morbidity reflects, the mismatch between sources of statistics is especially notable in the case of the discharges caused by demise; these are underestimated in the EESCRI, that collects the data based on the healthcare service that treats the patient, with respect to the EMH, that gathers the data based on the pathology causing the hospitalisation. As for the discharges due to “cure”, “transfer” or “others”, we did not find such a great mismatch in our study. However, for the total of all the pathologies and services,16 the mismatch in demise-caused discharges is not greater than that seen in the rest of the types of discharge. That is, the extraordinary underestimation of hospital mortality is characteristic of psychiatry services, not being seen for the total of all the care services.
As we have indicated previously, this phenomenon could be related to the differing ways of breaking down morbidity in the EMH and EESCRI: the different method of morbidity break-down could explain disparities between sources when the area of psychiatry is analysed.
It is also worth mentioning that the “inter-service discharges” are not counted as hospital discharges,5,15 although the EESCRI does indeed allow you to know their number. If these were to be counted as hospital discharges in error, they would still be absolutely insufficient in number to explain the differences between the EMH and EESCRI (Table 2).
Computing staysThe EESCRI registers more than double the stays (226.8%) than the EMH, despite containing only 85.7% of the discharges that the latter collects. This is not only contrary to what would be expected, it is disproportionate in the relation between stays and discharges. The difference in data break-down (diagnosis-based in the EMH and healthcare service-based in the EESCI) could mean an under-register by the EESCRI, but it cannot explain the over-registration of stays.
Mean stayThe “mean stay” estimated by the EESCRI does not correspond strictly to the concept of “mean stay”.13 The reason why is that the EESCRI calculates the mean based on the stays produced between 1 January and 31 December of a specific year instead of using the stays caused by discharges registered between 1 January and 31 December.6,17 The “sui generis” calculation that the EESCRI performs underestimates the real value of mean stay to the extent in which prolonged stays occur. Consequently, the mean stay reported by the EESCRI with respect to, for example, the psychiatric hospitals17 could actually be much greater than the data that EESCRI offers us.
CorrelationsWe analysed the possible correlation between hospitalisation features of the various autonomous communities and the mismatch between sources. The only statistically significant correlation could indicate that the EESCRI tends to overestimate psychiatric hospital stays. In any case, several aspects have to be considered important weaknesses in the correlation analysis performed: the elevated degree of data break-down (at community level); and the fact that hospitalisation characteristics are extracted from the EESCRI itself, whose reliability we are questioning (there are no other alternative sources).
ConclusionsIt is surprising that the EMH and EESCRI offer data that is so much at variance, when they have the same source of information (HDR) available. Neither sampling error nor discharge type can explain this mismatch. The differences in the breakdown criteria used (“care service” in the EESCRI vs “clinical diagnosis” in the EMH) could explain the mismatch for the psychiatric discharges, but not that of the stays. At any rate, it is worth mentioning the possibility that the data collected by the EESCRI might not be sufficiently accurate, assuming that the main difference between the EMH and EESCRI lies in the fact that the latter is subject to the accuracy and precision of the responses. Offering a non-hypothetical explanation would require contrasting the data at the minimum break-down level: hospital by hospital. We understand that a detailed study is needed to make it possible to resolve or identify the causes of divergence between the two sources in the context of improving management efficiency. This would, in turn, allow us to increase the usefulness of the resources that are already in our hands.
Ethical responsibilitiesProtection of human and animal subjectsThe authors declare that no experiments on human beings or animals have been carried out in this investigation.
Confidentiality of dataThe authors declare that no patient data appear in this article.
Right to privacy and informed consentThe authors declare that no patient data appear in this article.
Conflicts of interestThe authors have no conflicts of interest to declare.
Please cite this article as: Medel-Herrero A, Gómez-Beneyto M, Saz-Parkinson Z, Bravo-Ortiz MF, Amate JM. Discordancia entre fuentes estadísticas sanitarias de ámbito nacional (EMH y EESCRI, 1990–2009). Análisis de la morbilidad psiquiátrica. Rev Psiquiatr Salud Ment (Barc.). 2016;9:22–30.


