To analyse the changes in mortality trends by suicide according to Autonomous Community and sex in Spain during the period 1980–2016 using Joinpoint regression models.
MethodsMortality data were obtained from the Instituo Nacional de Estadística. For each Spanish autonomous community and sex, crude and standardised rates were calculated. The joinpoint analysis was used to identify the best-fitting points where a statistically significant change in the trend occurred.
ResultsThe joinpoint analysis allows to differentiate areas in which the rates remain stable in men (Cantabria, Castilla-La Mancha) and women (Canary and Cantabria) throughout the study period and others with a continued decline (Extremadura in both men and women and Castilla-La Mancha in women). In those communities where changes in the trend are observed, in almost all of them, there is a first period of increase in rates in both men and women. The most recent trends show divergences between the different autonomous communities and, in men, Andalusia, the Canary Islands, Castilla-León, the Valencian Community, Galicia, Murcia, the Basque Country and La Rioja show significant downward trends, while Catalonia and Madrid show significant increases (2007–2016: 2.4% and 2010–2016: 18.7% respectively). Something similar is observed in women where Andalusia, Castilla y León, Valencian Community, Galicia, Murcia, País Vasco and La Rioja show downward trends while in the Balearic Islands, Catalonia and Madrid the trend is upward (2001–2016: 5.0%; 2006–2016: 4.2% and 2010–2016: 18.7% respectively).
ConclusionsSuicide mortality varies widely among the Spanish autonomous communities, both in terms of mortality level and trends. Little is known about the determinants of observed trends and, therefore, more studies are needed.
Analizar los cambios en las tendencias de la mortalidad por suicidio según comunidad autónoma y sexo en España durante el período 1980-2016 utilizando modelos de regresión joinpoint.
MétodosLos datos de mortalidad se obtuvieron del Instituto Nacional de Estadística. Para cada comunidad autónoma y sexo, se calcularon las tasas brutas y estandarizadas. El análisis de regresión joinpoint se utilizó para identificar los puntos más adecuados en los que se produjo un cambio estadísticamente significativo en la tendencia.
ResultadosEl análisis joinpoint permite diferenciar comunidades en las que las tasas permanecen a lo largo de todo el periodo de estudio estables tanto en hombres (Cantabria, Castilla-La Mancha) como en mujeres (Canarias y Cantabria) y otras con un descenso continuado (Extremadura en hombres y mujeres y Castilla-La Mancha en mujeres). En aquellas comunidades en las que se observan cambios en la tendencia se aprecia, en casi todas ellas, un primer periodo de incremento en las tasas tanto en hombres como en mujeres. Las tendencias más recientes muestran divergencias entre las diferentes comunidades autónomas así, en los hombres, Andalucía, Canarias, Castilla-León, Comunidad Valenciana, Galicia, Murcia, País Vasco y La Rioja muestran tendencias descendentes significativas mientras que Cataluña y Madrid muestran incrementos significativos (2007-2016: 2,4% y 2010-2016: 18,7%, respectivamente). Algo similar se observa en las mujeres, para las que Andalucía, Castilla y León, Comunidad Valenciana, Galicia, Murcia, País Vasco y La Rioja muestran tendencias descendentes mientras que en Baleares, Cataluña y Madrid la tendencia es ascendente (2001-2016: 5,0%; 2006-2016: 4,2% y 2010-2016: 18,7% respectivamente).
ConclusionesLa mortalidad por suicidio varía ampliamente a nivel de comunidad autónoma, tanto en términos de nivel de mortalidad como de tendencias. Poco se sabe sobre los determinantes de las tendencias observadas y, por lo tanto, se necesitan más estudios.
Suicide is a complex public health problem and the leading cause of premature death.1 There were an estimated 788,000 suicides (rate of 10.7 per 100,000 people) in 2015, representing 1.4% of all deaths worldwide.2 In developed countries, a substantial proportion of the burden of mental illness is attributable to the high prevalence of suicide mortality.3
Suicide mortality differs between sexes, age groups, geographical areas, and socio-political environments, and is variably associated with different risk factors, indicating aetiological heterogeneity.1
In Spain, data provided by the National Institute of Statistics (INE) since 2008, places suicide as the primary unnatural cause of death and this situation remained unchanged until 2016 (the last available year), when suicide deaths are almost double those of road accidents.4 A recent article5 shows that age-adjusted suicide death rates increased in the period 1980–2016 for both men (from 9.8/100,000 in 1980 to 11.8 in 2016, with an average annual increase of .8%) and women (rates increased by 1.0% per year from 2.7/100,000 in 1980 to 3.7 in 2016).
In our country, several studies have been undertaken on the temporal evolution of suicide in some Autonomous Communities: Basque Country (2001–2012),6 Navarra (2000–2015),7 Galicia (1976–19988 and 1975–2012),9 Catalonia (1986–200210 and 2000–201111), Andalusia (1976–199512 and 1975–2012),13 Valencian Community (1976–1990),14 La Rioja (1980–2012)15 and Asturias (1975–199416 and 2002–201617). These studies have quite different objectives, methodologies (periods, standard populations and statistical methods) and ways of presenting results, which makes them difficult to compare.
Mortality trends can be analysed through various different statistical approaches.18 At the beginning of this century, a new method called “Poisson's segmented regression models” or Joinpoint regression analysis was proposed, which has proved useful to identify and describe varying data trends over time,19 and has been used in our context in suicide mortality.5,7,13,15
Taking into account all of the above, our aim was to provide updated information on suicide mortality in Spain and to analyse recent changes in the trend of this mortality in the period 1980–2016 according to Autonomous Community and sex, using Joinpoint regression models.
Patients and methodsMortality data by autonomous community, age and sex correspond to those published by the INE for 1980–2016. Deaths by suicide were used (codes E950-E959 and X60-X84, Y87.0 of the 9th and 10th revisions of the International Classification of Diseases (ICD) for the periods 1980–1998 and 1999–2008, respectively). Populations estimated as of 1 July by the INE were used for the calculation of indicators.
For each Autonomous Community, the gross and standardised rates were calculated in men and women by the direct method, using the European population as the benchmark,20 and expressing them as rates per 100,000person/year.
Joinpoint regression models were used for trend analysis. The purpose of these models is twofold: to identify when significant changes in trend occur and to estimate the magnitude of the increase or decrease observed in each interval. In this way, the results expressed the years (period) making up each trend, as well as the annual percent change (APC) for each. Standardised mortality rates and their standard errors were used to estimate these models.
We set the minimum number of data in the linear trend at both ends of the period at 3. A maximum of 3 turning points was sought in each regression, for which the programme looks for the simplest model that fits the data using the weighted least squares technique and then estimates its statistical significance using Monte Carlo permutations.
To quantify the trend over the whole period, we calculated the average annual percent change (AAPC) as a geometric weighted average of the APCs of the joinpoint model. This represents a summary measure of the trend over the study period. If an AAPC is found entirely within a single segment, the AAPC will be equal to the APC for that segment.
When describing the results of trend analysis, the terms “increase” or “decrease” indicate statistical significance (p<.05), while non-significant results are reported as “stable”.
The software's pairwise comparison option was used to check whether trends were parallel according to sex.21 Statistical significance was set at .05.
All calculations were made with the Joinpoint Regression software.22
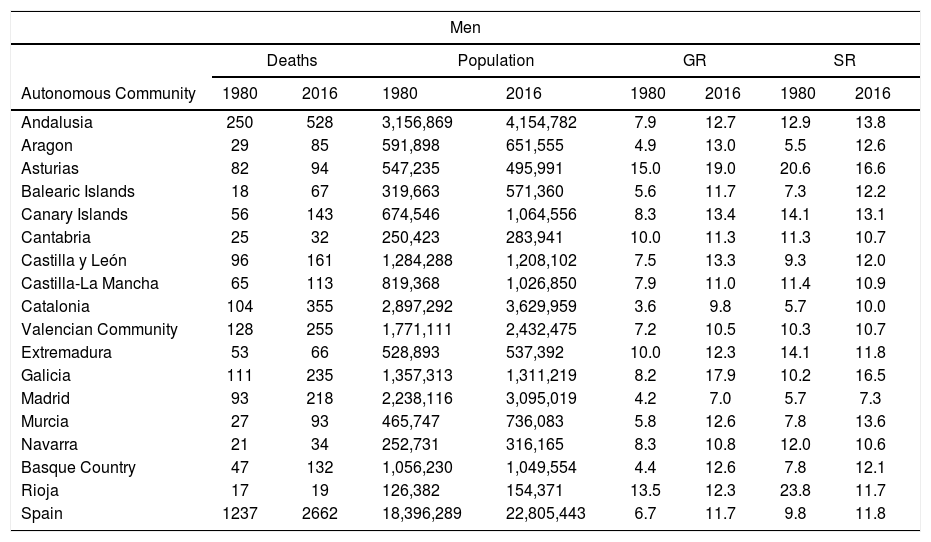
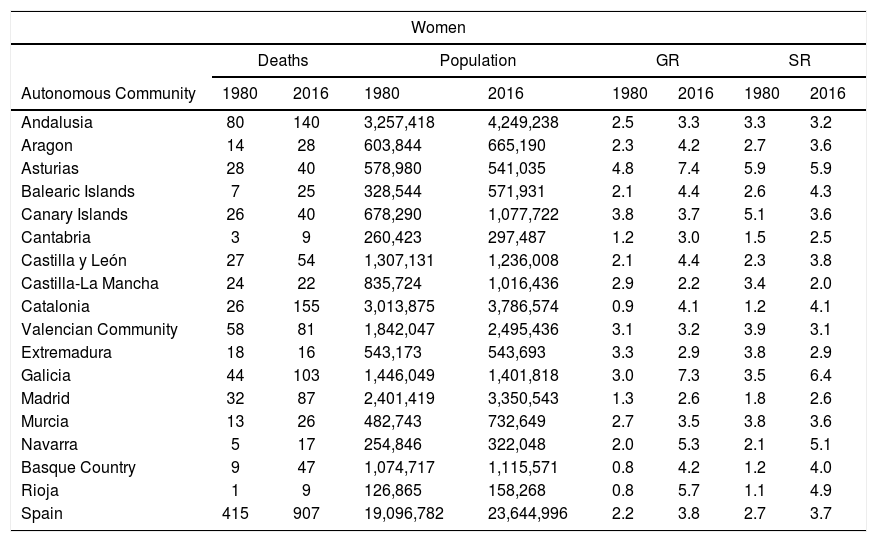
ResultsTables 1 and 2 show the number of deaths, populations, gross rate, and standardised rate for the years 1980 and 2016 per Autonomous Community and according to sex.
Suicide mortality in men per Autonomous Community (1980, 2016).
| Men | ||||||||
|---|---|---|---|---|---|---|---|---|
| Deaths | Population | GR | SR | |||||
| Autonomous Community | 1980 | 2016 | 1980 | 2016 | 1980 | 2016 | 1980 | 2016 |
| Andalusia | 250 | 528 | 3,156,869 | 4,154,782 | 7.9 | 12.7 | 12.9 | 13.8 |
| Aragon | 29 | 85 | 591,898 | 651,555 | 4.9 | 13.0 | 5.5 | 12.6 |
| Asturias | 82 | 94 | 547,235 | 495,991 | 15.0 | 19.0 | 20.6 | 16.6 |
| Balearic Islands | 18 | 67 | 319,663 | 571,360 | 5.6 | 11.7 | 7.3 | 12.2 |
| Canary Islands | 56 | 143 | 674,546 | 1,064,556 | 8.3 | 13.4 | 14.1 | 13.1 |
| Cantabria | 25 | 32 | 250,423 | 283,941 | 10.0 | 11.3 | 11.3 | 10.7 |
| Castilla y León | 96 | 161 | 1,284,288 | 1,208,102 | 7.5 | 13.3 | 9.3 | 12.0 |
| Castilla-La Mancha | 65 | 113 | 819,368 | 1,026,850 | 7.9 | 11.0 | 11.4 | 10.9 |
| Catalonia | 104 | 355 | 2,897,292 | 3,629,959 | 3.6 | 9.8 | 5.7 | 10.0 |
| Valencian Community | 128 | 255 | 1,771,111 | 2,432,475 | 7.2 | 10.5 | 10.3 | 10.7 |
| Extremadura | 53 | 66 | 528,893 | 537,392 | 10.0 | 12.3 | 14.1 | 11.8 |
| Galicia | 111 | 235 | 1,357,313 | 1,311,219 | 8.2 | 17.9 | 10.2 | 16.5 |
| Madrid | 93 | 218 | 2,238,116 | 3,095,019 | 4.2 | 7.0 | 5.7 | 7.3 |
| Murcia | 27 | 93 | 465,747 | 736,083 | 5.8 | 12.6 | 7.8 | 13.6 |
| Navarra | 21 | 34 | 252,731 | 316,165 | 8.3 | 10.8 | 12.0 | 10.6 |
| Basque Country | 47 | 132 | 1,056,230 | 1,049,554 | 4.4 | 12.6 | 7.8 | 12.1 |
| Rioja | 17 | 19 | 126,382 | 154,371 | 13.5 | 12.3 | 23.8 | 11.7 |
| Spain | 1237 | 2662 | 18,396,289 | 22,805,443 | 6.7 | 11.7 | 9.8 | 11.8 |
GR: gross rate per 100,000persons/year; SR: standardised rates per 100,000persons/year (standard European population).
Suicide mortality in women per Autonomous Community (1980, 2016).
| Women | ||||||||
|---|---|---|---|---|---|---|---|---|
| Deaths | Population | GR | SR | |||||
| Autonomous Community | 1980 | 2016 | 1980 | 2016 | 1980 | 2016 | 1980 | 2016 |
| Andalusia | 80 | 140 | 3,257,418 | 4,249,238 | 2.5 | 3.3 | 3.3 | 3.2 |
| Aragon | 14 | 28 | 603,844 | 665,190 | 2.3 | 4.2 | 2.7 | 3.6 |
| Asturias | 28 | 40 | 578,980 | 541,035 | 4.8 | 7.4 | 5.9 | 5.9 |
| Balearic Islands | 7 | 25 | 328,544 | 571,931 | 2.1 | 4.4 | 2.6 | 4.3 |
| Canary Islands | 26 | 40 | 678,290 | 1,077,722 | 3.8 | 3.7 | 5.1 | 3.6 |
| Cantabria | 3 | 9 | 260,423 | 297,487 | 1.2 | 3.0 | 1.5 | 2.5 |
| Castilla y León | 27 | 54 | 1,307,131 | 1,236,008 | 2.1 | 4.4 | 2.3 | 3.8 |
| Castilla-La Mancha | 24 | 22 | 835,724 | 1,016,436 | 2.9 | 2.2 | 3.4 | 2.0 |
| Catalonia | 26 | 155 | 3,013,875 | 3,786,574 | 0.9 | 4.1 | 1.2 | 4.1 |
| Valencian Community | 58 | 81 | 1,842,047 | 2,495,436 | 3.1 | 3.2 | 3.9 | 3.1 |
| Extremadura | 18 | 16 | 543,173 | 543,693 | 3.3 | 2.9 | 3.8 | 2.9 |
| Galicia | 44 | 103 | 1,446,049 | 1,401,818 | 3.0 | 7.3 | 3.5 | 6.4 |
| Madrid | 32 | 87 | 2,401,419 | 3,350,543 | 1.3 | 2.6 | 1.8 | 2.6 |
| Murcia | 13 | 26 | 482,743 | 732,649 | 2.7 | 3.5 | 3.8 | 3.6 |
| Navarra | 5 | 17 | 254,846 | 322,048 | 2.0 | 5.3 | 2.1 | 5.1 |
| Basque Country | 9 | 47 | 1,074,717 | 1,115,571 | 0.8 | 4.2 | 1.2 | 4.0 |
| Rioja | 1 | 9 | 126,865 | 158,268 | 0.8 | 5.7 | 1.1 | 4.9 |
| Spain | 415 | 907 | 19,096,782 | 23,644,996 | 2.2 | 3.8 | 2.7 | 3.7 |
GR: gross rate per 100,000persons/year; SR: standardised rates per 100,000persons/year (standard European population).
The number of deaths by suicide approximately doubled from 1980 to 2016 for both men (from 1237 in 1980 to 2662 in 2016) and women (from 415 in 1980 to 907 in 2016). At Autonomous Community level, there is great variability both in men (the ratio 2016/1980 ranges from 1.1 in La Rioja to 3.7 in the Balearic Islands) and in women (the figures range from .9 in Extremadura and Castile-La Mancha to 9.0 in La Rioja).
In 2016 Asturias and Galicia show the highest standardised rates for both men (16.6 and 16.4 respectively) and women (5.9 and 6.3 respectively).
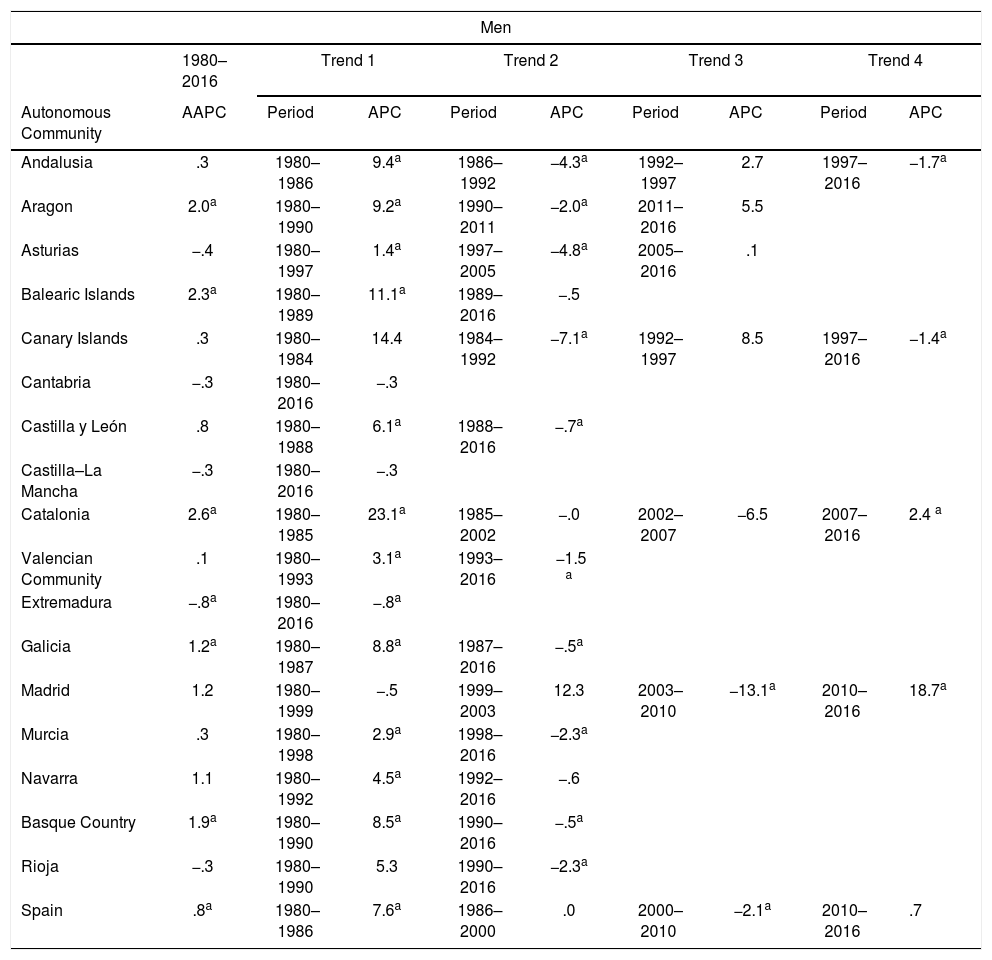
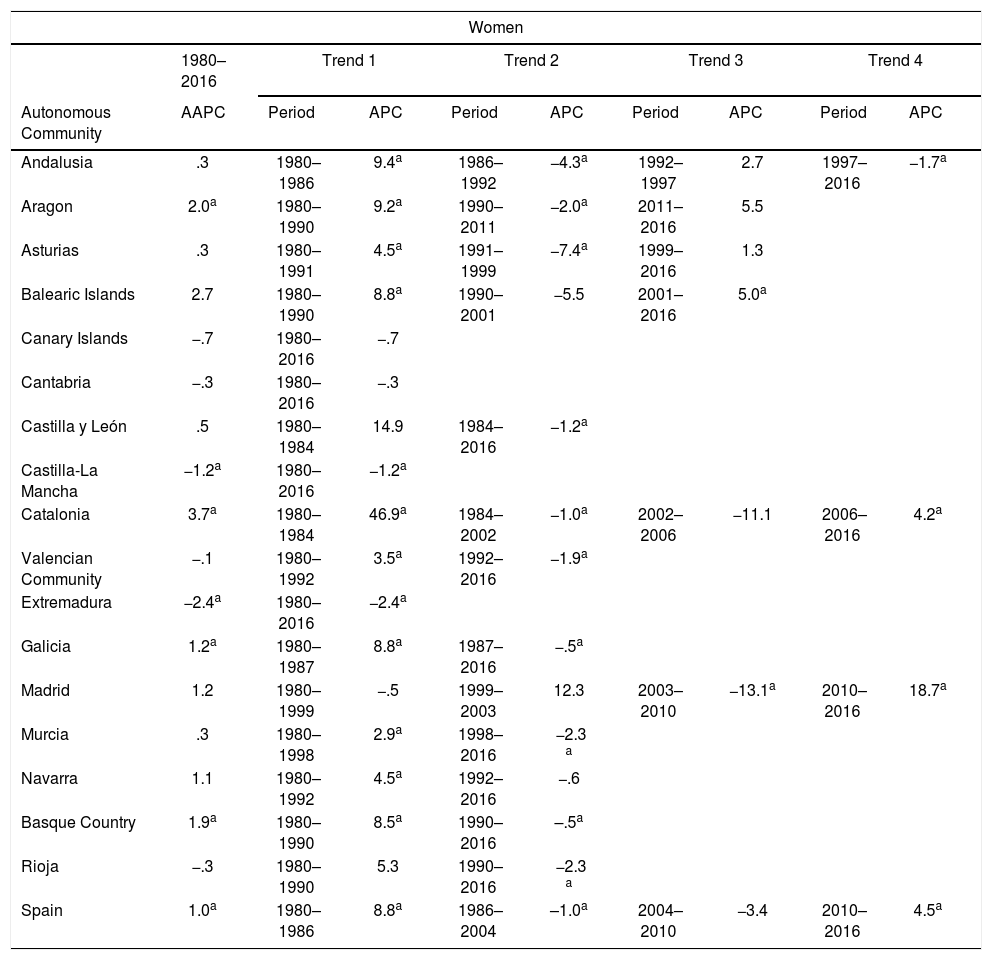
Tables 3 and 4 show the results of the Joinpoint regression analysis, i.e., the points at which the rates change significantly and the annual percent change in each trend in men and women, respectively, per Autonomous Community. Likewise, the average annual percentage change (AAPC) for the study period (1980–2016) is shown.
Suicide mortality trends in men according to Autonomous Community (1980–2016).
| Men | |||||||||
|---|---|---|---|---|---|---|---|---|---|
| 1980–2016 | Trend 1 | Trend 2 | Trend 3 | Trend 4 | |||||
| Autonomous Community | AAPC | Period | APC | Period | APC | Period | APC | Period | APC |
| Andalusia | .3 | 1980–1986 | 9.4a | 1986–1992 | −4.3a | 1992–1997 | 2.7 | 1997–2016 | −1.7a |
| Aragon | 2.0a | 1980–1990 | 9.2a | 1990–2011 | −2.0a | 2011–2016 | 5.5 | ||
| Asturias | −.4 | 1980–1997 | 1.4a | 1997–2005 | −4.8a | 2005–2016 | .1 | ||
| Balearic Islands | 2.3a | 1980–1989 | 11.1a | 1989–2016 | −.5 | ||||
| Canary Islands | .3 | 1980–1984 | 14.4 | 1984–1992 | −7.1a | 1992–1997 | 8.5 | 1997–2016 | −1.4a |
| Cantabria | −.3 | 1980–2016 | −.3 | ||||||
| Castilla y León | .8 | 1980–1988 | 6.1a | 1988–2016 | −.7a | ||||
| Castilla–La Mancha | −.3 | 1980–2016 | −.3 | ||||||
| Catalonia | 2.6a | 1980–1985 | 23.1a | 1985–2002 | −.0 | 2002–2007 | −6.5 | 2007–2016 | 2.4 a |
| Valencian Community | .1 | 1980–1993 | 3.1a | 1993–2016 | −1.5 a | ||||
| Extremadura | −.8a | 1980–2016 | −.8a | ||||||
| Galicia | 1.2a | 1980–1987 | 8.8a | 1987–2016 | −.5a | ||||
| Madrid | 1.2 | 1980–1999 | −.5 | 1999–2003 | 12.3 | 2003–2010 | −13.1a | 2010–2016 | 18.7a |
| Murcia | .3 | 1980–1998 | 2.9a | 1998–2016 | −2.3a | ||||
| Navarra | 1.1 | 1980–1992 | 4.5a | 1992–2016 | −.6 | ||||
| Basque Country | 1.9a | 1980–1990 | 8.5a | 1990–2016 | −.5a | ||||
| Rioja | −.3 | 1980–1990 | 5.3 | 1990–2016 | −2.3a | ||||
| Spain | .8a | 1980–1986 | 7.6a | 1986–2000 | .0 | 2000–2010 | −2.1a | 2010–2016 | .7 |
APC: annual percent change; AAPC: average annual percent change.
Suicide mortality trends in women per Autonomous Community (1980–2016).
| Women | |||||||||
|---|---|---|---|---|---|---|---|---|---|
| 1980–2016 | Trend 1 | Trend 2 | Trend 3 | Trend 4 | |||||
| Autonomous Community | AAPC | Period | APC | Period | APC | Period | APC | Period | APC |
| Andalusia | .3 | 1980–1986 | 9.4a | 1986–1992 | −4.3a | 1992–1997 | 2.7 | 1997–2016 | −1.7a |
| Aragon | 2.0a | 1980–1990 | 9.2a | 1990–2011 | −2.0a | 2011–2016 | 5.5 | ||
| Asturias | .3 | 1980–1991 | 4.5a | 1991–1999 | −7.4a | 1999–2016 | 1.3 | ||
| Balearic Islands | 2.7 | 1980–1990 | 8.8a | 1990–2001 | −5.5 | 2001–2016 | 5.0a | ||
| Canary Islands | −.7 | 1980–2016 | −.7 | ||||||
| Cantabria | −.3 | 1980–2016 | −.3 | ||||||
| Castilla y León | .5 | 1980–1984 | 14.9 | 1984–2016 | −1.2a | ||||
| Castilla-La Mancha | −1.2a | 1980–2016 | −1.2a | ||||||
| Catalonia | 3.7a | 1980–1984 | 46.9a | 1984–2002 | −1.0a | 2002–2006 | −11.1 | 2006–2016 | 4.2a |
| Valencian Community | −.1 | 1980–1992 | 3.5a | 1992–2016 | −1.9a | ||||
| Extremadura | −2.4a | 1980–2016 | −2.4a | ||||||
| Galicia | 1.2a | 1980–1987 | 8.8a | 1987–2016 | −.5a | ||||
| Madrid | 1.2 | 1980–1999 | −.5 | 1999–2003 | 12.3 | 2003–2010 | −13.1a | 2010–2016 | 18.7a |
| Murcia | .3 | 1980–1998 | 2.9a | 1998–2016 | −2.3 a | ||||
| Navarra | 1.1 | 1980–1992 | 4.5a | 1992–2016 | −.6 | ||||
| Basque Country | 1.9a | 1980–1990 | 8.5a | 1990–2016 | –.5a | ||||
| Rioja | −.3 | 1980–1990 | 5.3 | 1990–2016 | −2.3 a | ||||
| Spain | 1.0a | 1980–1986 | 8.8a | 1986–2004 | –1.0a | 2004–2010 | −3.4 | 2010–2016 | 4.5a |
APC: annual percent change; AAPC: average annual percent change.
Analysis by Autonomous Community shows that there are different trends in standardised rates over the entire period. In men, Aragon, the Balearic Islands, Catalonia, and the Basque Country show a significant increase, Extremadura a significant decrease (−.8%) and the rest of the Communities remain stable. In women, a significant increase is observed in Aragon, Catalonia, Galicia and the Basque Country, a significant decrease in Castilla-La Mancha and Extremadura.
The joinpoint analysis allows us to differentiate between Communities in which the rates remain stable throughout the study period for both men (Cantabria, Castilla-La Mancha) and women (the Canary Islands and Cantabria) and others with a continuous decrease (Extremadura for men and women, and Castilla-La Mancha for women). There is an initial period of increase in the rates for both men and women in almost all the Communities where changes in trend are observed. The most recent trends show divergences between the different Autonomous Communities. Thus, in men, Andalusia, the Canary Islands, Castilla-Leon, the Valencian Community, Galicia, Murcia, the Basque Country and La Rioja show significant downward trends while Catalonia and Madrid have significant increases (2007–2016: 2.4% and 2010–2016: 18.7%, respectively). Something similar is observed in women, for whom Andalusia, Castilla and Leon, the Community of Valencia, Galicia, Murcia, the Basque Country and La Rioja show downward trends while in the Balearic Islands, Catalonia and Madrid the trend is upward (2001–2016: 5.0%; 2006–2016: 4.2% and 2010–2016: 18.7%, respectively).
The comparability test indicates that the rates followed parallel trends (p<.05) according to sex in Andalusia, Aragon, Cantabria, Galicia, Madrid, Murcia, Navarra, the Basque Country, and La Rioja.
DiscussionIn the European Union (EU) (2015)23 10.9 suicides per 100,000 inhabitants were recorded. The lowest rates were in Turkey (2.2 deaths per 100,000 population) and Liechtenstein (2.5). In contrast, countries such as Lithuania and Slovenia had the highest rates (30.3 and 20.7 per 100,000, respectively). Our data places all the Autonomous Communities at figures below the EU average (17.8) for men, while for women La Rioja (4.9), Navarra (5.0), Asturias (5.9) and Galicia (6.3) they are slightly above (EU average: 4.8).
Our results, with higher suicide mortality rates in men (Tables 1 and 2) at national level and in all the Autonomous Communities are consistent with those of other studies that indicate a gender difference in suicide mortality.24 In 2016 the standardised rate ratio (male/female) in Spain was 3.2, which ranged from 2.1 in Navarra to 5.4 in Castilla-La Mancha.
Over the last decade, almost all countries in Europe have experienced marked increases in suicide mortality rates. Before the start of the economic recession (2007), suicide rates for men had fallen. However, this downward trend was reversed in 2008, when it increased by 9.5% and remained high until 2011.25 Over the period 2007–2011, suicide rates for men show 3 distinct trends: acceleration of the pre-existing upward trend (Poland), stability in rates (Austria) and reversal of downward trends (observed in most EU countries, although to varying degrees). Male suicides increased by over 15% in Greece, Ireland and Latvia, while in Bulgaria, France, Germany and Hungary the rate of increase was less than 3%.27 The rates of European women were unaffected and a relatively small increase (2.3%) was observed in U.S. women.28
In Spain, we observe that in women rates increased significantly in the period 2010–2016 (4.5%) while in men they remained stable (.7%, not significant). When analysing by Autonomous Community, the strong increase observed in Madrid (2010–2016: 18.7% in both sexes), the Balearic Islands (2001–2016: 5.0% in women) and Catalonia (2006–2016: 4.2% in women and 2007–2016; 2.4% in men) should be highlighted.
Our results in La Rioja (decrease in rates in both sexes since 1990) are in line with a previous study in which, on analysing the association between gross suicide rates and unemployment or poverty risk rates, no relationship was found (no change in trend was detected during the years affected by the 2008 crisis).15 The stable trend we observed in Navarra since 1992 coincides with that of a recent study which analyses the trend in suicide rates in Navarra (2000–2015).7
Since the approval of the General Health Law and the Report of the Ministerial Commission for Psychiatric Reform, there have been many political, legislative, conceptual and technical changes that affect the mental health of citizens which have been addressed differently in each Autonomous Community, generating rich diversity but also inequities.29
Thus, for example, in the absence of a plan, programme or strategy at national level for the prevention of suicide and the management of suicidal behaviour, experiences are limited to local30–34 or Autonomous Community35–38 initiatives.
Strengths and limitationsAlthough emphasis has been placed on the limitations of epidemiological findings based on mortality studies, these still represent a basic element for knowledge of the disease and its determinants. Thus, analysis of the temporal trend of suicide mortality is particularly important epidemiological information, as it can reveal risk factors inherent to the society and the environment in which people with suicidal ideation live. In fact, suicide rates are considered an indicator of the psychosocial well-being of the population and a criterion for evaluating the effectiveness of suicide prevention strategies.39
Why do some autonomous communities experience an increase in suicides and not others? These fluctuations could be an artifact, due to the small number of suicides in some communities (this is why the autonomous cities of Ceuta and Melilla have been excluded from our analyses) or due to the quality of the data. Since the 1980s, different mortality registers per Autonomous Region have been being implemented, which have introduced measures to improve the quality of death statistics.40,41 Part of the increase observed in Madrid, in both sexes (2010–2016: 18.7%), could be due to the fact that from 2013 the teams that code causes of death have access to the data of the Forensic Anatomical Institute of Madrid, which has allowed more precise classification of cause of death in deaths with judicial intervention.41 As a consequence, deaths designated as of ill-defined cause have been reassigned to specific external causes, and therefore this should be taken into account when interpreting the observed trend. Something similar may have happened in Catalonia,42 although the trend for women is more accentuated (2006–2016: 4.2%) than for men (2007–2016: 2.4%).
Despite this, the Joinpoint regression analysis (over a very long period of time) shows that the increases observed are significant deviations from previous trends, and therefore our results would reflect the interaction between possible risk factors (among them, mental illness),43 and possible measures for their control over time. Furthermore, this type of analysis can identify periods objectively. This avoids the need to pre-specify periods of time (which can bias the way in which trends are analysed) and makes it possible to describe the evolution of rates more thoroughly, as well as establish hypotheses about the temporal evolution of the changes described.
We know little about the determinants of the observed trends and therefore more studies are needed. A better understanding of these is essential to plan the most efficient possible intervention strategies to achieve the goal proposed by the World Health Organization of reducing suicide mortality.
FundingNone declared.
Conflict of interestsThe authors have no conflict of interests to declare.
Please cite this article as: Cayuela L, Pilo Uceda FJ, Sánchez Gayango A, Rodríguez-Domínguez S, Velasco Quiles AA, Cayuela A. Divergent trends in suicide mortality by Autonomous Community and sex (1980-2016). Rev Psiquiatr Salud Ment (Barc.). 2020;13:184–191.


