Population studies on social anxiety disorder (SAD) are relatively scarce and there is no previous reported evidence on prevalence or correlates of SAD in an Andalusian general population sample.
Material and methodsWe used a random representative sample previously identified via standard stratification procedures. Thus, a final sample of 4507 participants were included (response rate 83.7%). Interviewees were thoroughly assessed on sociodemographic, clinical and psychosocial factors, including: exposures to threatening life events (TLEs), childhood abuse, personality disorder and traits (neuroticism, impulsivity, paranoia), global functioning, physical health and toxics consumption. SAD diagnosis was ascertained using the Mini International Neuropsychiatric Interview. Both, pooled prevalences (with 95% confidence intervals) and risk correlates for SAD were estimated using binary logistic regression.
ResultsEstimated prevalence for SAD was 1.1% (95% CI=0.8-1.4). Having a SAD diagnosis was independently and significantly associated with younger age, poorer global functioning, higher neuroticism and paranoia personality traits, having suffered childhood abuse and exposure to previous TLEs. Furthermore, SAD was significantly associated with comorbid personality disorder, major depression, panic disorder and alcohol abuse.
ConclusionsAmong this large Andalusian population sample, the prevalence of SAD and its associated factors are relatively similar to previously reported international studies, although no population study had previously reported such a strong association with paranoia.
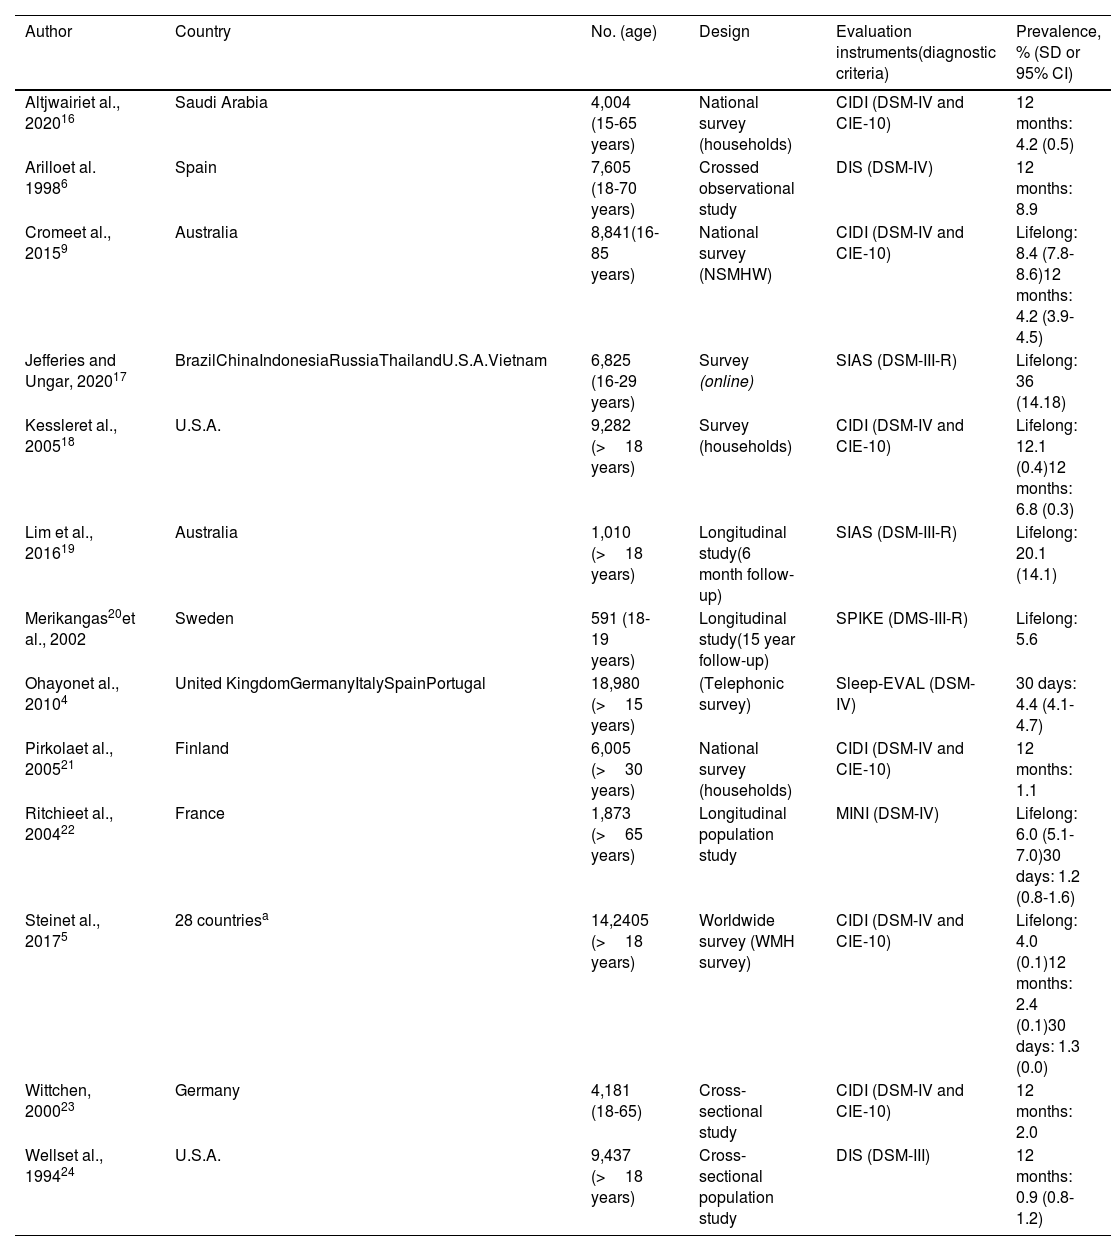
Social phobia, which is now denominated social anxiety disorder (SAD), is characterized by the presence of fear or intense anxiety in one or more social situations in which an individual may be exposed to examination by other people.1 The concept of SAD has changed considerably over the last 50 years, as it used to be a rare disorder that was included in the specific phobias. It is now one of the most common psychiatric diagnoses, and it is also one of those which are associated the most often with other mental illnesses.2. Furthermore, SAD has become more important in our society thanks to the rise of social networks and the increasing needs for success and the high impact caused by its symptoms in the social, academic and professional contexts.3 Few epidemiological studies of SAD have been performed in Spain, while more specifically none have been conducted in Andalusia. Moreover, the majority of works include samples from other countries4,5 and few papers centre exclusively on SAD.6–8Worldwide, the epidemiological data corresponding to SAD vary between studies due to the changes that have taken place in the diagnostic criteria used by classification manuals, the evaluative tools used and psychosocial and cultural differences9,10 (Table 1). The lifetime prevalence of social phobia is now estimated to stand at (% [SD]) 4.0% (0.1), at 2.4% (0.1) in the last 12 months and at 1.3% (0.0) in the last month.5
Prevalence figures of social phobia in epidemiological samples at worldwide level.
| Author | Country | No. (age) | Design | Evaluation instruments(diagnostic criteria) | Prevalence, % (SD or 95% CI) |
|---|---|---|---|---|---|
| Altjwairiet al., 202016 | Saudi Arabia | 4,004 (15-65 years) | National survey (households) | CIDI (DSM-IV and CIE-10) | 12 months: 4.2 (0.5) |
| Arilloet al. 19986 | Spain | 7,605 (18-70 years) | Crossed observational study | DIS (DSM-IV) | 12 months: 8.9 |
| Cromeet al., 20159 | Australia | 8,841(16-85 years) | National survey (NSMHW) | CIDI (DSM-IV and CIE-10) | Lifelong: 8.4 (7.8-8.6)12 months: 4.2 (3.9-4.5) |
| Jefferies and Ungar, 202017 | BrazilChinaIndonesiaRussiaThailandU.S.A.Vietnam | 6,825 (16-29 years) | Survey (online) | SIAS (DSM-III-R) | Lifelong: 36 (14.18) |
| Kessleret al., 200518 | U.S.A. | 9,282 (>18 years) | Survey (households) | CIDI (DSM-IV and CIE-10) | Lifelong: 12.1 (0.4)12 months: 6.8 (0.3) |
| Lim et al., 201619 | Australia | 1,010 (>18 years) | Longitudinal study(6 month follow-up) | SIAS (DSM-III-R) | Lifelong: 20.1 (14.1) |
| Merikangas20et al., 2002 | Sweden | 591 (18-19 years) | Longitudinal study(15 year follow-up) | SPIKE (DMS-III-R) | Lifelong: 5.6 |
| Ohayonet al., 20104 | United KingdomGermanyItalySpainPortugal | 18,980 (>15 years) | (Telephonic survey) | Sleep-EVAL (DSM-IV) | 30 days: 4.4 (4.1-4.7) |
| Pirkolaet al., 200521 | Finland | 6,005 (>30 years) | National survey (households) | CIDI (DSM-IV and CIE-10) | 12 months: 1.1 |
| Ritchieet al., 200422 | France | 1,873 (>65 years) | Longitudinal population study | MINI (DSM-IV) | Lifelong: 6.0 (5.1-7.0)30 days: 1.2 (0.8-1.6) |
| Steinet al., 20175 | 28 countriesa | 14,2405 (>18 years) | Worldwide survey (WMH survey) | CIDI (DSM-IV and CIE-10) | Lifelong: 4.0 (0.1)12 months: 2.4 (0.1)30 days: 1.3 (0.0) |
| Wittchen, 200023 | Germany | 4,181 (18-65) | Cross-sectional study | CIDI (DSM-IV and CIE-10) | 12 months: 2.0 |
| Wellset al., 199424 | U.S.A. | 9,437 (>18 years) | Cross-sectional population study | DIS (DSM-III) | 12 months: 0.9 (0.8-1.2) |
CIDI: Composite International Diagnostic Interview; CIE-10: Clasificación Internacional de Enfermedades décima edición; DIS: Diagnostic Interview Schedule; DSM-III-R: Diagnostic and Statistical Manual third edition revised; DSM-IV: Diagnostic and Statistical Manual fourth edition; MINI: Mini-International Neuropsychiatric Interview; NSMHW: National Survey of Mental Health and Wellbeing; SIAS: Social Interaction Anxiety Scale; SPIKE: Structured Psychopathological Interview and Rating of the Social Consequences of Psychic Disturbances for Epidemiology; WMH: World Mental Health.
The different risk factors associated with SAD include sociodemographic factors such as female sex, adolescence, high per capita income,5 a history of traumatic events during childhood,11 few social skills, alterations in social cognition and absenteeism from school.12 Up to 70%-80% of patients with SAD have other comorbid mental disorders, especially depression, psychotic disorders and substance abuse.13,14
We set the following objectives within the framework of the PISMA-ep15 study, which aims to establish the epidemiology of mental disorders in Andalusia: a) to estimate the prevalence of SAD within the Andalusian population; b) to identify possible risk factors associated with the said disorder, so that targets for preventive intervention could be identified.
MethodologySample design and characteristicsA cross-sectional study was undertaken of a broad, representative and stratified sample of the adult population (from 18 to 75 years old) who live in the Andalusian Community. A company which specializes in health surveys undertook data gathering in respondents’ homes. All of the interviewers attended a one-week training course given by the head researchers (JC), and they showed that they had sufficient knowledge of interview techniques and filling out scales and questionnaires. The teaching techniques included talks, role-playing between interviewers and scoring video recordings of interviews undertaken by experts and volunteers. Sampling took place by using different levels of successive stratification: a) proportional stratification between 2 geographical areas, the east and west of Andalucía; b) stratification according to population density in the cities in each one of both geographical areas; c) stratification based on the population in each one of the 8 Andalusian provinces; d) simple randomization methodology was used within each province to select from one to 5 municipalities in each type of location (urban, intermediate and rural). Finally, the final sampling areas were selected by using the same simple random assignation method while taking into account age and sex quotas, census sections and the districts within each locality. The final sampling units were therefore individuals of both sexes aged from 18 to 75 years old who were interviewed after selecting one of every 4 consecutive homes within the predetermined street routes in the districts and census sections previously selected at random. The necessary sample size was calculated by estimating a 2% prevalence of mental disorders with an exactitude of ±0.5%, with confidence intervals of 95% (CI 95%) and for an estimated effect size of 1.5.
Evaluation of social anxiety disorderSAD was diagnosed using the Spanish version25 of the MINI international neuropsychiatric interview.26 This is a short structured diagnostic interview (of questions with Yes(No answers) on Axis I psychiatric disorders compatible with the Diagnostic and Statistical Manual of Mental Disorders, 4th Edition (DSM-IV)27 and the tenth edition of the International Classification of Diseases (CIE-10).28 The MINI is divided into 16 modules that are identified by letters, each one of which corresponds to diagnostic category. The MINI interview was administered during the PISMA-ep study in the way originally described by the authors as valid, that is, in order. More specifically, it started with section A (major depressive episode) and ending in P (antisocial personality disorder). Nevertheless, to undertake this work the SAD module was specifically included, corresponding to section G and its corresponding items (Figure 1). This diagnosis is classified as current SAD, and the questions refer to the last month. If the answer is No, the diagnosis of SAD is ruled out. If the answer is Yes, the respondent has to answer three more questions to confirm the diagnosis. To select the patient as a possible case, they have to answer Yes to all four questions. The MINI interview has been used in many different cultures,29–31 and it has display satisfactory psychometric properties in each language, with kappa values that are in concordance with other interviews such as the Composite International Diagnostic Interview (CIDI)32 or the Structured Clinical Interview for DSM-IV Disorders, Patient Edition (SCI)33, which in the majority of cases are above the value of 0.7. Its inter-evaluator reliability has also been shown to be high, with a correct level of sensitivity and a low rate of false positives when it is used, as it was in this study, in a healthy population living within the community.
Diagnosis of social phobia using module G of the MINI international neuropsychiatric interview.25
Sociodemographic data were gathered in a way that permits the application of the Spanish version35 of Barona's formula.34 This formula uses the sociodemographic variables of age, sex, educational level, degree of urbanicity and geographical region to estimate respondents’ intelligence quotient.
Psychosocial factorsThe level of personal and social functioning was calculated using the Personal and Social Performance Scale (PSP).36 Data on 3 types of abuse that respondents may have suffered during their infancy were gathered and evaluated using the abbreviated version of the Childhood Trauma Questionnaire:37 physical, psychological or sexual abuse. A validated inventory38 was used to measure stressful events in life, including a subgroup of 12 categories of the same which had occurred in the previous 6 months. Screening took place for personality disorder diagnosis using the Standardised Assessment of Personality Abbreviated Scale (SAPAS),39 translated into Spanish and validated by our group.40 The traits of neuroticism and paranoia were assessed using the Zuckerman-Kuhlman41 questionnaire and the Spanish version valeted by our group42 of Green's paranoid thoughts scale (GPTS),43 respectively.
Clinical factorsSpanish versions of the General Screening Questions were used to identify a family history of psychiatric disorders, together with the family interview symptoms checklist for genetic studies.44 Alcohol and tobacco consumption were recorded using the CAGE45 questionnaire and Fagerstrom's test,46 respectively. General state of health was evaluated using the SF-1247 questionnaire.
Response rateIn total, 70.8% of the households selected at first did not respond after 4 attempts or lacked respondents within the age and sex quotas of the study, so that they had to be replaced by the next available household on the predetermined route. A total of 5,496 households were therefore finally contacted for this study, of which 4,507 completed the interview (a response rate of 83.7%) (Figure 2).
Data qualityRates of error in data input were far lower than 1% in the 8 Andalusian provinces. Detailed information on the methodology and protocol of the PISMA-ep study have been published in the scientific literature.15
Statistical analysisStudy of the data commenced by calculating the prevalence of SAD, using a 95% CI. Descriptive analysis of the independent variables included calculations of frequency, percentage, average and standard deviation.
The association between SAD and the other selected independent variables was calculated using the Chi-squared test (2 tails) and the Student t-test, depending on data distribution. To finish, a multivariable regression model was used with a logistic regression technique in which all of the variables that had been found to be significant in the bivariate analysis were included once (the “enter” method). The level of statistical significance for all of the analyses was set at lower than 0.05. Data were stored and processed using version 26 of the Statistical Package for the Social Sciences (SPSS).
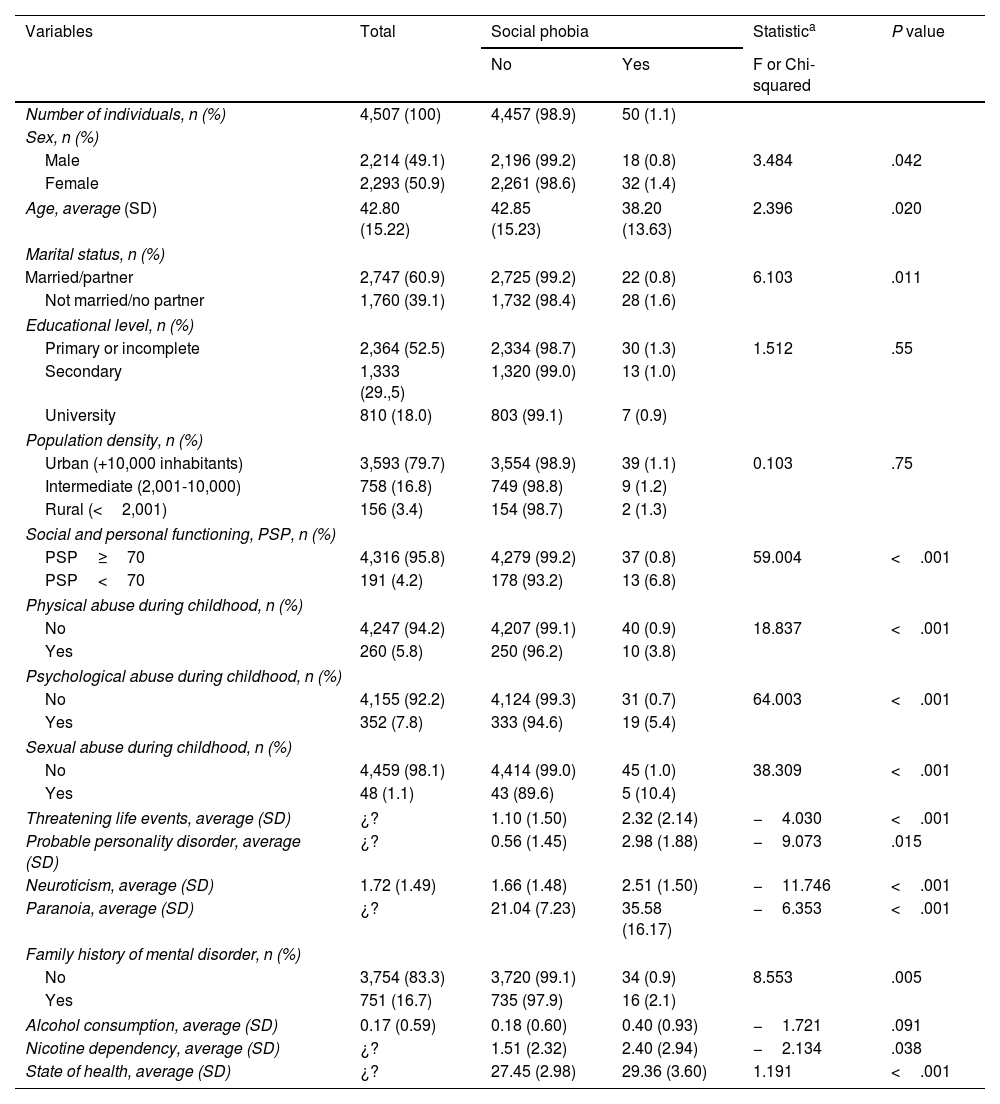
ResultsCharacteristics of the sample and prevalence of social anxiety disorderThe study response rate was 83.7%, as 4507 of the 5496 who were invited completed the study (n=4507). The monthly prevalence of SAD in our population sample was 1.1% (95% CI: 0.8-1.4). Table 2 shows the prevalence of SAD for each one of the main sociodemographic and clinical variables together with its corresponding bivariate analysis. To summarise, the prevalence of SAD was significantly higher (Chi-squared; P=.042) in women (1.4%) than it was in men (0.8%), in younger subjects (Student t; P=.020), in respondents who were neither married nor living together vs. those who were married (1.6 vs. 0.8%; Chi-squared; P=.020), in those with poorer social and personal functioning as determined by score lower than 70 on the PSP scale (6.8% vs. 0.8%; Chi-squared; P<.001), in subjects who had suffered childhood abuse (Chi-squared; P<.001) that was physical (3.8% vs. 0,9%), psychological (5.4% vs. 0.7%) or sexual (10.4% vs. 1.0%) or who had suffered stressful event in the previous six months (Student t; P<.001). Higher levels of SAD prevalence were also found in connection with clinical variables such as having a probable personality disorder (Student t; P=.015) or paranoia (Student t; P<.001) and health variables such as nicotine dependency (Student t; P=.038) and personal state of health (Student t; P<.001).
Sample characteristics and bivariate association with SAD.
| Variables | Total | Social phobia | Statistica | P value | |
|---|---|---|---|---|---|
| No | Yes | F or Chi-squared | |||
| Number of individuals, n (%) | 4,507 (100) | 4,457 (98.9) | 50 (1.1) | ||
| Sex, n (%) | |||||
| Male | 2,214 (49.1) | 2,196 (99.2) | 18 (0.8) | 3.484 | .042 |
| Female | 2,293 (50.9) | 2,261 (98.6) | 32 (1.4) | ||
| Age, average (SD) | 42.80 (15.22) | 42.85 (15.23) | 38.20 (13.63) | 2.396 | .020 |
| Marital status, n (%) | |||||
| Married/partner | 2,747 (60.9) | 2,725 (99.2) | 22 (0.8) | 6.103 | .011 |
| Not married/no partner | 1,760 (39.1) | 1,732 (98.4) | 28 (1.6) | ||
| Educational level, n (%) | |||||
| Primary or incomplete | 2,364 (52.5) | 2,334 (98.7) | 30 (1.3) | 1.512 | .55 |
| Secondary | 1,333 (29.,5) | 1,320 (99.0) | 13 (1.0) | ||
| University | 810 (18.0) | 803 (99.1) | 7 (0.9) | ||
| Population density, n (%) | |||||
| Urban (+10,000 inhabitants) | 3,593 (79.7) | 3,554 (98.9) | 39 (1.1) | 0.103 | .75 |
| Intermediate (2,001-10,000) | 758 (16.8) | 749 (98.8) | 9 (1.2) | ||
| Rural (<2,001) | 156 (3.4) | 154 (98.7) | 2 (1.3) | ||
| Social and personal functioning, PSP, n (%) | |||||
| PSP≥70 | 4,316 (95.8) | 4,279 (99.2) | 37 (0.8) | 59.004 | <.001 |
| PSP<70 | 191 (4.2) | 178 (93.2) | 13 (6.8) | ||
| Physical abuse during childhood, n (%) | |||||
| No | 4,247 (94.2) | 4,207 (99.1) | 40 (0.9) | 18.837 | <.001 |
| Yes | 260 (5.8) | 250 (96.2) | 10 (3.8) | ||
| Psychological abuse during childhood, n (%) | |||||
| No | 4,155 (92.2) | 4,124 (99.3) | 31 (0.7) | 64.003 | <.001 |
| Yes | 352 (7.8) | 333 (94.6) | 19 (5.4) | ||
| Sexual abuse during childhood, n (%) | |||||
| No | 4,459 (98.1) | 4,414 (99.0) | 45 (1.0) | 38.309 | <.001 |
| Yes | 48 (1.1) | 43 (89.6) | 5 (10.4) | ||
| Threatening life events, average (SD) | ¿? | 1.10 (1.50) | 2.32 (2.14) | −4.030 | <.001 |
| Probable personality disorder, average (SD) | ¿? | 0.56 (1.45) | 2.98 (1.88) | −9.073 | .015 |
| Neuroticism, average (SD) | 1.72 (1.49) | 1.66 (1.48) | 2.51 (1.50) | −11.746 | <.001 |
| Paranoia, average (SD) | ¿? | 21.04 (7.23) | 35.58 (16.17) | −6.353 | <.001 |
| Family history of mental disorder, n (%) | |||||
| No | 3,754 (83.3) | 3,720 (99.1) | 34 (0.9) | 8.553 | .005 |
| Yes | 751 (16.7) | 735 (97.9) | 16 (2.1) | ||
| Alcohol consumption, average (SD) | 0.17 (0.59) | 0.18 (0.60) | 0.40 (0.93) | −1.721 | .091 |
| Nicotine dependency, average (SD) | ¿? | 1.51 (2.32) | 2.40 (2.94) | −2.134 | .038 |
| State of health, average (SD) | ¿? | 27.45 (2.98) | 29.36 (3.60) | 1.191 | <.001 |
PSP: Personal and Social Performance; SAD: all of the affirmative replies in module G of the MINI interview.
A multivariate model was developed for association with SAD based on 2 demographic risk variables (female sex [OR=1.134; 95% CI=1.6-2.1; P=.697] and a younger age [OR=0.974; 95% CI=0.98-0.99; P=.019]), 3 psychosocial variables (a lower level of independence [OR=0.702; 95% CI=0.5-0.9; P=.024], having suffered abuse during childhood [OR=2.441; 95% CI=1.3-4.7; P=.007] or having suffered threatening life events in the previous 6 months [OR=2.424; 95% CI=1.0-5.6; P=.04]) and 3 clinical variables (probable personality disorder [OR=2.736; 95% CI=1.0-5.6; P=.005], a higher level of neuroticism [OR=1.492; 95% CI=1.2-1.8; P<.001] and a higher score for paranoia [OR=1.042; 95% CI=1.0-1.1; P<.001]). Figure 3 shows the findings of multivariate analysis with the odds ratios and the CI for each one of the model variables, as well as its statistical significance. Lastly, we also explored a multivariate model to study the association between SAD and the other psychiatric disorders assessed by the MINI. SAD was thereby found to be associated as a comorbidity independently of age and sex with major depression (OR=11.322; 95% CI=5.9-21.8; P<.001), panic disorder (OR=3.962; 95% CI=1.7-9.2; P=.001) and alcohol abuse (OR=4.097; 95% CI=1.4-12.1; P=.011) (Figure 4).
To the best of our knowledge this work is the first to cover the detection of the prevalence of SAD and associated factors in the general Spanish population (Andalusia). This study detected a current prevalence of SAD (in the last month) of 1.1% (95% CI=0.8-1.4) and a set of associated clinical, demographic and psychosocial factors.
In general, our results are congruent with prevalence findings by the majority of previous studies, even taking into account the fact that most of the differences may be due to the use of different samples, assessment tools, diagnostic criteria and types of prevalence (at a point vs. lifetime) using (Table 1). Our results are also concordant with those of the WHO mental health survey in 28 countries (n=142,405), which showed a prevalence of SAD over the previous 30 days of 1.3%. On the other hand, concordance has been shown to exist between the CIDI interview, which was used in this survey, and the MINI interview, which was used in our study,48 and both studies use DSM-IV27 diagnostic criteria.
Our multivariate study found an association which had not been previously reported between paranoia and SAD. In line with this, the results of a recently published meta-analysis showed levels of SAD prevalence in patients with psychosis of from 8% to 36%.13 These results may have a certain degree of clinical implication. It could be useful to evaluate the symptoms of paranoia when implementing psychosocial interventions and/or to prevent the development of a SAD, given that it is possible that both disorders share certain neuropsychological profiles (negative evaluation and loss of control) as well as behavioural inhibition.49 As well as paranoia, in agreement with other authors4,16 we also found that SAD is associated with other disorders such as depression, panic disorder and alcoholism (Fig. 4). SAD was significantly more common in females, and this agrees with other epidemiological studies.5,9,16 However, multivariate analysis found no higher risk of SAD in females, and this was probably because the other variables included in the model (such as abuse, stressful events in life and personality disorder), may be significantly associated with females, thereby attenuating its effect and showing that sex may be considered to be a confusion factor in this model. Our results also show that a younger age is a risk factor associated with SAD (Fig. 2). In this way we repeated the findings of previous studies such as an epidemiological study with a broad sample of subjects (n=18,980) in the United Kingdom, Germany, Italy, Spain and Portugal. This study shows a significantly higher prevalence of SAD (% [95% CI]) in the following age groups: under the age of 25 years (6.8% [5.9-7.6]), from 25 to 34 years (5.4% [4.6-6.1]), from 35 to 44 years (4.5% [3.8-5.2]) and from 45 to 54 years (4.0% [3.3-4.8]), respecting those over the age of 65 years (2.3% [1.8-2.8]).4 These authors associate the early onset of SAD with a higher risk of suffering other disorders involving anxiety and depression. Furthermore, the excess SAD among younger subjects may be due to subject and sociological factors such as the influence of social networks.3 On the other hand, we also found higher rates of SAD among subjects who were neither married nor had a partner. This finding agrees with those of other authors,5,9,21 and once again it underlines the close relationship between the lack of stable ties and the presence of SAD. It was also shown how the experience of abuse in childhood seriously hinders social skills in adulthood,50 together with a higher risk of SAD.11 According to our results, traumatic experiences during infancy may be considered to add to the risk of suffering SAD, and more recent social adversity in adult age may also lead to a significantly higher risk of SAD (Fig. 2). In general, social adversity seems to be a trigger of higher risk for a mental disorder in general, and this clearly includes SAD.51
The main limitation of our study is its cross-sectional design, as this prevents establishing a causal relationship between the diagnosis of SAD and the risk variables found, so that preventive recommendations based on our model would be of restricted usefulness. Nevertheless, this study also has strengths such as its large sample (n=4,507) that is representative of the general population, and the detailed study of a broad range of elements involving risk and comorbidity when the possible variables associated with SAD are explored.
ConclusionsThe prevalence of SAD in Andalusia amounts to 1.1%, which is similar to the levels reported in other international studies. The chief risk factors associated with SAD are a younger age, social adversity and the presence of high levels of paranoia. Follow-up studies are required in young ages to better identify the risks associated with SAD and to design tools for prevention and treatment.
FinancingThis work was financed, without any economic benefit whatsoever for any of the authors, by the following public grants from the Consejería de Innovación (Proyectos de Excelencia No. 10-CTS-6682) and by the Ministry for Science and Innovation ISCIII (Proyecto # ISCIII PI18/00467) and ISCIII, Proyectos de Investigación en Salud (Ref. PI18/00467) FESDR/Junta de Andalucía-Consejería de Economía y Conocimiento/ Proyecto B-CTS-361-UGR18.
Open access financing was by Granada University / CBUA.
Conflict of interestsThe authors have no conflict of interests to declare.


