The main goal of this investigation is to study the relationships between society and audit in Portugal, through a methodology based on a questionnaire sent in 2015 to public companies listed in the stock exchange and insurance companies, as well as to financial analysts. For this purpose, a group of 25 questions addressing audit main issues was developed. A five-point Likert scale, followed by an appropriate statistical treatment – percentage, p-value, correlations of Spearman, test of Mann–Whitney, allowed us to discover correlations and statistical associations of strong and moderate intensity. The results suggest that audited financial statements users’ perception regarding the auditors’ independence, the audit report, the audit market, the going concern assumption and the search and disclosure of fraud and illegal acts committed by companies are aligned with the international tendencies.
Audit does not operate separately. In fact, it is not only linked with the economic system, subject accountability rules, but also with the social, political and ethical system as well as with non-human elements of the global involvement, such as the cultural values, that being influenced by economic, political, legal, educational and religious system, affect the values of the profession and consequently the accountability system. The degrees of economic development and technology are correlated with the degree of complexity of the accountability system (Ikabal, 2002). In fact, the degree of property power concentration imposes specific needs of financial information disclosure. The concentration of power in pensions funds tends to impose a larger emphasis on the future and on the analysis and administration of business risk (Giroux & Cassell, 2011). The financing sources from banks or stock exchange impose specific rules of financial reporting. A political system and a stable economy improve the development of a more transparent accountability system (Ikabal, 2002).
Society, conceived in a systemic way, includes the existence of a wide and complex web of relationships that, in the context of markets globalization, have quickly expanded without a regulator structure capable of monitoring and regulating its development. So the need to develop a civil society becomes urgent. In fact, global companies increase the gap between rich and poor countries, destroying the environment and, in some cases, supporting totalitarian regimes, placing a threat to the existence of a civil society (Annisette & Trivedi, 2013).
The market economy develops accountability that leads to the emergence of quasi government agencies (PCAOB, 2006) with the goal to monitor and control the economy and the audit functions. In today's society the investors and the public in general request a more trustful financial and non-financial information as a logical input of the decision making process. A regulated economy needs a structure for the development of the relationships among: responsibilities, transparency, productivity, efficiency and economy. The development of the economic sector includes negotiation and work to synthesize the differences and to increase a larger interaction between the private interest and the public welfare (Louwers, Ramsay, Sinason, & Strawser, 2013; Whittington & Pany, 2010).
Having contextualized the problem, and defined the objective in the summary, it can be stated that this study is unique in Portugal and, at an international level, can be differentiated from other studies (Arens, Elder, & Beasley, 2010; Chu, Xingqiang, & Jiang, 2011; Kaplan & Williams, 2013; Kausar & Taffler, 2004; Lajili & Zéghal, 2005; Mills & Bettner, 1992; Mutchler, 1984; Newman, Patterson, & Smith, 2005; Wright & Capps, 2012) that research the problem of this study through a reductionist and Cartesian approach, centering on very specific themes and users. The study carried out demonstrates in a systematic and integrative way – through 25 questions – the role of auditing in society, and seeks to obtain correlations between the questions analyzed, a perspective that is absent from the aforementioned studies.
In the following section, a review of the literature on the subject is undertaken. In the third part, the methodology is explained. In the fourth section, the results are analyzed, whilst in the fifth, the results are discussed. Finally, conclusions are put forward, limitations of the study are discussed and suggestions for further research proposed.
2Literature reviewThe Green Paper (European Commission, 2010) guides the auditor's function in direction of companies going concern problems and in the investigation of frauds and illegal acts, based on the assumption that the development of the European common market should be based on the transparency of the financial information disclosed by companies, which is considered essential to consolidate the well-being and the competitiveness of the European Union (Hergaty, 1997). As the financial information is used for a wide group of economic-social decisions it is considered as a public welfare, raising the need for regulators to parameterize the annual reports information (Newman et al., 2005).
In fact, the combination of globalization, technology and institutional investors’ growing paper changed the relationships among companies, markets and the way that financial information is disclosed: a smaller trust is granted to the traditional financial reports, which are put in second place in relation to the introduction and analysis of the risk in administration reports (Lajili & Zéghal, 2005). This situation induces an increase of regulation confining the auditors’ activity (PCAOB, 2006; SOX, 2002) as proposed by Porter (1997). Initially, audit was interpreted as a group of techniques of analysis and investigation, in which the users were considered an exogenous variable. However, being considered a social phenomenon (Flint, 1988), and inserted in the accountability relationships (Flint, 1988; Gray, Owen, & Adams, 1996), it assumes a social dimension since it affects human behavior and economic involvement. In this context, the social concept of audit is adaptable and its operational interpretation depends not only on the ethical values, but also on the value of judgments made by society in relation to aspects to which the accountability rules should be applied.
According to Flint (1988), the audit function should embrace information beyond the accounting dimension, involving aspects related with value for money, that is to say, the economy, the efficiency and the effectiveness of organizations. Audit is based on a social need, involving an interaction among auditors, audit organisms and other social groups, so that audit function should adapt to society values. The audit value inside the accountability process transcends the compliance audit, embracing the analysis of how management handles the resources with efficient and effectiveness (Lee, 1996; Sherer & Kent, 1983; Tincker, 1982). This audit role is criticized by Mills and Bettner (1992) who argue that the audit process, and the supporting standards that support it, are destined to mask the existent social conflicts, even suggesting that audit is a mere ritual to maintain the social order and to legitimate the auditor's action (Mills & Bettner, 1992) being so stigmatized by supporting the ideology of the capitalism (Portwood & Fielding, 1981). Together with these general investigations that discuss the paper of audit in today's society, more specific analyses are being developed centered on more partial aspects of the global problem that is the relationships between audit and society, such as: the size of the audit companies and their independence, the perception that the society has of the audit report, the enlargement of the audit function for the evaluation of the going concern assumption and the continuous pressing and present search of illegal acts, frauds and corruption and, finally, the understanding, for the society, of the proper characteristics and attributes of an audit.
In result of great financial scandals (Enron, Worldcom and Tyco, etc.), the investigation was centered on auditor's independence as a main and inherent theme to the proper foundations of audit (Intosai, 2009; Sawalga & Qtish, 2012; Stewart & Subramanian, 2009; Wright & Capps, 2012). Auditors and organization have demonstrated that the lack of the auditor's independence is already perceived by the public, and that there is a relationship between independence and the supply of audit services, suggesting that, in the small audit companies, the independence can be influenced by clients weight, as stated by Kaplan and Williams (2013) and Chu et al. (2011).
Regarding society perceptions on the audit report, several authors (Chanruang & Ussahawanitchakit, 2011; Pongpanpattana & Ussahawanitchakit, 2012; Pongsatitpat & Ussahawanitchakit, 2012) underline its importance in the communication of the auditor's convictions This is also assumed by Arens et al. (2010) who state that financial information users consider the audit report as an element that provides safety to the financial statements. However, Asare and Wright (2012) point out the existence of a gap between auditors and users. In the same direction, Gold, Gronewold, and Pott (2012) refer the existence of a deep expectation gap between auditors and financial statements users related with management responsibilities as well as to the nature, objectives and audit procedures, considering that the financial statements users give more responsibilities to the auditors than the auditors give to themselves. The most recent international investigations on this theme criticize the current form of the audit report (Asare & Wright, 2012; Bell & Mcallister, 2011; Carcello, 2012; Ciesielski & Weirich, 2012; PCAOB, 2006), suggesting that it should be modified.
Regarding the going concern problem, Ittonen (2011), Herbohn, Ragunathan, and Garsden (2007), Kausar and Taffler (2004), Menon and Williams (2010), and Mutchler (1984) suggest that audit plays a fundamental role in the communication process between the company and the financial statements users, accentuating the fact that the public considers the auditor as warranty of the continuity of a company, nevertheless auditors have always shown reluctant to mention this problematic issue.
Investigations on the auditor's duties regarding the discovery and the disclosure of illegal acts and frauds (Davidson, 1975; Fraser & Lin, 2004; Gullkvist & Jokipii, 2013; Rezaee, 2005) state that auditors must discover and disclose managers’ flaws in the compliance of laws and regulations. Regarding this subject, Dellaportas (2013) checks auditors’ reluctance in enlarging their responsibilities to the detection of illegal acts, while Knox (1994) points out the detection of frauds as an element of auditors’ social responsibilities, being contradicted by Hemraj (2001) who points out that the auditor's function should bind to the verification and not to the detection.
3MethodologyThe essential purpose of this work is to study the relationships between society and audit. For this purpose, a questionnaire was developed and sent to: financial analysts, public companies listed on the stock exchange and insurance companies operating in Portugal. The questionnaire was addressed to the CFO through the public relations office. The goal is to know their expectations regarding audit work, analyzing if it could be expanded, or if, on the other hand, they correspond to expectations that are impossible to reach or satisfy. This research is based on the international literature, especially on the following authors: Kaplan and Williams (2013) and Chu et al. (2011), who have researched the relation between audit independence and size of audit clients and of audit firms; Arens et al. (2010) and Messier, Glover, and Prawitt (2012), whose investigations points out to a wider function of audit; according to their investigations, audit cannot only be seen as having a financial function but also a social dimension; Ittonen (2011), Menon and Williams (2010), Kausar and Taffler (2004), who have studied the stakeholders’ expectations regarding the going concern assumption; and Gullkvist and Jokipii (2013) and Dellaportas (2013), who empathize the need for a greater commitment of auditors in the search and denouncement of illegal acts and frauds pertained to companies.
The choice of this study population was based on the importance that the audit reports have in these companies’ financial statements validation. Public companies due to tighter legislation, more public scrutiny, media exposure and capital diversification have to present audited financial statements, and implement in their control structure audit committees that enforce audit as an instrument of control. Insurance companies insure the risks of most companies by making large financial investments of their resources and by providing collateral to companies; in this sense, they also need a good quality information base to support their investment decisions.
Financial analysts often issue opinions on public companies and therefore they need to support those opinions on reliable, transparent and valid information, verified by the auditors.
The questionnaires contained six groups of questions, as follows:
- 1.
Audit companies size and independence
- 1.1
In your opinion, does the size of the audit company affect the impartiality that the auditor should have?
- 1.2
Are the small audit companies more susceptible of being influenced by the weight of its customers, in terms of revenues?
- 1.3
Does the profession oligopoly based in big audit companies inhibit a free and open competition?
- 1.1
- 2.
The audit report
- 2.1
Do investors give the audit report a significant weight in the decision making process?
- 2.2
Is the audit report an important tool when making an investment decision?
- 2.3
Do you consider that the audit report fully expresses the auditor's work?
- 2.4
Is the audit report, without a qualified opinion, an absolute certainty that the financial statements are correct?
- 2.5
Is the language used to express the auditor's report clear and visible to all the financial statements users?
- 2.6
Is the audit report, strictly in a finance perspective, satisfactory to investors?
- 2.7
Should the audit report analyze, besides historical information, prospective information?
- 2.8
A qualified report that raises questions related with going concern problems is a reason for an auditor change?
- 2.1
- 3.
Society and audit
- 3.1
Considering the many financial scandals that lead to suspicions of audit flaws, do you think that the auditors don’t respect the “social contract” related to the protection of the public interest?
- 3.2
Confronting the critics from the society, have suitable reforms in the audit area been made to surpass them?
- 3.3
Is the audit regulation made by professionals preferable to the regulation imposed by supervision organisms?
- 3.4
Do you think that it is inherent to audit, in general, a spirit of public service?
- 3.5
A structure of more effective corporate governance and the establishment of audit and supervision committees are fundamental instruments to reduce the difference of expectations in audit?
- 3.6
Does the society, in general, and the finance markets in particular, feel that audit stabilizes the financial and economic relationships established in today's society?
- 3.1
- 4.
Audit and going concern
- 4.1
An audit report that doesn’t raise any doubt about the going concern can be read as a guarantee that the company will continue indefinitely?
- 4.2
Do you think that when an auditor shows doubts about the going concern his opinion can precipitate the company failure?
- 4.3
When the failure of a company occurs, do you think that the auditor didn’t do his work correctly?
- 4.1
- 5.
Audit, illegal acts and frauds
- 5.1
Do you think that the auditor should have an active role in the detection of illegal acts?
- 5.2
Should the auditor seek actively for fraud indicators?
- 5.1
- 6.
Perception of the characteristics of an audit
- 6.1
Does the responsibility for the preparation of the financial statements reside with management as well as with auditors?
- 6.2
When auditing the financial statements do the auditors analyze all the transactions?
- 6.3
Should the auditor's approach to the so-called social responsibility of the company be more reinforced than the merely financial audit?
- 6.1
The answer to each of the items related to the mentioned problems is given in a five-point Likert scale, where 1 corresponds to Strongly Disagree and 5 corresponds to Strongly Agree, and an answer with punctuation 3 corresponds to Indifference.
With the intention of differentiating the answers given by the respondents, companies (n=25) and financial analysts (n=51) were considered, and their preferences to the given questions were registered.
It is intended to determine the answers to the following questions:
Q1: What are the items that get the largest concordance/discordance by each one of the groups?
We intend to obtain the answer to this subject in relation to:
Q1.1: Size and independence of the audit companies.
Q1.2: The audit report.
Q1.3: The society and audit.
Q1.4: The audit and going concern.
Q1.5: The audit, illegal acts and frauds.
Q1.6: The perception of the characteristics proper to audit.
On the other hand, in order to compare the opinion of both professional groups in relation to the given questions, we intend to address the following subject:
Q2. The opinion of the financial analysts and of the companies in relation to the auditor's work shows significant differences.
These differences will be analyzed considering the following six different items:
Q2.1: Size and independence of the audit companies.
Q2.2: Audit report.
Q2.3: Society and audit.
Q2.4: Audit and going concern.
Q2.5: Audit, illegal acts and frauds.
Q2.6: Perception of the characteristics proper to the audit.
Finally, to determine the independence among the answers, relatively to each group of questions related to the two considered groups, we tried to answer the following questions:
Q3: There are evident relationships among the answers given to the questions about the size of the audit companies and the independence of the companies.
Q4: The answers to the questions regarding the audit report are correlated only when the financial analysts’ answers are taken into consideration.
Q5: The answers to the subjects related with the audit report are correlated only when the answers of the companies are taken into consideration.
Q6: The financial analysts show evident relationships among the answers to the questions on society and audit.
Q7: The companies show evident relationships among the answers to the questions on society and audit.
Q8: The answers to the questions about autonomy and going concern are mutually linked when the answers given by the financial analysts are analyzed.
Q9: The answers to the subjects about autonomy and going concern are mutually linked when the answers given by the companies are analyzed.
Q10: There are relationships among the answers to the questions regarding the audit, illegal acts and frauds, when the financial analysts’ answers are considered.
Q11: There are relationships among the answers to the questions regarding the audit, illegal acts and frauds, when the answers of the companies are considered.
Q12. The answers to the questions related with the perception of the characteristics of the audit reveal associations to each other when the financial analysts’ answers are considered.
Q13. The answers to the questions related to the perception of the characteristics of the audit reveal associations to each other when the answers of the companies are considered.
The representativeness of the sample is assured to the extent that all companies responded (100%) and of the eighteen insurance companies identified in Portugal, we have obtained 5 answers (27.8%). From the 220 financial analysts that are members of the Portuguese Association of Financial Analysts, we received 51 answers, corresponding to 23.2%.
Of the 288 surveys sent to the target population, 76 were received and fully answered. Thus, our average response rate (TR) stands at 26.4%. Response rate is commonly interpreted as an index of the extent to which the study was carried out and also of the interest or relevance that the subject has for business management (Frohlich, 2002). In this way, we admit that the response rate of our study is acceptable, since it is above the recommended minimum in the methodology of Malhotra and Grover (1998), which is 23%. Through the survey, information was collected in a clear and concise manner, taking into account that the presentation and the brevity of its completion are determinant factors to obtain a higher TR (Yammarino, Skinner, & Childers, 1991). Taking into account the different levels of knowledge present, we designed two subpopulations: first, the public companies and insurers and, second, the financial analysts.
In the survey, the first block of questions is of general nature, seeking to know certain factual characteristics, especially of financial analysts. The second block of questions is divided into 25 questions aimed at detecting perceptions, which synthesize several aspects related to: the audit companies’ size and independence; the audit report; society and audit; audit and the going concern assumption; audit, illegal acts and frauds; and perceptions of the characteristics of an audit.
The sample was selected among financial analysts, companies quoted on the stock exchange (Psi–Geral) and insurance companies, and it was constructed during 2015.
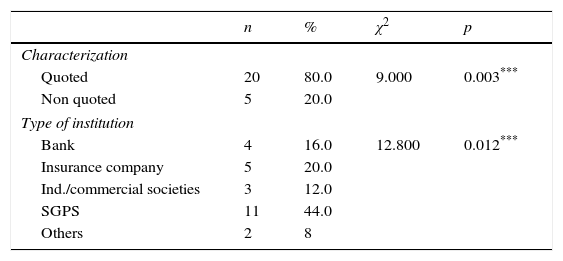
The total sample was composed of 76 entities, of which 51 (67.1%) are financial analysts and 25 (32.9%) are companies. Regarding the companies, 20 (80%) are quoted companies and the remaining ones 5 (20%) are insurance companies. There is a statistically significant difference in the percentage of each of the types of the companies [χ2(1)=9.000, p=0.003].
Most of the considered institutions are SGPS (n=11; 44%), and 16% (n=4) are banks. The percentage of 20% refers to insurance companies (n=5), 12% refers to industrial/commercial societies (n=3) and the remaining ones, 8% (n=2) refer to other types of companies. A statistically significant difference [χ2(4)=12.800, p=0.012] is also verified in the type of the considered companies. Those results are shown in Table 1:
Description of the sample – companies.
| n | % | χ2 | p | |
|---|---|---|---|---|
| Characterization | ||||
| Quoted | 20 | 80.0 | 9.000 | 0.003*** |
| Non quoted | 5 | 20.0 | ||
| Type of institution | ||||
| Bank | 4 | 16.0 | 12.800 | 0.012*** |
| Insurance company | 5 | 20.0 | ||
| Ind./commercial societies | 3 | 12.0 | ||
| SGPS | 11 | 44.0 | ||
| Others | 2 | 8 | ||
Notes: The statistics were determined based on tests χ2 of the adherence.
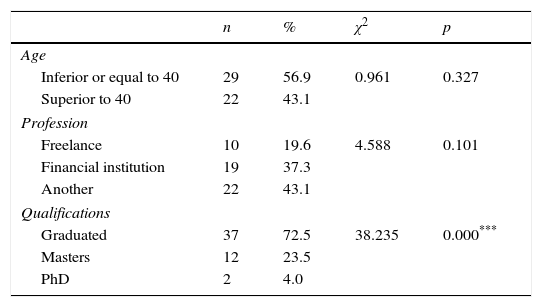
In relation to the financial analysts, the results are presented in Table 2. The majority (n=29; 56.9%) are 40 years old or younger, being 43.1% (n=22) older than 40. There are no statistically significant differences in the considered financial analysts’ age [χ2(1)=0.961; p=0.327].
Description of the sample – financial analysts.
| n | % | χ2 | p | |
|---|---|---|---|---|
| Age | ||||
| Inferior or equal to 40 | 29 | 56.9 | 0.961 | 0.327 |
| Superior to 40 | 22 | 43.1 | ||
| Profession | ||||
| Freelance | 10 | 19.6 | 4.588 | 0.101 |
| Financial institution | 19 | 37.3 | ||
| Another | 22 | 43.1 | ||
| Qualifications | ||||
| Graduated | 37 | 72.5 | 38.235 | 0.000*** |
| Masters | 12 | 23.5 | ||
| PhD | 2 | 4.0 | ||
Notes: The statistics were determined based on tests χ2 of the adherence.
In relation to the financial analysts’ profession, 19.6% (n=10) are freelance, 37.3% (n=19) work in financial institutions and the remaining 22 (43.1%) work in another way; there are no statistically significant differences in this variable [χ2(2)=4.588; p=0.101].
Most of the financial analysts (n=37; 72.5%) are graduated, 12 (23.5%) are masters and only 2 (4.0%) have a PhD degree. So, there are statistically significant differences in the qualifications of those inquired in this sample [χ2(2)=38.235; p=0.000].
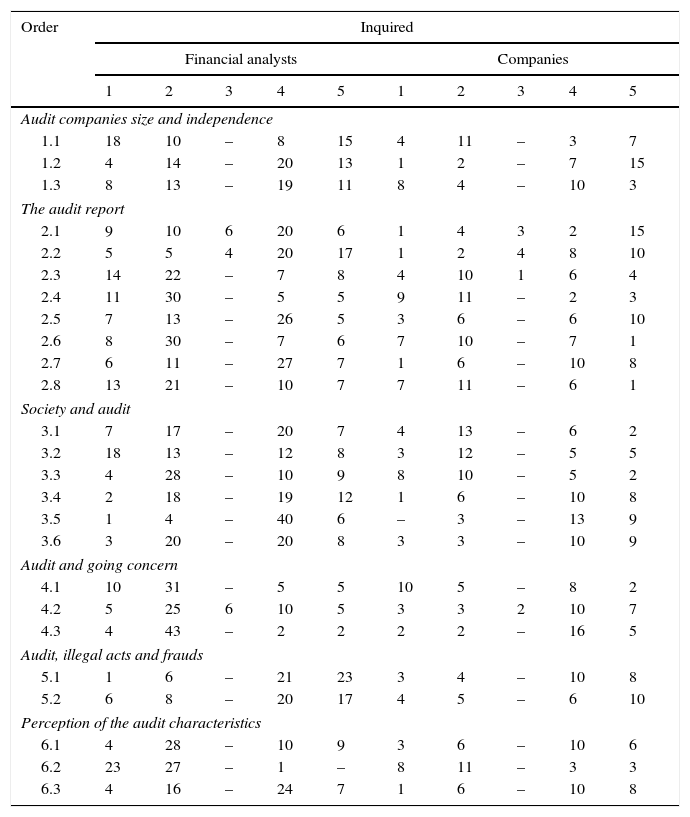
4Results analysisIn order to answer the questions, these were grouped in two sets in such a way that for the calculation of the frequencies corresponding to the “I agree” the answers were considered “4” and “5”, while for the “I disagree” the answers were considered “1” and “2.” The different percentage relative to these two cases, in each question, corresponds to the situations that expressed “I neither agree nor disagree.”
In order to characterize the agreement or disagreement percentage to the questions, we have separated the answers of each one of the groups.
Thus, in relation to the first group of questions (size and independence of the audit companies), question 1.2 (“Are the small audit companies more susceptible of being influenced by the weight, of its customers, in terms of revenues?”) obtained the largest agreement in both groups. This percentage was 64.7% for the financial analysts (M=3.47; DP=1.347) and 88% for the companies (M=4.32; DP=1.108). The different answers given by the two groups are statistically significant at the level of 1% (t=−2.920; p=0.005).
The question that got a smaller agreement by both groups was 1.1 (“In your opinion, does the size of the audit companies affect the impartiality that the auditor should have?”). The agreement percentage in the financial analysts was 45.1% (M=2.84; DP=1.725) and 40% for the companies (M=2.92; DP=1.552). However, there are no statistically significant differences in the answers on the part of the two groups. The results are shown in Table 3.
Summary of the statistics by answering subgroups – size and independence of the audit companies.
| Financial analysts | Companies | ||||
|---|---|---|---|---|---|
| Agree (disagrees) | Average (D.P.) | Agree (disagrees) | Average (D.P.) | t (p-value) | |
| % | % | ||||
| Question 1.1 | 45.1 | 2.84 | 40.0 | 2.92 | −0.188 |
| (54.9) | (1.725) | (60.0) | (1.552) | (0.851) | |
| Question 1.2 | 64.7 | 3.47 | 88.0 | 4.32 | −2.920*** |
| (35.3) | (1.347) | (12.0) | (1.108) | (0.005) | |
| Question 1.3 | 58.9 | 3.24 | 52.0 | 2.84 | 1.092 |
| (41.1) | (1.450) | (48.0) | (1.546) | (0.278) | |
Notes: The statistics were determined based on tests t-student for independent samples.
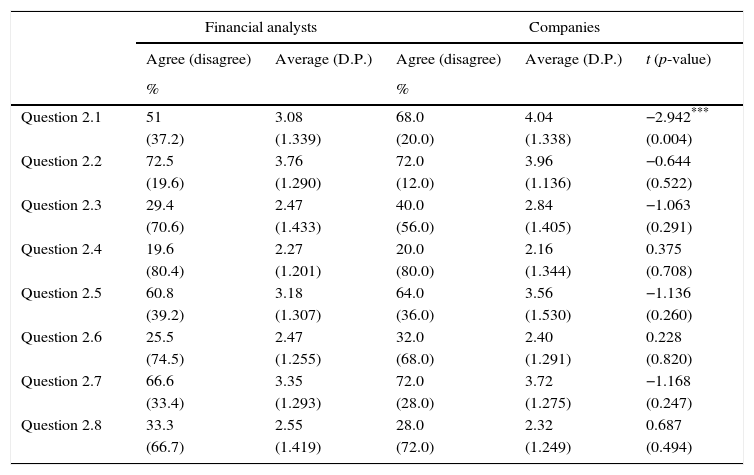
In relation to the questions concerning the audit report, question 2.2 (“Is the audit report an important tool when making an investment decision?”) obtained a larger agreement percentage in both groups, although the average of the answers to this question doesn’t present statistically significant differences in relation to the groups. For this question the agreement percentage in the financial analysts was 72.5% (M=3.76, DP=1.290), being 72% (M=3.96; DP=1.136) the corresponding percentage for the companies. In relation to this last group, the question 2.7 (“Should the audit report analyze, besides historical information, prospective information?”) presented the same agreement percentage (M=3.72; DP=1.275).
It was question 2.4 (“Is the audit report, without a qualified opinion, an absolute certainty that the financial statements are correct?”) that presented a smaller agreement percentage in both groups: 19.6% for the financial analysts (M=2.27; DP=1.201) and 20.0% (M=2.16; DP=1.334) for the companies, not having statistically significant differences in these answers.
The answers to 2.1 (“Do investors give the audit report a significant weight in the decision making process?”) present statistically significant differences at the level of 1% for the groups (t=−2.942; p=0.004). These results are shown in Table 4.
Summary of the statistics for answering sub-groups – the audit report.
| Financial analysts | Companies | ||||
|---|---|---|---|---|---|
| Agree (disagree) | Average (D.P.) | Agree (disagree) | Average (D.P.) | t (p-value) | |
| % | % | ||||
| Question 2.1 | 51 | 3.08 | 68.0 | 4.04 | −2.942*** |
| (37.2) | (1.339) | (20.0) | (1.338) | (0.004) | |
| Question 2.2 | 72.5 | 3.76 | 72.0 | 3.96 | −0.644 |
| (19.6) | (1.290) | (12.0) | (1.136) | (0.522) | |
| Question 2.3 | 29.4 | 2.47 | 40.0 | 2.84 | −1.063 |
| (70.6) | (1.433) | (56.0) | (1.405) | (0.291) | |
| Question 2.4 | 19.6 | 2.27 | 20.0 | 2.16 | 0.375 |
| (80.4) | (1.201) | (80.0) | (1.344) | (0.708) | |
| Question 2.5 | 60.8 | 3.18 | 64.0 | 3.56 | −1.136 |
| (39.2) | (1.307) | (36.0) | (1.530) | (0.260) | |
| Question 2.6 | 25.5 | 2.47 | 32.0 | 2.40 | 0.228 |
| (74.5) | (1.255) | (68.0) | (1.291) | (0.820) | |
| Question 2.7 | 66.6 | 3.35 | 72.0 | 3.72 | −1.168 |
| (33.4) | (1.293) | (28.0) | (1.275) | (0.247) | |
| Question 2.8 | 33.3 | 2.55 | 28.0 | 2.32 | 0.687 |
| (66.7) | (1.419) | (72.0) | (1.249) | (0.494) | |
Notes: The statistics were determined based on tests χ2 of the adherence.
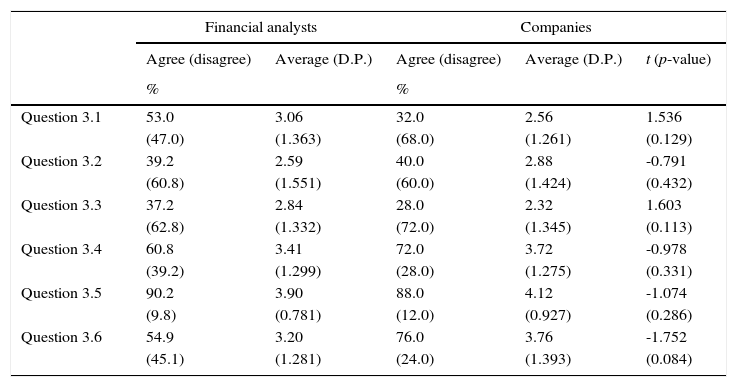
In relation to the questions regarding society and audit, we verified that question 3.5 (“A structure of a more effective corporate governance and the establishment of audit and supervision committees are fundamental instruments to reduce the difference of expectations in audit?”) presents a larger agreement by the financial analysts, 90.2% (M=3.90; DP=0.781), and also a high agreement by the companies, 88.0% (M=4.12; DP=0.927). There are no statistically significant differences in the answers given by the two groups.
The question that shows less agreement by the financial analysts is question 3.3 (“Is the audit regulation made by the professionals preferable to the one imposed by supervision organisms?”), having an agreement percentage of 37.2% (M=2.84; DP=1.332), also being the question that shows a smaller percentage (28%) on the part of the companies (M=2.32; DP=1.345).
In this group of questions, no statistically significant differences in relation to any one of the questions are found. The results are presented in Table 5.
Summary of the statistics by answering sub-groups – society and audit.
| Financial analysts | Companies | ||||
|---|---|---|---|---|---|
| Agree (disagree) | Average (D.P.) | Agree (disagree) | Average (D.P.) | t (p-value) | |
| % | % | ||||
| Question 3.1 | 53.0 | 3.06 | 32.0 | 2.56 | 1.536 |
| (47.0) | (1.363) | (68.0) | (1.261) | (0.129) | |
| Question 3.2 | 39.2 | 2.59 | 40.0 | 2.88 | -0.791 |
| (60.8) | (1.551) | (60.0) | (1.424) | (0.432) | |
| Question 3.3 | 37.2 | 2.84 | 28.0 | 2.32 | 1.603 |
| (62.8) | (1.332) | (72.0) | (1.345) | (0.113) | |
| Question 3.4 | 60.8 | 3.41 | 72.0 | 3.72 | -0.978 |
| (39.2) | (1.299) | (28.0) | (1.275) | (0.331) | |
| Question 3.5 | 90.2 | 3.90 | 88.0 | 4.12 | -1.074 |
| (9.8) | (0.781) | (12.0) | (0.927) | (0.286) | |
| Question 3.6 | 54.9 | 3.20 | 76.0 | 3.76 | -1.752 |
| (45.1) | (1.281) | (24.0) | (1.393) | (0.084) | |
Notes: The statistics were determined based on tests χ2 of the adherence.
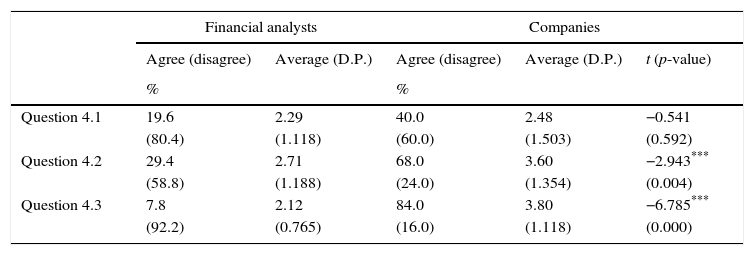
Considering now the three questions regarding audit and going concern, we can see that the biggest agreement by the financial analysts is found in relation to question 4.2 (“Do you think that when an auditor shows doubts about the going concern, his opinion can precipitate the company failure?”), with a percentage of 29.4% (M=2.71; DP=1.118), having been obtained for the same question, by the companies, a percentage of 68% (M=3.60; DP=1.354). So, there is a statistically significant difference of 1% in the answers given to this question by both groups (t=−2.943: p=0.004).
The biggest agreement in the answers of the companies was obtained for question 4.3 (“When the failure of a company occurs, do you think that the auditor didn’t do his work correctly?”), with a percentage of 84.0% (M=3.80; DP=1.118), that coincides with the smallest agreement by the financial analysts, that only have a percentage of agreement of 7.8% (M=2.12; DP=0.765).
There are statistically significant differences of 1% in the average of the answers obtained to these questions by both groups (t=−6.785; p=0.000).
The question that got a smaller agreement by the companies was 4.1 (“An audit report that doesn’t raise any doubt about the going concern can be read as a guarantee that the company will continue indefinitely?”), with a percentage of 40% (M=2.48; DP=1.503). The results are shown in Table 6.
Summary of the statistics for answering subgroups – audit and going concern.
| Financial analysts | Companies | ||||
|---|---|---|---|---|---|
| Agree (disagree) | Average (D.P.) | Agree (disagree) | Average (D.P.) | t (p-value) | |
| % | % | ||||
| Question 4.1 | 19.6 | 2.29 | 40.0 | 2.48 | −0.541 |
| (80.4) | (1.118) | (60.0) | (1.503) | (0.592) | |
| Question 4.2 | 29.4 | 2.71 | 68.0 | 3.60 | −2.943*** |
| (58.8) | (1.188) | (24.0) | (1.354) | (0.004) | |
| Question 4.3 | 7.8 | 2.12 | 84.0 | 3.80 | −6.785*** |
| (92.2) | (0.765) | (16.0) | (1.118) | (0.000) | |
Notes: The statistics were determined based on tests χ2 of the adherence.
In relation to the subjects about audit, illegal acts and frauds, question 5.1 (“Do you think that the auditor should have an active role in the detection of illegal acts?”) got the largest agreement by both groups. Thus, the financial analysts show an agreement percentage of 86.2% (M=4.16; DP=1.046) and the companies a percentage of 72% (M=3.64; DP=1.411). There are no statistically significant differences in the answers to these two questions given by each group.
Question 5.2 (“Should the auditor seek actively for fraud indicators?”) shows the smallest agreement among these groups, although there are high percentages of agreement: 72.5% for the financial analysts (M=3.67; DP=1.395) and 64.0% (M=3.52; DP=1.584) for the companies. These results can be seen in Table 7.
Summary of the statistics for answering subgroups – audit, illegal acts and frauds.
| Financial analysts | Companies | ||||
|---|---|---|---|---|---|
| Agree (disagree) | Average (D.P.) | Agree (disagree) | Average (D.P.) | t (p-value) | |
| % | % | ||||
| Question 5.1 | 86.2 | 4.16 | 72.0 | 3.64 | 1.626 |
| (13.8) | (1.046) | (28.0) | (1.411) | (0.112) | |
| Question 5.2 | 72.5 | 3.67 | 64.0 | 3.52 | 0.412 |
| (27.5) | (1.395) | (36.0) | (1.584) | (0.682) | |
Notes: The statistics were determined based on tests χ2 of the adherence.
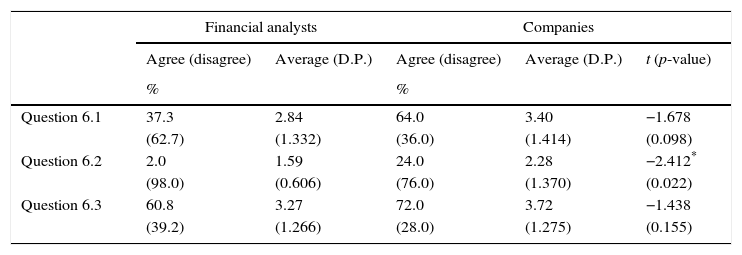
Finally, in relation to the perception of the characteristics of an audit, both groups show high agreement with question 6.3 (“Should the auditor's approach to the so called social responsibility of the company be more reinforced than the merely financial audit?”), with a percentage of 60.8% (M=3.27; DP=1.266) for the financial analysts and 72.0% (M=3.72; DP=1.275) for the companies.
The question that showed a smaller agreement by the financial analysts was 6.2 (“When auditing the financial statements does the auditors analyze all the transactions?”), for which the percentage is only 2% (M=1.59; DP=0.606), also being this question the one that presents a smaller agreement by the companies, only 24% (M=2.28; DP=1.370). Nevertheless, there are statistically significant differences in the average of the answers obtained from each of these groups. The results are shown in Table 8.
Summary of the statistics for answering subgroups – perception of the characteristics of the audit.
| Financial analysts | Companies | ||||
|---|---|---|---|---|---|
| Agree (disagree) | Average (D.P.) | Agree (disagree) | Average (D.P.) | t (p-value) | |
| % | % | ||||
| Question 6.1 | 37.3 | 2.84 | 64.0 | 3.40 | −1.678 |
| (62.7) | (1.332) | (36.0) | (1.414) | (0.098) | |
| Question 6.2 | 2.0 | 1.59 | 24.0 | 2.28 | −2.412* |
| (98.0) | (0.606) | (76.0) | (1.370) | (0.022) | |
| Question 6.3 | 60.8 | 3.27 | 72.0 | 3.72 | −1.438 |
| (39.2) | (1.266) | (28.0) | (1.275) | (0.155) | |
Notes: The statistics were determined based on tests χ2 of the adherence.
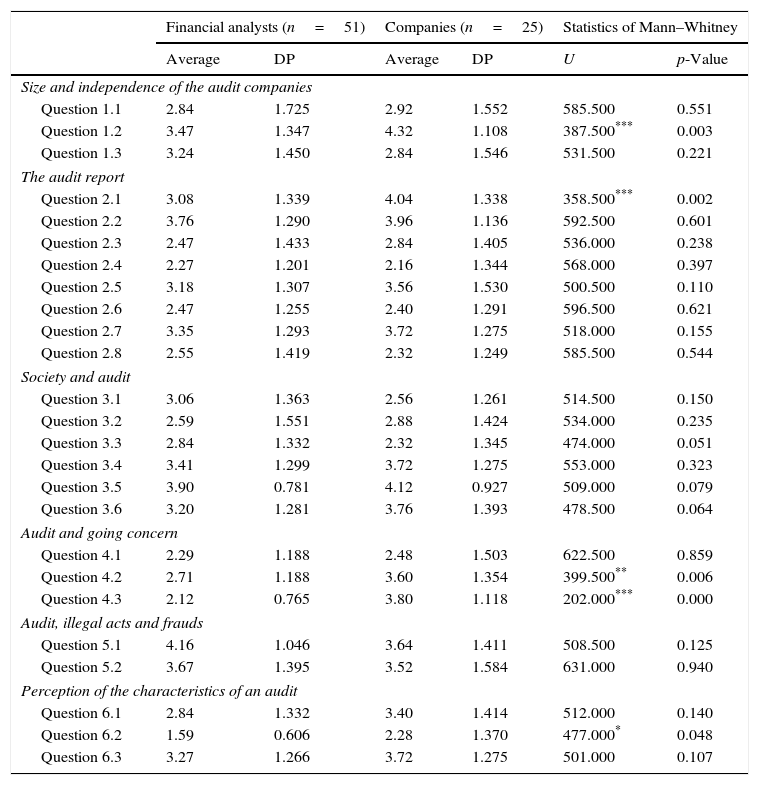
In order to verify the existence of possible statistically significant differences in relation to the answers obtained from the different groups, a test of Mann–Whitney was employed. The results are presented in Table 9.
Descriptive statistics for answering subgroups.
| Financial analysts (n=51) | Companies (n=25) | Statistics of Mann–Whitney | ||||
|---|---|---|---|---|---|---|
| Average | DP | Average | DP | U | p-Value | |
| Size and independence of the audit companies | ||||||
| Question 1.1 | 2.84 | 1.725 | 2.92 | 1.552 | 585.500 | 0.551 |
| Question 1.2 | 3.47 | 1.347 | 4.32 | 1.108 | 387.500*** | 0.003 |
| Question 1.3 | 3.24 | 1.450 | 2.84 | 1.546 | 531.500 | 0.221 |
| The audit report | ||||||
| Question 2.1 | 3.08 | 1.339 | 4.04 | 1.338 | 358.500*** | 0.002 |
| Question 2.2 | 3.76 | 1.290 | 3.96 | 1.136 | 592.500 | 0.601 |
| Question 2.3 | 2.47 | 1.433 | 2.84 | 1.405 | 536.000 | 0.238 |
| Question 2.4 | 2.27 | 1.201 | 2.16 | 1.344 | 568.000 | 0.397 |
| Question 2.5 | 3.18 | 1.307 | 3.56 | 1.530 | 500.500 | 0.110 |
| Question 2.6 | 2.47 | 1.255 | 2.40 | 1.291 | 596.500 | 0.621 |
| Question 2.7 | 3.35 | 1.293 | 3.72 | 1.275 | 518.000 | 0.155 |
| Question 2.8 | 2.55 | 1.419 | 2.32 | 1.249 | 585.500 | 0.544 |
| Society and audit | ||||||
| Question 3.1 | 3.06 | 1.363 | 2.56 | 1.261 | 514.500 | 0.150 |
| Question 3.2 | 2.59 | 1.551 | 2.88 | 1.424 | 534.000 | 0.235 |
| Question 3.3 | 2.84 | 1.332 | 2.32 | 1.345 | 474.000 | 0.051 |
| Question 3.4 | 3.41 | 1.299 | 3.72 | 1.275 | 553.000 | 0.323 |
| Question 3.5 | 3.90 | 0.781 | 4.12 | 0.927 | 509.000 | 0.079 |
| Question 3.6 | 3.20 | 1.281 | 3.76 | 1.393 | 478.500 | 0.064 |
| Audit and going concern | ||||||
| Question 4.1 | 2.29 | 1.188 | 2.48 | 1.503 | 622.500 | 0.859 |
| Question 4.2 | 2.71 | 1.188 | 3.60 | 1.354 | 399.500** | 0.006 |
| Question 4.3 | 2.12 | 0.765 | 3.80 | 1.118 | 202.000*** | 0.000 |
| Audit, illegal acts and frauds | ||||||
| Question 5.1 | 4.16 | 1.046 | 3.64 | 1.411 | 508.500 | 0.125 |
| Question 5.2 | 3.67 | 1.395 | 3.52 | 1.584 | 631.000 | 0.940 |
| Perception of the characteristics of an audit | ||||||
| Question 6.1 | 2.84 | 1.332 | 3.40 | 1.414 | 512.000 | 0.140 |
| Question 6.2 | 1.59 | 0.606 | 2.28 | 1.370 | 477.000* | 0.048 |
| Question 6.3 | 3.27 | 1.266 | 3.72 | 1.275 | 501.000 | 0.107 |
Notes: The average of the groups was determined with resource to a five-point Likert scale, where 1 corresponds to “I Totally Disagree” and 5 corresponds to “I Totally Agree.”
Analyzing the answers of each group, they are essentially the same, with significant differences in only 5 of the 25 placed questions. Thus, in relation to the questions about the size and independence of the audit companies, both groups only differ in question 1.2 (“Are the small audit companies more susceptible of being influenced by the weight of its customers, in terms of revenues?”) for which a medium value of answer of M=3.47 (DP=1.347) was obtained by the financial analysts, being M=4.32 (DP=1.108) the value obtained by the companies. This difference in the answers is significant at the level 1%.
Considering the audit report, there are statistically significant differences only in relation to question 2.1 (“Is the audit report an important tool when making investment decisions?”) for which the financial analysts’ medium answer was M=3.08 (DP=1.339), while for the companies it was M=4.04 (DP=1.338). The differences obtained to this question are significant at the level of 1%.
A different situation is verified regarding the questions related with society and audit. There are no statistically significant differences in any group to these questions, showing a similar vision by the companies and by the financial analysts.
Considering the questions related to the audit and going concern, there are statistically significant differences in relation to question 4.2 (“Do you think that when an auditor shows doubts about the going concern, his opinion can precipitate the company failure?”), having the financial analysts obtained a medium response of M=2.71 (DP=1.188), while in the companies it was M=3.60 (DP=1.354). These differences are significant at the level of 5%.
Still in relation to this group of questions, there are statistically significant differences for question 4.3 (“When the failure of a company occurs, do you think that the auditor didn’t do his work correctly?”), having the financial analysts obtained a medium value of M=2.12 (DP=0.765), and the companies a value of M=3.80 (DP=1.118).
In the questions related with audit, illegal acts and frauds, there are not statistically significant differences in the answers from each group.
Finally, in relation to characteristics of an audit, there are statistically significant differences in the answers to question 6.2 (“When auditing the financial statements do the auditors analyze all the transactions?”), having the financial analysts obtained a medium answer of M=1.59 (DP=0.606), and the companies a value of M=2.28 (DP=1.370). These differences present a statistical significance of 5%.
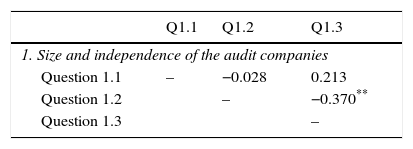
With the intention of determining possible relationships among the answers to the questions given by each group, there were certain correlations of Spearman among the answers. The correlations of the answers given by financial analysts to the questions about the size and independence of the audit companies are shown in Table 10.
Correlations of Spearman – financial analysts.
| Q1.1 | Q1.2 | Q1.3 | |
|---|---|---|---|
| 1. Size and independence of the audit companies | |||
| Question 1.1 | – | −0.028 | 0.213 |
| Question 1.2 | – | −0.370** | |
| Question 1.3 | – | ||
A statistically significant association is revealed, moderate negative (Rho=−0.370; p<0.01), among the answers to questions 1.2 (“Are the small audit companies more susceptible of being influenced by the weight of its customers, in terms of revenues?”) and 1.3 (“Does the oligopoly of the profession based in big audit companies inhibit a free and open competition?”). In this way, the financial analysts that manifest a larger agreement with question 1.2 show a smaller agreement with question 1.3.
In relation to the same questions, we present in Table 11 the correlations found in the answers given by the companies.
Correlations of Spearman – companies.
| Q1.1 | Q1.2 | Q1.3 | |
|---|---|---|---|
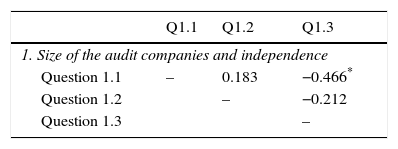
| 1. Size of the audit companies and independence | |||
| Question 1.1 | – | 0.183 | −0.466* |
| Question 1.2 | – | −0.212 | |
| Question 1.3 | – | ||
A statistically significant negative correlation is verified regarding questions 1.2 and 1.3 (Rho=−0.466; p<0.05). This correlation is moderated, indicating once again that the companies that show a bigger agreement to question 1.2 show more disagreement in relation to question 1.3. The correlation is, in this case, statistically significant at the level of 5%.
In relation to the questions about the audit report, the correlations among the answers given by the financial analysts are presented in Table 12.
Correlations of Spearman – financial analysts.
| Q2.1 | Q2.2 | Q2.3 | Q2.4 | Q2.5 | Q2.6 | Q2.7 | Q2.8 | |
|---|---|---|---|---|---|---|---|---|
| 2. The audit report | ||||||||
| Question 2.1 | – | −0.060 | −0.399** | 0.178 | 0.020 | 0.049 | −0.184 | 0.218 |
| Question 2.2 | – | −0.048 | 0.041 | 0.188 | 0.162 | −0.273 | 0.116 | |
| Question 2.3 | – | −0.195 | −0.018 | 0.005 | 0.140 | −0.184 | ||
| Question 2.4 | – | 0.154 | −0.126 | −0.270 | 0.061 | |||
| Question 2.5 | – | 0.291* | −0.218 | 0.040 | ||||
| Question 2.6 | – | 0.038 | −0.009 | |||||
| Question 2.7 | – | −0.352* | ||||||
| Question 2.8 | – | |||||||
From this analysis, statistically significant correlations are verified among the answers to questions 2.1 (“Do the investors give the audit report a significant weight in the decision making process?”) and 2.3 (“Do you consider that the audit report fully expresses the auditor's work?”); 2.5 (“Is the language used to express the auditor's report clear and visible to all the financial statements users?”) and 2.6 (“Is the audit report, strictly in a finance perspective, satisfactory to investors?”); and to questions 2.7 (“Should the audit report analyze, besides historical information, prospective information?”) and 2.8 (“A qualified report that raises questions related with going concern problems is a reason for an auditor change?”).
Thus, in relation to questions 2.1 and 2.3 we can see that the financial analysts that show a larger agreement to the first question show a smaller agreement in relation to question 2.3. This correlation (Rho=−0.399; p<0.01) is moderate negative and significant at the level of 1%.
Regarding questions 2.5 and 2.6, we can see a statistically significant, moderate and positive correlation (Rho=0.291; p<0.05). In this sense, the financial analysts that present a larger agreement in relation to question 2.5 show also a larger agreement to question 2.6.
Regarding the correlation among questions 2.7 and 2.8, a moderate negative correlation (Rho=−0.352; p<0.05), statistically significant at the level of 5%, is also verified. So, we can state that the financial analysts that showed a bigger agreement to question 2.7 showed a smaller agreement to question 2.8.
The corresponding correlations relative to the answers of the companies are shown in Table 13.
Correlations of Spearman – companies.
| Q2.1 | Q2.2 | Q2.3 | Q2.4 | Q2.5 | Q2.6 | Q2.7 | Q2.8 | |
|---|---|---|---|---|---|---|---|---|
| 2. The audit report | ||||||||
| Question 2.1 | – | −0.618** | −0.078 | −0.355 | 0.070 | 0.285 | −0.144 | 0.144 |
| Question 2.2 | – | 0.353 | 0.393 | −0.105 | −0.277 | 0.334 | −0.087 | |
| Question 2.3 | – | 0.565** | −0.169 | −0.131 | 0.061 | 0.082 | ||
| Question 2.4 | – | −0.213 | −0.227 | 0.212 | 0.003 | |||
| Question 2.5 | – | 0.182 | 0.071 | 0.192 | ||||
| Question 2.6 | – | 0.165 | −0.476* | |||||
| Question 2.7 | – | −0.345 | ||||||
| Question 2.8 | – | |||||||
From the analysis of Table 13, we can find statistically significant correlations among the answers to questions 2.1 and 2.2; 2.3 and 2.4; 2.7 and 2.8. Thus, the correlation among the subject 2.1 and 2.2 is strongly negative (Rho=−0.618; p<0.01) and significant at the level of 1%. This way it can be asserted in the perspective of the companies that to a larger agreement with subject 2.1 corresponds a larger disagreement to subject 2.2.
Regarding the subjects 2.3 and 2.4, the correlation is moderated positive (Rho=−0.565; p<0.01), significant at the level of 1%. Thus, the companies that showed a larger agreement about question 2.3 also show a larger agreement to question 2.4.
Finally, regarding the correlation among the answers to questions 2.7 and 2.8 it can be verified that it is moderate negative (Rho=−0.476; p<0.05), statistically significant at the level of 5%. In this way, the companies that present a larger agreement with the question 2.7 they manifest a larger disagreement to the subject 2.8.
The correlations among the answers given by financial analysts are shown in Table 14.
Thus, there are statistically significant correlations among the answers to questions 3.2 (“Confronting the critics from the society, have suitable reforms in audit area been made to surpass them?”) and 3.3 (“Is the audit regulation made by professionals preferable to the one imposed by supervision organisms?”); 3.3 (“Is the audit regulation made by professionals preferable to the one imposed by supervision organisms?”) and 3.6 (“Does the society, in general, and the finance markets, in particular, feel that audit stabilizes the financial and economic relationships established in today's society?”).
Regarding the first pair of questions, a statistically significant, moderate and negative correlation (Rho=−0.278; p<0.05) is shown. The financial analysts that presented a larger agreement to question 3.2 present a smaller agreement to question 3.3.
In relation to the correlation among the questions 3.3 and 3.6 there is a positive moderate correlation (Rho=0.292; p<0.05), significant at the level of 5%. So, the financial analysts that presented a larger agreement to question 3.3 also have a bigger agreement to question 3.6.
The results relative to the companies are as presented in Table 15.
From the analysis of this table, it is verified that associations among the answers given by the companies to any of these questions do not exist.
With regard to the questions about audit and going concern, the answers given by the financial analysts are indicated in Table 16.
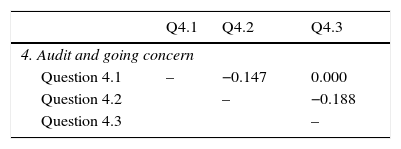
However there are no statistically significant correlations among any of the questions. This is not verified on the part of the companies, whose correlations among the answers are presented in Table 17.
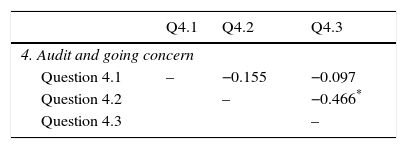
Correlations of Spearman – companies.
| Q4.1 | Q4.2 | Q4.3 | |
|---|---|---|---|
| 4. Audit and going concern | |||
| Question 4.1 | – | −0.155 | −0.097 |
| Question 4.2 | – | −0.466* | |
| Question 4.3 | – | ||
In this case, there is a moderate negative correlation, significant at the level of 5%, among the answers to the questions 4.2 (“Do you think that when an auditor shows doubts about the going concern, his opinion can precipitate the company failure?”) and 4.3 “(When the failure of a company occurs, do you think that the auditor didn’t do his work correctly?”). This correlation (Rho=−0.466; p<0.05) shows that, under the point of view of the companies, a larger agreement with question 4.2 shows a larger disagreement with question 4.3.
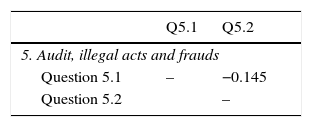
Regarding the audit, illegal acts and frauds, the correlations among the answers given by the financial analysts are revealed in Table 18.
Correlations of Spearman – financial analysts.
| Q5.1 | Q5.2 | |
|---|---|---|
| 5. Audit, illegal acts and frauds | ||
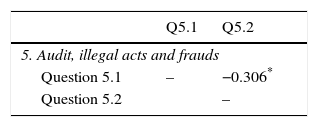
| Question 5.1 | – | −0.306* |
| Question 5.2 | – | |
The existence of a moderate negative correlation (Rho=−0.306; p<0.05), statistically significant at the level of 5%, among the answers to questions 5.1 (“Do you think that the auditor should have an active role in the detection of illegal acts?”) and 5.2 (“Should the auditor seek actively for fraud indicators?”) is verified. This means that the financial analysts that presented a larger agreement to question 5.1 present a smaller agreement to question 5.2.
The results to the answers given by the companies are shown in Table 19.
According to the presented table, it is understood that, in the perspective of the companies, there are no significant correlations between the two questions.
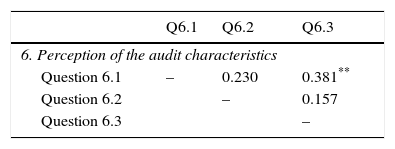
Finally, in relation to the questions about the perception of the audit characteristics, the correlations among the answers given by the financial analysts are as indicated in Table 20.
Correlations of Spearman – financial analysts.
| Q6.1 | Q6.2 | Q6.3 | |
|---|---|---|---|
| 6. Perception of the audit characteristics | |||
| Question 6.1 | – | 0.230 | 0.381** |
| Question 6.2 | – | 0.157 | |
| Question 6.3 | – | ||
We can see a statistically significant correlation (Rho=−0.381; p<0.01), at the level 1%, among the answers given to questions 6.1 (“Does the responsibility for the elaboration of financial statements of the companies reside as much in the managers of the companies as in the auditors?”) and 6.3 (“Should the auditor's access of the so called social responsibility of the companies be stronger than the merely financial audit?”). This correlation is moderate positive; the financial analysts that presented a larger agreement to question 6.1 (“Does the responsibility for the elaboration of the financial statements of the companies reside as much in the managers of the companies as in the auditors?”), also present a larger agreement to question 6.3 (“Should the auditor's access of the so called social responsibility of the companies be stronger than the merely financial audit?”).
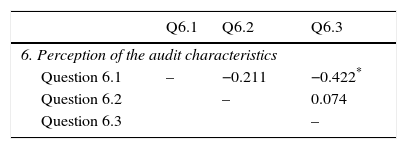
The results, in relation to the companies, are presented in Table 21.
Correlations of Spearman – companies.
| Q6.1 | Q6.2 | Q6.3 | |
|---|---|---|---|
| 6. Perception of the audit characteristics | |||
| Question 6.1 | – | −0.211 | −0.422* |
| Question 6.2 | – | 0.074 | |
| Question 6.3 | – | ||
Considering this group of questions, there is a moderate negative correlation (Rho=−0.422; p<0.05) among the answers to questions 6.1 (“Does the responsibility for the preparation of the financial statements reside with the management as well as with the auditors?”) and 6.3 (“Should the auditor's approach to the so called social responsibility of the company be more reinforced than the merely financial audit?”). The companies that present a larger agreement to question 6.1 present a bigger disagreement to question 6.3. This correlation is significant at the level 5%.
5DiscussionAs we stated in the summary of the work, investigation regarding the relationships between society and audit in Portugal is consistent with the international concerns. Regarding the first question, there are no major differences between the opinions of the financial analysts and the public companies. Thus, in relation to the problem of the size of the audit companies and their relationship with the independence, we verified that the perception about the independence of the small audit companies is susceptible of being influenced by the customers’ weight. This is in agreement with the investigations of Kaplan and Williams (2013) and Chu et al. (2011) that demonstrate the existence of constrictions to the full development of the function in this situation.
Regarding the issue of the audit report as a decision-making instrument, there was a broad consensus on questions 2.1 and 2.2, meaning that there are no significant differences between the two groups. Respondent groups also admit that the audit report does not reflect the work of the auditor (2.3) and that an unmodified opinion does not imply the full accuracy of the financial statements (2.4). The language used by the auditors is also considered by the financial statement users as being largely unintelligible (2.5), as well as it as a strictly financial dimension (2.6). The same level of agreement is expressed in question 2.7, when both groups agree that historical information is a necessary but not sufficient condition, and it is therefore necessary to add a prospective view of the financial statements. Regarding the link between the occurrence of a qualified opinion and its reflection in the going concern assumption, both groups have a negative perception (2.8).
The perception of the companies and of the financial analysts in relation to the audit report is equally consistent with the international debate on the theme. In fact, Arens et al. (2010) state that the users of the financial information perceive that the audit report gives safety to the accountability process, the same happening with Messier et al. (2012) and Gray and Manson (2000). The third question tends to investigate the relationship between society and audit. It is acknowledged by both groups that a strong structure of corporate governance can reduce the audit expectation gap, and that a self-regulated profession is negatively apparent. All other questions do not present significant statistical differences between the two groups. However, Gold et al. (2012) mention defrauded expectations about the nature, objectives and procedures of the audit, pointing the most recent international investigations (Asare & Wright, 2012; Carcello, 2012) to a change of the current format of the audit report, in order to reinforce the social responsibility of the company, relegating for a secondary position the merely financial audit. Thus, they indirectly accept changes to the audit report, which is in agreement with the international tendencies on this matter. In this same line of thought we find Flint (1988), Sherer and Kent (1983) and Lee (1996) that accept that the audit scope should embrace the efficient and effective administration of the resources assigned to an organization in an agency relation.
Malsch (2013) defends that the corporate social reporting, limited to the merely financial aspect, which is typical of the accounting and traditional audit, is too reductionist, so it should embrace wider social questions. In this same sense, Gray et al. (1996) recommend the need to develop a larger dialog between society and audit, since the different attributes of the audit show different distributions of influence in the society. On the other side, the centralization of property power in the society tends, progressively, to impose to a financial report with a wider focus in the future and in the analysis and management of the business (Giroux & Cassell, 2011).
This perception is in agreement with the philosophy of PCAOB (2006) that forces the auditor to issue an opinion on the internal control system. Considering the problems of the going concern assumption, addressed in questions (4.1, 4.2 and 4.3), there are statistically significant differences between the two groups in relation to question 4.2, as well as in question 4.3, while there are slight divergences regarding question 4.1. Regarding the questions related with audit and going concern, we find that the concerns of those inquired are in accordance with the investigations that study the investors’ reactions when facing going concern issues. In fact, Herbohn et al. (2007), Ittonen (2011), Kausar and Taffler (2004), Menon and Williams (2010), Mutchler (1984) and Schaub and Highfield (2003) present different focuses related with this problem, but all of them state that audit plays a fundamental role in the communication process between companies and financial statements users. They also pointed out that society views the auditor as a warranty of the going concern of the company. This theme, due to its dimension and importance in times of crisis, caused several contradictory points of view, being assumed as one of the most difficult decisions that the audit professionals face.
The problem of the illegal acts and frauds are addressed in questions 5.1 and 5.2. We noticed that both groups agree, stating that illegal acts and fraud should be a major concern in auditing. We verified that the inquired population agrees that the auditor should have an active role in the detection of illegal acts and frauds. Thus, Davidson (1975), Fraser and Lin (2004), Gullkvist and Jokipii (2013), and Rezaee (2005) state that the auditor has the duty to discover and to disclose the managers’ flaws in the compliance of laws and regulations, as well as other attitudes that society disapproves for moral, politic and other reasons. In this issue society has higher expectations than the auditors. In fact, Dellaportas (2013) and Farrell and Franco (1998) found that auditors are reluctant in enlarging their responsibilities in the detection of illegal acts. However, the inquired Portuguese companies and the financial analysts, have no doubts that this role should be appointed to auditors, which is in agreement with international perceptions. Although Knox (1994) states that the auditor's social responsibility points to their taking this task, Hemraj (2001) disagrees and suggests that the auditor's function should be the prevention and not the detection. Finally, audit characteristics are broadly understood in question 6.3 and less understood in question 6.2. The sharing of responsibility for the issuance and the preparation of the financial statements collects more consensuses among companies and less among financial analysts.
6ConclusionsThe contextualization of the relationships between society and audit in Portugal allows us to conclude that public companies, insurance companies and financial analysts view the audit function as holistic, plural and systemic. They suggest that audit should change its goals and enlarge the scope in order to mitigate the expectation gap between society and audit. Through the increase of the need of corporate social reporting, and not restricting to the merely financial aspects, they press for a change of audit attributes. It is inferred that the inquired have the perception that audit doesn’t operate separately, as it is related with the economic system, subject to rules of accountability, as well as with the social, political and ethical system. They also think that audit satisfies the needs of individuals or groups that seek financial information and the safety provided by the auditors. As this financial information can be used by society in a wide range of economic and social decisions, they think that the regulators should parameterize the information contained in the annual reports. They do not agree with audit self-regulation, which is in accordance with current international tendency. Quoted companies and financial analysts’ view regarding the valorization of the audit role, the size and independence of the audit companies, the audit report, the relations about society and audit, the going concern assumption, auditors’ role regarding illegal acts and frauds, and the perception of the characteristics of the audit are in accordance agrees with the international debate on these matters.
6.1Limitations of the investigationTwenty-five questions were made regarding the relationships between society and audit. The sample includes public companies listed in the stock exchange, insurance companies and financial analysts, considered as users of the financial information. Although the questions consider the nucleus of the problem, they may not embrace completely the complexity of the studied theme. The perception of the respondents of all of the underlying problems may not have been the most appropriate, thus affecting the intrinsic quality of the answers.
6.2Suggestions for future investigationsIn the future, the study can tend to an enlargement of the sample to the non-quoted but subject to the legal audit companies, as well as to other users of the financial information – companies of managerial analysis of risk – as well as to the different auditors that intervene in the accountability process.
| Order | Inquired | |||||||||
|---|---|---|---|---|---|---|---|---|---|---|
| Financial analysts | Companies | |||||||||
| 1 | 2 | 3 | 4 | 5 | 1 | 2 | 3 | 4 | 5 | |
| Audit companies size and independence | ||||||||||
| 1.1 | 18 | 10 | – | 8 | 15 | 4 | 11 | – | 3 | 7 |
| 1.2 | 4 | 14 | – | 20 | 13 | 1 | 2 | – | 7 | 15 |
| 1.3 | 8 | 13 | – | 19 | 11 | 8 | 4 | – | 10 | 3 |
| The audit report | ||||||||||
| 2.1 | 9 | 10 | 6 | 20 | 6 | 1 | 4 | 3 | 2 | 15 |
| 2.2 | 5 | 5 | 4 | 20 | 17 | 1 | 2 | 4 | 8 | 10 |
| 2.3 | 14 | 22 | – | 7 | 8 | 4 | 10 | 1 | 6 | 4 |
| 2.4 | 11 | 30 | – | 5 | 5 | 9 | 11 | – | 2 | 3 |
| 2.5 | 7 | 13 | – | 26 | 5 | 3 | 6 | – | 6 | 10 |
| 2.6 | 8 | 30 | – | 7 | 6 | 7 | 10 | – | 7 | 1 |
| 2.7 | 6 | 11 | – | 27 | 7 | 1 | 6 | – | 10 | 8 |
| 2.8 | 13 | 21 | – | 10 | 7 | 7 | 11 | – | 6 | 1 |
| Society and audit | ||||||||||
| 3.1 | 7 | 17 | – | 20 | 7 | 4 | 13 | – | 6 | 2 |
| 3.2 | 18 | 13 | – | 12 | 8 | 3 | 12 | – | 5 | 5 |
| 3.3 | 4 | 28 | – | 10 | 9 | 8 | 10 | – | 5 | 2 |
| 3.4 | 2 | 18 | – | 19 | 12 | 1 | 6 | – | 10 | 8 |
| 3.5 | 1 | 4 | – | 40 | 6 | – | 3 | – | 13 | 9 |
| 3.6 | 3 | 20 | – | 20 | 8 | 3 | 3 | – | 10 | 9 |
| Audit and going concern | ||||||||||
| 4.1 | 10 | 31 | – | 5 | 5 | 10 | 5 | – | 8 | 2 |
| 4.2 | 5 | 25 | 6 | 10 | 5 | 3 | 3 | 2 | 10 | 7 |
| 4.3 | 4 | 43 | – | 2 | 2 | 2 | 2 | – | 16 | 5 |
| Audit, illegal acts and frauds | ||||||||||
| 5.1 | 1 | 6 | – | 21 | 23 | 3 | 4 | – | 10 | 8 |
| 5.2 | 6 | 8 | – | 20 | 17 | 4 | 5 | – | 6 | 10 |
| Perception of the audit characteristics | ||||||||||
| 6.1 | 4 | 28 | – | 10 | 9 | 3 | 6 | – | 10 | 6 |
| 6.2 | 23 | 27 | – | 1 | – | 8 | 11 | – | 3 | 3 |
| 6.3 | 4 | 16 | – | 24 | 7 | 1 | 6 | – | 10 | 8 |


