


Background. Emerging evidence has linked the presence of non-alcoholic fatty liver disease (NAFLD) with an increased risk for cardiovascular events. We hypothesised that altered clot kinetics and platelet function may contribute to this increased risk. This study compared whole blood clotting kinetics in patients with 1) non-cirrhotic NAFLD (n = 28) and 2) healthy control subjects (n = 22).
Methods. Clotting kinetics were assessed in whole blood using thromboelastography (TEG) and assessed for correlations with cardiovascular risk factors.
Results. Clot kinetics in patients with NAFLD showed significantly stronger clot development (maximum amplitude (MA); 58.3 ± 6.3 mm vs. 52.0 ± 10.1 mm, p = 0.01) and reduced clot lysis in the presence of thrombin (35 ± 307 vs. 51 ± 267 clot lysis 30 minutes after MA, p = 0.03) compared to control subjects. Clot strength was independently positively associated with body mass index in NAFLD, but not in control subjects. There was a greater platelet contribution to clot strength in patients with NAFLD compared to controls despite similar platelet counts. There was no association between clot kinetics and features of the metabolic syndrome or presence of type 2 diabetes.
Conclusion. Patients with NAFLD have disturbances in ex-vivo clot kinetics including increased clot strength and clots that are more resistant to thrombin-stimulated lysis.
Nonalcoholic fatty liver disease (NAFLD) is associated with central obesity, type 2 diabetes and the metabolic syndrome, all recognised risk factors for cardiovascular disease (CVD). There is emerging evidence that CVD mortality poses a greater risk than liver-related death in patients with NAFLD.1,2 These data are supported by a number of cross-sectional studies which link measures of endothelial dysfunction to visceral obesity, insulin resistance and features of the metabolic syndrome in patients with NAFLD.3-10 It has been proposed that increased risk of CVD events may be independent of classical CVD risk factors and other prognostic risk factors.11,12
NAFLD and atherosclerosis appear to share common molecular mediators including whole body insulin resistance, atherogenic dyslipidaemia, and release of pro-atherogenic factors from the liver.12 In addition, the liver is integral to the clotting cascade as most coagulation and fibrinolytic proteins are synthesized in the liver. Impaired coagulation is a commonly recognised complication of end-stage cirrhosis, and hypercoagulability can also be seen in advanced liver disease depending on the balance of pro-and anti-coagulant factors.13,14 However, there is relatively little data on haemostasis in patients with well compensated liver diseases.15 This is relevant in the context of obesity-related liver disease where increased risk for CVD events and the role played by insulin resistance deserves particular clinical attention.
Insulin resistance is strongly associated with increased platelet reactivity, a procoagulant phenoty-pe and increased platelet adherence after vascular injury.16-18 Large epidemiological studies have correlated insulin and proinsulin levels with coagulation factors and fibrinogen.19,20 Obesity is associated with an impaired fibrinolytic response to thrombosis which results in exaggerated and persistent thrombosis21 and is also associated with platelet hyperactivity and resistance to anti-aggregating effects of insulin, aspirin, prostacyclin and nitric oxide.22
Some plasma haemostatic factors which favour atherosclerosis have been shown to correlate with hepatic steatosis including PAI-I and Factor VII activity (F-VIIc).23 However, there is a paucity of data on clot kinetics in NAFLD. Traditional clotting tests (prothrombin time, activated partial thrombo-plastin time) are limited because they are performed on plasma, rather than whole blood, and the contribution of platelets is not assessed. An alternative to these studies is thromboelastography (TEG). Thromboelastography is well established in liver transplantation.24-26 The test is typically performed intraoperatively, and the results determine which phase of coagulation/fibrinolysis is predominating during the surgery. TEG can evaluate whole blood clot dynamics and clot tensile properties and has recently been shown to accurately predict post-operative myocardial infarcts.27,28
We hypothesise that abnormalities in clotting kinetics exist in patients with NAFLD and are associated with obesity-related metabolic dysfunction. The aim of this study was to investigate whole blood kinetics in patients with NAFLD in comparison to healthy controls and to determine if changes to haemostatic factors are associated with obesity-related metabolic factors and/or histological features of liver disease.
MethodsPatient selectionThe study had approval from the Human Research Ethics Committee of the Princess Alexandra Hospital and the University of Queensland and informed written consent was obtained from participants. Two groups were recruited from the community and outpatient hospital clinics and included patients with NAFLD (n = 28) and lean, apparently healthy controls (n = 22). Participants were excluded if there was any history of anticoagulation therapy or other medications known to affect platelet function; there was a history of haematological, vascular or clotting disorders; or there was evidence of decom-pensated liver disease. NAFLD was diagnosed on the basis of liver histology (n = 18), or raised liver enzymes and a hepatic ultrasound consistent with steatosis. Other causes of liver disease were excluded on history and serologically. The control patients had normal liver enzymes (ALT < 35U/L; AST < 35 U/L; GGT < 55U/L), no evidence of liver disease (serologically or on history), no hepatomegaly on clinical examination and did not have the metabolic syndrome (MS) as defined by the International Diabetes Federation Criteria.29 They were frequency matched to the NAFLD group on age and gender. Anthropometric data (height, weight, waist circumference) were collected using standard techniques and Body Mass Index (BMI) was calculated in kg/m2.
PhlebotomyBlood was collected after a 10 hour overnight fast. TEG analysis was performed on 10 millilitres of blood that had been collected into 3.2% citrate tubes30 and processed within 6 hours of collection.
Analysis of whole blood clotting and lysis using Thromboelastography
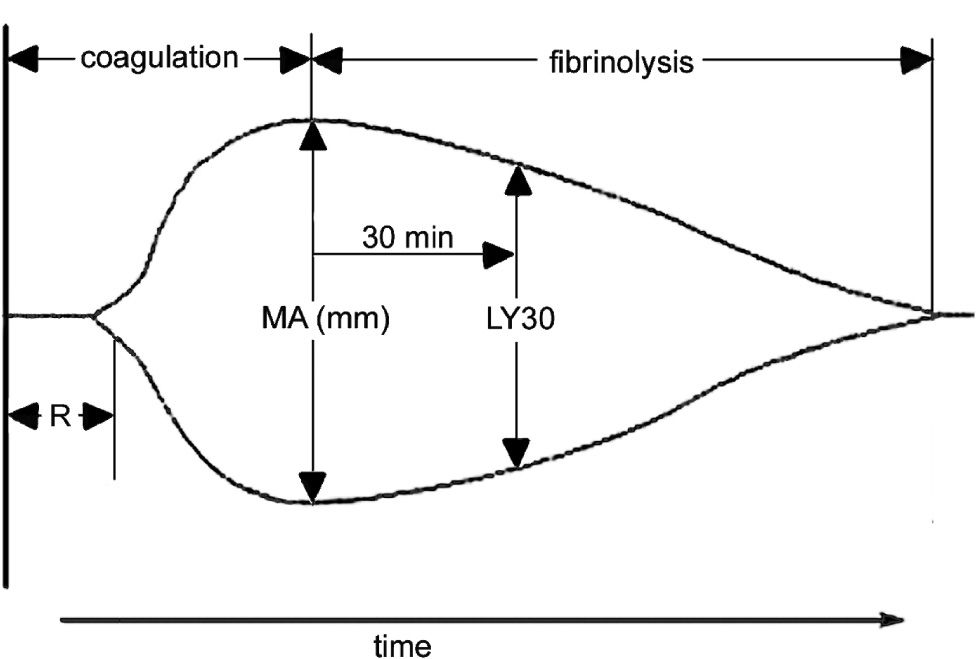
Thromboelastography was performed using a Thrombelastograph® (TEG®, Haemscope Corporation, Niles, IL, USA). The basic principles of thromboelastography have been described by Luddington.27 Clotting is initiated by the addition of calcium to a sample of whole blood. The reaction time (R) is the time taken for a clot to begin forming and is established when the trace amplitude reaches 2 mm (Figure 1). The amplitude (A) is a measure of the clot strength (shear modulus). Maximum amplitude (MA) from the TEG® tracing, representing clot strength, was recorded for each patient. MA is a direct function of the maximum dynamic properties of fibrin and platelet bonding via GPIIb/IIIa and represents the ultimate strength of the fibrin clot. The percentage of clot lysis 30 minutes after the MA is established is the LY30 value. These parameters are labelled on a representative TEG trace (Figure 1). The co-efficient of variation (CV) of MA in our laboratory is approximately 5%.
 trace. The reaction time (R) is the time taken for a clot to begin forming and is established when the trace amplitude reaches P mm. The maximum amplitude (MA) is a measure of the clot strength (shear modulus) and is measured as the widest point in the trace prior to commencement of lysis. The LY30 value is the percentage of clot lysis 30 minutes after MA.")
A representative labelled thromboelastograph (TEG) trace. The reaction time (R) is the time taken for a clot to begin forming and is established when the trace amplitude reaches P mm. The maximum amplitude (MA) is a measure of the clot strength (shear modulus) and is measured as the widest point in the trace prior to commencement of lysis. The LY30 value is the percentage of clot lysis 30 minutes after MA.
For each patient three separate tests were performed in duplicate. Each test used 320 uL of citrated whole blood and 20 uL of 0.2 M CaCl2. The first was a baseline test which analysed clotting by recalcification of citrated blood. The second was a thrombin/ t-PA test which assesses fibrinolysis and directly activates fibrinogen and platelets (via thrombin receptors) with I IU of thrombin (Sigma Aldrich, MO, USA). Fibrinolysis was assessed by the addition of 35 IU of t-PA (Boehringer Ingelheim, Ingelheim, Germany) to the citrated blood sample. The third test assessed the contribution of platelets to clot strength by the addition of 5 μL of abciximab (Eli Lilly, NSW, Australia) to recalcified blood. Abciximab binds to the glycoprotein IIb/IIIa receptor of human platelets, inhibiting platelet aggregation therefore allowing the measurement of a clot strength which develops without platelet involvement.
The baseline recalcification studies and abciximab tests were monitored until the MA was established, while the thrombin/t-PA tests were stopped 30 minutes after MA was reached when LY30 could be measured. The platelet contribution to clot strength was calculated by subtracting the MA with abciximab from the baseline MA with recalcification.31
Biochemical analysesGlucose was analysed with an automated Hitachi 747-100 analyser (Roche, Dee Why, New South Wales, Australia). Insulin was assayed using an im-munoenzymometric assay with fluorescence detection using the Tosoh AIA-600 analyser (South San Francisco, CA, USA). Insulin sensitivity was calculated using the homeostatic model of assessment of insulin resistance (HOMA-IR).32,33 Total cholesterol, HDL-cholesterol and triglycerides were assayed by an enzymatic colorimetric assay with Roche Modular Chemistry Analyser (South San Francisco, CA, USA). LDL-cholesterol was determined using the Friedewald equation.34
Histological Analysis of liver biopsyLiver biopsy specimens were fixed in 10% neutral buffered formalin and embedded in paraffin. Steatosis was graded as follows: 1, (5-30% of hepatocytes affected); 2, (30-70% of hepatocytes affected); or 3, (> 70% of hepatocytes affected). The severity of liver injury was assessed using the NAFLD activity score (NAS).35 A diagnosis of non-alcoholic steatohepatitis (NASH) was defined as NAS ≥ 5.35
Statistical AnalysisContinuous, normally distributed variables were summarized as mean ± standard deviation (SD). Variables that were not normally distributed were log transformed prior to analysis. Differences in the means of variables between the control group and patients with NAFLD were assessed using independent unpaired t-tests. The degree of association between continuous variables was assessed using Pearson’s correlation coefficient (r) or Spearman’s rank order correlation (rs). Linear regression was performed for multivariate analysis. All analysis was carried out using SPSS software version 14.0 (SPSS Inc. Chicago, IL, USA). Statistical significance was taken at a level of 5%.
ResultsTwenty-eight patients with NAFLD were similar in age and gender distribution to the 22 control subjects. Patient characteristics are shown in Table 1. Nine NAFLD patients had type 2 diabetes and 17 (59%) had the MS. Serum fibrinogen was significantly higher in NAFLD compared to controls. Prothrombin time was within the normal range for all participants and there was no difference in platelet count between NAFLD and control subjects (Table 1, p = 0.30).
Clinical characteristics of control subjects and patients with NAFLD
| Variables | Lean Control n=22 | NAFLD n=28 |
|---|---|---|
| Gender; n (M/F) | 10 / 12 | 16 / 12 |
| Age (yrs) | 48 ± 14 | 48 ± 10 |
| BMI (kg/m2) | 23.3 ± 1.6 | 35.7 ± 8.2*** |
| Waist (cm) | 83 ± 7 | 113 ± 18*** |
| SBP (mmHg) | 123 ± 20 | 125 ± 15 |
| DBP (mmHg) | 77 ± 11 | 82 ± 11 |
| ALT (U/L) | 21 ± 9 | 53 ± 25*** |
| AST (U/L) | 24 ± 7 | 35 ± 13*** |
| GGT (U/L) | 24 ± 14 | 78 ± 69*** |
| Glucose (mmol/L) | 4.8 ± 0.5 | 6.2 ± 2.1** |
| HDL (mmol/L) | 1.9 ± 0.5 | 1.3 ± 0.5*** |
| Insulin (mU/L) | 6 ± 3 | 21 ± 16*** |
| HOMA-IR | 1.18 ± 0.61 | 5.68 ± 3.99*** |
| LDL (mmol/L) | 2.4 ± 0.7 | 2.4 ± 1.3 |
| Triglyceride (mmol/L) | 0.9 ± 0.3 | 2.6 ± 3.4*** |
| Prothrombin Time (sec) | 10.3 ± 0.7 | 10.3 ± 0.7 |
| aPTT (sec) | 28.7 ± 5.5 | 30.9 ± 7.2 |
| Platelet count | 225 ± 60 | 251 ± 90 |
| Fibrinogen (mg/dL) | 2.87± 0.46 | 3.59 ± 0.73*** |
| Type 2 diabetes n (7) | 0 | 9 (32) |
| Metabolic Syndrome n (7) | 0 | 17 (59) |
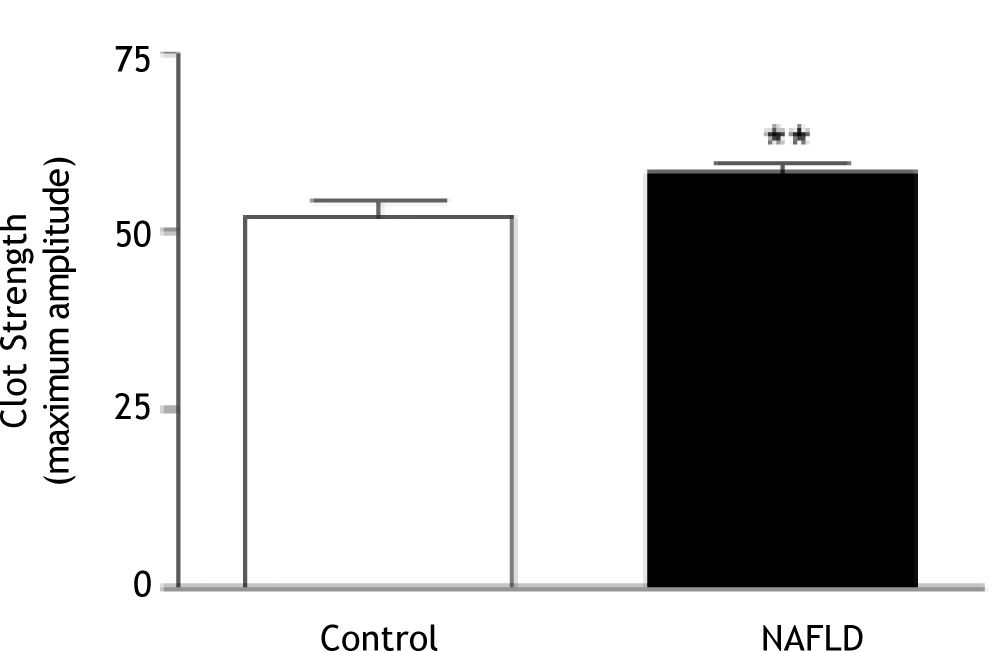
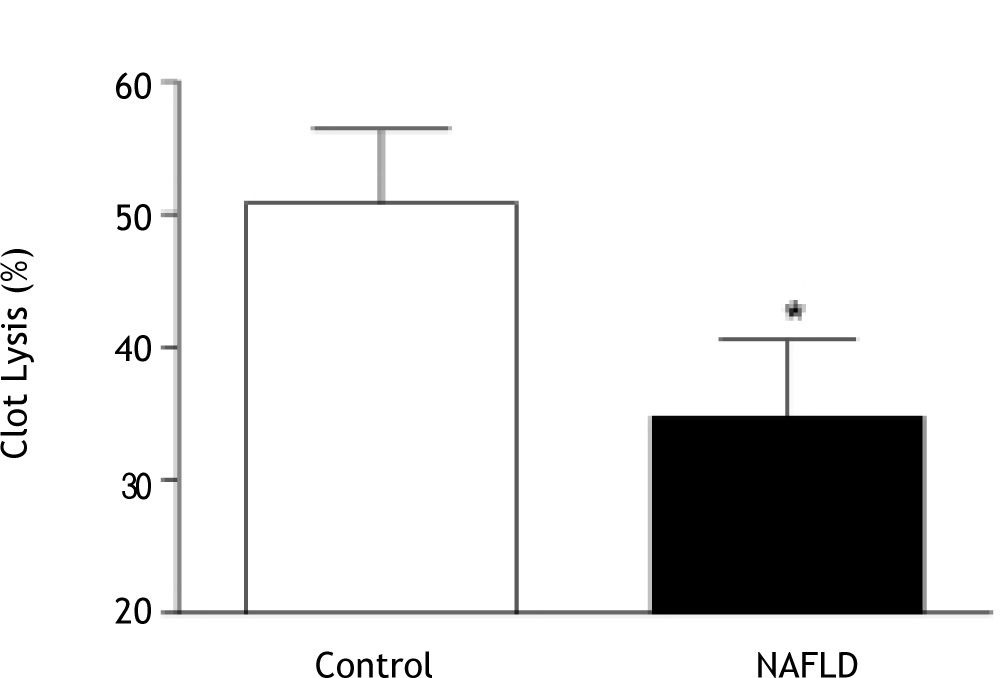
Compared to controls, clot kinetics were significantly altered in patients with NAFLD, with greater clot strength (MA; 58.3 ± 6.3 mm vs. 52.0 ± 10.1 mm, p = 0.01; Figure 2) and reduced clot lysis (35 ± 30% vs. 51 ± 26% clot lysis 30 minutes after MA in the presence of t-PA, p = 0.03; Figure 3). The presence of type 2 diabetes or the metabolic syndrome had no impact on clot strength (p = 0.24 and p = 0.57 respectively) or lysis (p = 0.48 and p = 0.24 respectively) in NAFLD patients.


There was no change in clot strength (p = 0.86) or lysis time (p = 0.96) across increasing grades of steatosis in patients with NAFLD, nor were there differences in these parameters in patients with (n = 7) and without (n = 11) NASH in the 18 patients who underwent liver biopsy (p = 0.55 and p = 0.97 respectively).
MA was significantly associated with BMI in patients with NAFLD (r = 0.55, p = 0.002) but not in controls (p = 0.15). In patients with NAFLD, MA was significantly correlated with waist circumference (r = 0.45, p = 0.02) but not with other features of the metabolic syndrome, including systolic (p = 0.70) and diastolic (p = 0.83) blood pressure, fasting glucose (p = 0.58), HDL cholesterol (p = 0.35) or triglycerides (p = 0.63).
There was a strong positive relationship between plasma fibrinogen and MA in controls (r = 0.62, p = 0.004) and a multivariate regression analysis which included age, gender and fibrinogen explained 53% of the variation in MA in lean subjects (R2 = 0.532, p = 0.01). In patients with NAFLD, adding BMI to this same model explained 52% of the variation in MA and BMI maintained a strong unique contribution to the variation in MA in addition to that of fibrinogen (BMI β = 0.47, p = 0.005; fibrinogen β = 0.47, p = 0.005). This independent effect of BMI on MA in NAFLD, above that of increased fibrino-gen, could not be statistically explained by any BMI-related CVD risk factor such as blood pressure, HDL cholesterol or triglycerides when they were separately added to the multivariate regression model.
Clot lysis was not correlated with individual features of the metabolic syndrome in either controls or patients with NAFLD.
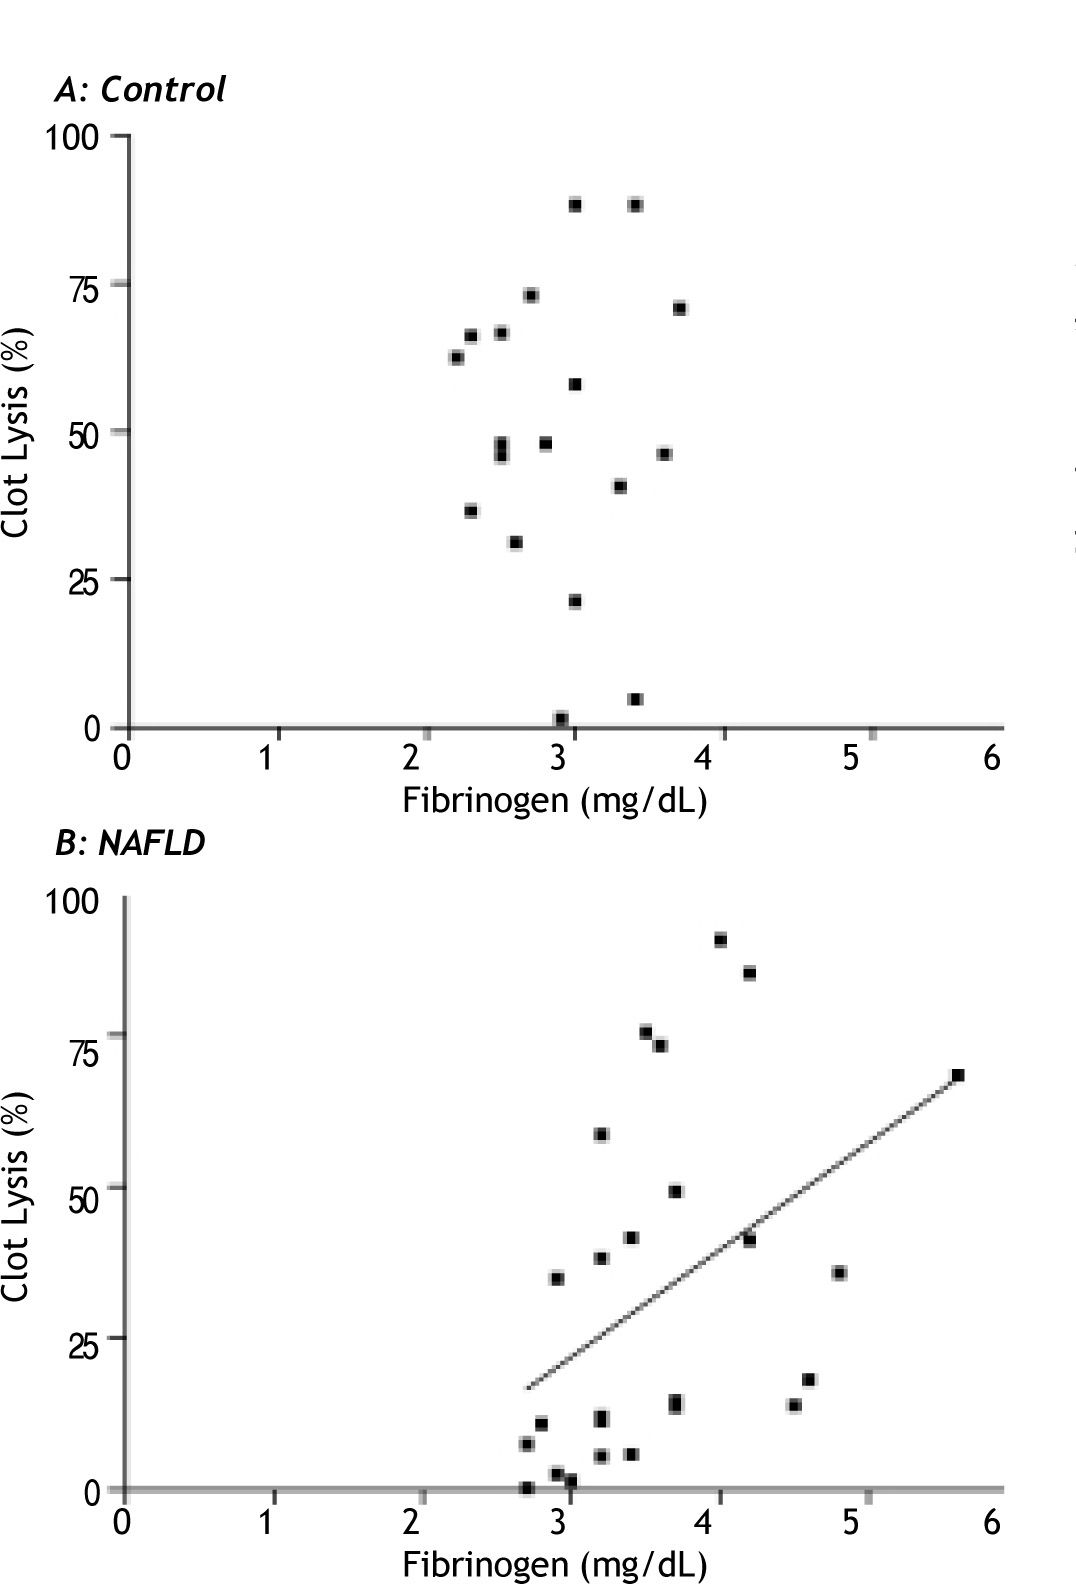
Fibrinogen had a strong positive relationship with clot lysis in the NAFLD group (rs = 0.52, p = 0.006), which was not seen in the controls (p = 0.96) (Figure 4a and 4b). This positive relationship was maintained in patients with NAFLD after multivariate analysis corrected for age, gender, waist circumference and the presence or absence of diabetes (β = 0.51, p = 0.02).
Platelet contribution to clotting but not in lean controls (p = 0.96).")
When the platelet contribution to clot development was attenuated by the addition of abciximab, MA was not different between the control and NAFLD groups (MA abciximab 18.7 ± 4.7 mm vs. 19.6 ± 5.6 mm respectively; p = 0.43) suggesting differences in platelet activity may be responsible for the variation in MA seen between control subjects and patients with NAFLD during baseline TEG measurements.
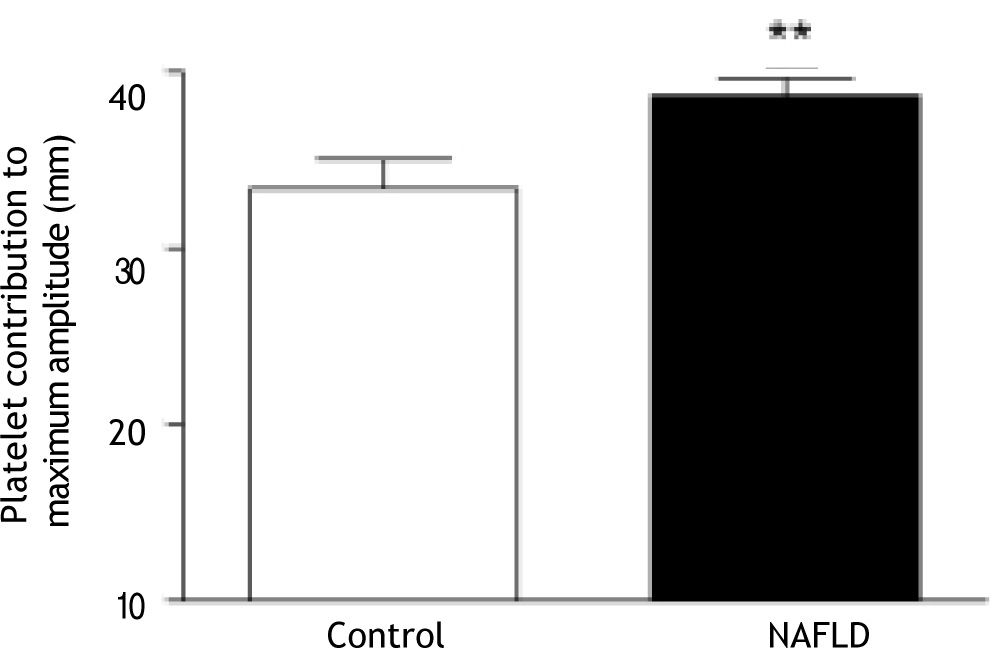
Platelet contribution to clot strength can be calculated as a function of maximum amplitude of clot formation in the TEG (MA recalcification-MA abciximab). Clots from patients with NAFLD showed a greater platelet contribution to MA than those from controls (38.7 ± 5.2 mm vs. 33.4 ± 7.8 mm, p = 0.006; Figure 5).

The contribution of platelets to clot strength was positively associated with waist circumference in NAFLD (rs = 0.49, p = 0.01). However, this relationship was not seen in controls (p = 0.26). Platelet contribution to clot strength was not associated with individual features of the metabolic syndrome, and not affected by the presence or absence of the metabolic syndrome in NAFLD (p = 0.58).
DiscussionPatients with NAFLD have disturbances in ex vivo clot kinetics when compared to healthy controls including increased clot strength and slower clot lysis in the presence of t-PA. Altered clot kinetics in NAFLD were not related to the severity of liver injury in this study population but rather to the degree of obesity. This relationship between clot kinetics and NAFLD appears to be related to changes in platelet function and is independent of classical cardiovascular risk factors which occur in the setting of obesity such as features of the metabolic syndrome.
In advanced liver disease there are increased bleeding tendencies. However, the data from the current study demonstrate that prior to the onset of cirrhosis, patients with NAFLD are hypercoaguable, have hyperactive platelets and may be at risk of thrombo-tic disorders in the event of induced clotting activity such as surgery, injury or atherosclerotic disease.
Fibrinogen is likely to explain a significant proportion of clot strength as measured by TEG maximum amplitude (MA). However, in patients with NAFLD, there was an additional independent effect of BMI on this measurement of clot strength above that of fibrinogen which was not explained by any of the classical metabolic risk factors measured in this cohort. It has previously been demonstrated that platelet activity and lipid composition is influenced by the lipid composition of the milieu.36 Excess flow of free fatty acids arising from dysfunctional/insulin resistant adipose tissue in patients with NAFLD may have played a role in our observations.37 Interestingly, in the NAFLD group, fibrinogen was also positively associated with clot lysis; the higher the fibrinogen, the more effective the clot lysis. This may reflect the physiologic parallel increase in lysis with a prothrombotic state which is mediated by proteins such as thrombin-activatable fibrinolysis inhibitor (TAFI).38 This positive association of fibri-nogen with lysis was not seen in controls suggesting that there may be alternative activation of lysis particular to NAFLD.
We found evidence that platelets play a role in linking obesity with increased clot strength in NAFLD however this was not due to differences in platelet count. When the platelet contribution to clots was removed with abciximab, clot strength was not different between NAFLD and controls.
The tendency for platelets to hyper-aggregate is thought to be due to sensitivity of platelets to activation induced by collagen and ADP. With central obesity there is a reduced ability of cyclic nucleotides to inhibit platelet aggregation.39 The thrombin-induced platelet activation, which is a major step in the coagulation cascade, is enhanced by VLDL and LDL, whilst HDL inhibits this thrombin-induced activation process.40 Patients with triglyceride rich particles in plasma show marked increase in markers of platelet activation such as P-selectin and CD63, in vivo.41
There were no trends to indicate that changes in TEG measured clot kinetics were associated with histological severity of liver injury. This is in keeping with studies that show NAFLD has increased cardiovascular risk compared to other liver diseases with equivalent liver injury such as chronic HCV,42,43 and suggests that increased cardiovascular risk in NAFLD is due to an obesity-related metabolic dysfunction rather than liver injury itself. While our data demonstrates a strong effect of BMI on clotting kinetics, it did not identify an additional independent effect of the classical CVD risk factors on clot strength or lysis. This is in keeping with recent reports of independent effects of NAFLD on CVD12 and more sophisticated measures of insulin resistance and/or inflammation may be necessary to explore further.
A possible mechanism linking obesity and clot kinetics is changes to other prothrombotic cytokines such as PAI-1 and hs-CRP.12 These were not measured in the current study but have been demonstrated to be increased in obesity and NAFLD.4,44 Prothrombotic PAI-1 is produced by visceral adipocytes and are closely associated with visceral adiposity in NAFLD4 and is also linked to the severity of steatosis and insulin resistance in humans and in mouse models of obesity.44 In addition, its association with the metabolic syndrome and type 2 diabetes45 makes PAI-1 an interesting area for the further investigation into its potential effects on clotting kinetics in NAFLD.
Under normal conditions (lean healthy people), insulin is an antithrombotic agent, however in obesity, these actions are impaired. Insulin can have a direct effect on stimulating coagulation factors and fibrinogen and insulin receptors are found on platelets.46 Insulin at physiological doses attenuates crucial steps in arterial thrombus formation, including the inhibition of platelet-collagen and subsequent platelet-platelet interactions in healthy subjects.47 These antithrombotic effects are defective in obesity and could provide a mechanism linking insulin resistance to atherothrombotic vascular disease.47 The NAFLD cohort had significant hyperinsulinemia which may contribute to changes in platelet function during clotting and lysis.
A weakness of this study is that no patient in the control group had a liver biopsy to exclude undetected steatosis however, our inclusion criteria required all controls to have normal liver enzymes, no hepatomegaly and no metabolic syndrome therefore reducing the risk for hepatic steatosis. It is unethical to perform liver biopsy for research purposes on patients at low risk for liver disease. The effect of undetected steatosis in the control group would be to weaken any detectable differences between groups in the study.
In conclusion, the current study shows that clots are stronger overall, and slower to lyse in patients with NAFLD. This may contribute to increased CVD risk. Changes to clot kinetics are strongly linked with obesity but are independent of the classical obesity-related cardiovascular risk factors associated with the metabolic syndrome and therefore alternative mechanistic pathways should be explored.
AcknowledgementsThe authors would like to acknowledge the valued assistance of Ms. Anais D’Arcy, Ms. Manuela Trabi, Dr. Goce Dimeski, Ms. Connie Salona and Ms. Victoria Byrnes during the course of the study.
Abbreviations- •
CVD: Cardiovascular disease
- •
NAFLD: Non-alcoholic fatty liver disease
- •
BMI: Body mass index
- •
PAI-I: Plasminogen activator inhibitor-1
- •
TEG: Thromboelastograph
- •
HOMA-IR: Homeostatic model of assessment - Insulin resistance
- •
NASH: Non-alcoholic steatohepatitis
- •
MA: Maximum amplitude
- •
LY30: Percent lysis after 30 mins
- •
HDL: high density lipoprotein
- •
ALT: Alanine transaminase
- •
HCV: Hepatitis C virus
IH is funded by a National Health and Medical Research Council (NHMRC) Australian Clinical Research Fellowship. CS is funded by a Pfizer Cardiovascular Lipid Fellowship and a Diabetes Australia Research Trust Grant. A proportion of patients included in this study were recruited from a large clinical intervention study funded through the NHMRC Centre for Clinical Research Excellence (CCRE), Brisbane, Australia.


