


Non-Alcoholic Fatty Liver Disease (NAFLD) is linked to obesity and metabolic syndrome, but increasing evidence also implicates environmental toxins. In this study, we aim to show that in elevated blood Lead levels in NAFLD patients result in worsening liver fibrosis.
Materials and methods30,172 patients from NHANES 2011–2016 met inclusion criteria. 2499 patients ages 20–74 were identified with NAFLD as determined by the Fatty Liver Index score, and 425 with advanced liver fibrosis were identified using the NAFLD Fibrosis Score. Simple linear regression, Student's T-test, and Rao-Scott Chi-Square test was used for continuous and categorical variables. Multivariate regression analysis was used to adjust for confounders to determine odds of Advanced Fibrosis.
ResultsIncreased serum Lead level was independently associated with increased risk of Advanced Fibrosis (OR 5.93, 95% CI 2.88–12.24) in the highest Lead quartile (Q4). In subgroup analysis stratified by BMI, a significant association between advanced liver fibrosis and blood Lead levels was consistently present, Q4 (OR 5.78, 95% CI 0.97–33.63) and Q4 (OR 6.04, 95% CI 2.92–12.48) in BMI <30 and >30, respectively. Increased Lead exposure was also evident in patients who were older, less educated, male, and drank alcohol and smoked tobacco.
ConclusionsOur findings show that advanced liver fibrosis is up to six times more likely in NAFLD patients with increased Lead exposure.
The rate of NAFLD is increasing in the United States, and progression of this disease is associated with liver fibrosis, cirrhosis, and malignancy [1]. NAFLD is associated with a wide spectrum of extra-hepatic diseases including cardiovascular disease, malignancy, thyroid dysfunction and diabetes [2]. Recent studies have found associations between environmental exposures such as aflatoxin, asbestos, metals, and air pollution with NAFLD [3].
Lead (Pb) is an environmental exposure found in construction sites, plumbing, batteries, paints, and gasoline [4]. While our understanding of Pb toxicity has led to significantly decreased exposure in recent years, chronic low-level exposure still remains a public health issue. Prior studies have evaluated the many health risks associated with Pb exposure, including effects on the central nervous system, cognition, neurobehavioral dysfunction, kidney, and hematologic diseases [5]. However, the relationship of Lead exposure in NAFLD patients and fibrosis progression into cirrhosis has not been studied.
It is believed that Pb exposure increases oxidative stress and overproduction of reactive oxidation species and, therefore, may lead to the pathogenesis of NAFLD [10–12]. It has previously been shown that Lead exposure is linked to perturbations of synthetic liver function and elevations in liver biomarkers such as alanine aminotransferase and aspartate aminotransferase [13,14]. An epidemiological study in China demonstrated that higher Lead exposure is correlated with increased NAFLD risk [15]. However, no prior studies have examined progression of liver fibrosis in NAFLD patients exposed to Lead.
This study seeks to explore the effect of Lead exposure in NAFLD patients on the progression of liver fibrosis. Advanced liver fibrosis and cirrhosis is related to liver failure, increased mortality, malignancy, and decompensation. Therefore, this study has potentially important clinical implications.
2Materials and methods2.1NHANES datasetThe National Health and Nutrition Examination Survey (NHANES) is a nationally representative survey of the civilian, noninstitutionalized United States population. The survey, implemented by the National Center for Health Statistics, follows a complex, stratified, multistage probability design consisting of interviews, physical examinations at home or at a mobile examination center and laboratory testing. Surveys are conducted in two-year cycles. For this study, we combined three cycles, 2011–2012, 2013–2014, and 2015–2016, to create a 2011–2016 dataset. Further information about the datasets and the sample design can be found elsewhere [16].
2.2Study population30,172 patients from NHANES were used for study eligibility. 16,210 patients were below the age of 18 and excluded, and 8346 were excluded due to acute transaminitis (AST or ALT>500IU/L), excessive alcohol consumption (>10drinks/week for females and >20drinks/week for males), iron overload (transferrin saturation>50%), and positive hepatitis B or C serology. We included individuals with data on blood lead, data on variables needed to calculate the Fatty Liver Index and NAFLD Fibrosis Score as well as data on potential confounders. A total of 2499 non-pregnant individuals ages 20–74 with NAFLD (as determined by a Fatty Liver Index score≥60) were included in this study. 425 patients were found and included with advanced fibrosis (as determined by NAFLD Fibrosis Score >0.676).
NAFLD was defined as a Fatty Liver Index (FLI) greater than or equal to 60. FLI is a well-validated score using an equation comprised of body mass index (BMI), waist circumference, GGT, and triglycerides used to stratify individuals into low, intermediate, and high risk of fatty liver. Approximately 44% of the NHANES sample had NAFLD according to the FLI score (after application of other exclusion criteria).
Our primary outcome of interest was advanced liver fibrosis as determined by the validated NAFLD Fibrosis Score (NFS). Briefly, the NFS score was developed using a logistic regression model to help risk stratify individuals with severe fibrosis versus minimal risk of fibrosis. The score incorporates age, BMI, fasting glucose, AST, ALT, platelet count, and albumin. A score above 0.676 signifies severe fibrosis or cirrhosis of the liver. A score between −1.455 and 0.675 was deemed intermediate fibrosis, and a score <−1.455 was termed low fibrosis. In this study, we used 0.676 to create a binary variable of high suspicion of liver fibrosis vs. low suspicion of liver fibrosis [17].
2.3Variables of interestOur primary predictor of interest was blood Lead levels. From 2011 to 2012, blood lead levels were measured for all adults included in the NHANES sample. For the 2013–2014 and 2015–2016 cycles, blood lead was only measured for a random one-half subsample of adults. To adjust for these year-to-year changes, and to produce nationally representative estimates, appropriate weights were applied during statistical analysis. Blood lead levels were determined in NHANES using inductively coupled mass spectrometry. The lower limit of detection for blood lead was 0.25μg/dl in 2011–2012 and 0.07μg/dl from 2013 to 2016. Values were imputed for analytes whose blood lead concentration could not be detected. Detailed information about the preparation of samples and protocols are available elsewhere [16]. Blood lead levels were categorized into evenly distributed quartiles representative of the population cohort (<0.635μg/dl, 0.635–1.01μg/dl, 1.02–1.62μg/dl, >1.62μg/dl).
Covariates were selected a priori based on known confounders from previous literature and clinical experience. These covariates included (1) demographic factors: age, sex, race/ethnicity, (2) socio-behavioral factors such as alcohol consumption (grams/day), smoking status as per serum cotinine levels, poverty-income ratio and education level (>high school education, high school education,ng/ml), moderate (0.015–3ng/ml), and high levels (>3ng/ml).
2.4Statistical analysisTo compare baseline characteristics among blood Lead quartiles, we used one-way ANOVA for continuous variables and Rao-Scott Chi-square tests for categorical variables followed by post-hoc pairwise comparisons between quartiles using Tukey's multiple comparison test for means.
To determine the association between blood lead quartiles and liver fibrosis, a sequential series of four nested multivariable logistic regression models (using PROC SURVEYLOGISTIC) were formed adjusting for factors one by one. Variables that were used to calculate the NAFLD fibrosis score were not incorporated as potential confounders to prevent falsely elevated odds ratios for those corresponding confounders and falsely null odds ratios for blood Lead quartiles.
We stratified the logistic regression analysis by obesity status (BMI>30kg/m2) using Model 4 in order to assess the effect modification of excess adipose tissue on the association between blood lead levels and liver fibrosis.
All analyses utilized weights to produce nationally representative estimates and account for the oversampling of minorities (elderly, African-Americans and Mexican-American) as well as the special sampling scheme for blood lead levels. Analyses also accounted for the complex survey design with strata and cluster variables using a traditional Taylor linearization approach to obtain accurate variance estimates. Analyses were conducted using SAS 9.4 with a significance level of 0.05.
3Results3.1Characteristics of the study populationThis study analyzed data from NHANES 2011 through 2016 of 2499 non-pregnant individuals ages 18 through 74 with NAFLD defined by FLI (Fig. 1). The mean age was 52.5 years.

The subjects included in the study were stratified into four quartiles by blood lead levels. Mean Quartile 1–4 Blood Lead levels (μg/dL) were (0.44, 0.83, 1.29, 2.99, respectively, p<0.0001), and the mean Lead level was 1.01μg/dL. The baseline characteristics of the subjects in each of these quartiles can be seen in Table 1. Subjects with increased serum Lead level were older, male predominant, less educated, had increased alcohol consumption, and smoking levels compared to those in the lowest quartile (all p<0.05). These patients also had a higher prevalence of hypertension, increased total cholesterol, HDL, decreased waist circumference and BMI, and lower ALT levels compared to subjects in the lower quartiles (all p<0.05). No clinically significant trends were observed for diabetes, triglycerides, LDL, and AST level. No clinically significant differences were observed in race/ethnicity and poverty status.
Baseline characteristics of study subjects stratified by blood lead level (quartiles 1–4).
| Lead level | |||||
|---|---|---|---|---|---|
| Variables | Quartile 1 (<0.635) | Quartile 2 (0.635–1.01) | Quartile 3 (1.01–1.62) | Quartile 4 (>1.62) | p value |
| n=611 | n=667 | n=628 | n=593 | ||
| Demographic and clinical parameters | |||||
| Age (years) | 41.0 (0.8) | 51.9 (0.7) | 57.1 (0.6) | 60.0 (0.9) | <0.0001 |
| Female gender | 398 (62%) | 345 (47%) | 272 (38%) | 199 (30%) | <0.0001 |
| Race/ethnicity | |||||
| Non-Hispanic White | 227 (63%) | 296 (73%) | 236 (66%) | 255 (72%) | 0.0003 |
| Non-Hispanic Black | 141 (13%) | 141 (8.8%) | 168 (12%) | 136 (10%) | |
| Mexican American | 111 (12%) | 96 (7%) | 88 (8%) | 88 (8%) | |
| Other Hispanic | 84 (8%) | 79 (6%) | 73 (6%) | 50 (4%) | |
| Multiracial or other | 48 (5%) | 55 (5%) | 63 (8%) | 64 (6%) | |
| Education level | |||||
| 117 (13%) | 155 (15%) | 169 (20%) | 174 (22%) | 0.0018 | |
| High school | 116 (20%) | 150 (23%) | 151 (23%) | 147 (26%) | |
| >High school | 335 (66%) | 351 (62%) | 304 (57%) | 271 (52%) | |
| BMI (mean SE) | 35.9 (0.4) | 34.5 (0.4) | 33.2 (0.4) | 31.9 (0.3) | <0.0001 |
| Diabetes | 100 (13%) | 144 (16%) | 105 (15%) | 109 (13%) | 0.31 |
| Hypertension | 95 (14%) | 120 (14%) | 163 (24%) | 177 (26%) | <0.0001 |
| Waist circumference (cm) | 113.9 (0.7) | 113.3 (0.7) | 111.9 (0.8) | 109.9 (0.6) | 0.0002 |
| Metabolic syndrome | |||||
| PIR | 2.8 (0.1) | 3.1 (0.1) | 3.1 (0.1) | 2.8 (0.1) | 0.015 |
| Systolic blood pressure (mmHg) | 121.6 (0.7) | 124.4 (0.8) | 127.7 (0.9) | 128.7 (1.1) | <0.0001 |
| Diastolic blood pressure (mmHg) | 72.4 (0.7) | 71.8 (0.7) | 71.9 (0.6) | 72.6 (0.9) | 0.77 |
| Alcohol consumption | 1.20 (0.03) | 1.33 (0.04) | 1.40 (0.04) | 1.42 (0.04) | <0.0001 |
| Laboratory parameters | |||||
| Smoking (cotinine levels) | |||||
| High | 80 (14%) | 120 (18%) | 129 (19%) | 155 (28%) | <0.0001 |
| Moderate | 266 (38%) | 258 (44%) | 206 (34%) | 180 (38%) | <0.0001 |
| Low | 265 (49%) | 289 (39%) | 292 (47%) | 257 (35%) | <0.0001 |
| Mean blood lead level | 0.44 (0.01) | 0.83 (0.01) | 1.29 (0.01) | 2.99 (0.15) | <0.0001 |
| Fasting glucose (mg/dL) | 114.7 (3.1) | 120.9 (3.6) | 111.8 (2.4) | 114.7 (2.4) | 0.15 |
| HbA1c | 5.84 (0.04) | 6.02 (0.05) | 6.01 (0.05) | 5.92 (0.05) | 0.011 |
| Hemoglobin | 13.9 (0.1) | 14.3 (0.1) | 14.4 (0.1) | 14.7 (0.1) | <0.0001 |
| Total cholesterol (mg/dL) | 189 (2) | 195 (2) | 197 (2) | 200 (2) | 0.0011 |
| Triglycerides | 203 (8) | 213 (8) | 214 (7) | 211 (6) | 0.49 |
| HDL | 44.7 (0.6) | 45.2 (0.6) | 46.3 (0.6) | 46.8 (0.7) | 0.002 |
| LDL | 110 (3) | 114 (4) | 118 (4) | 118 (4) | 0.11 |
| GGT | 34.3 (3.0) | 31.1 (1.1) | 32.2 (1.9) | 34.9 (2.4) | 0.46 |
| ALT | 29.4 (0.7) | 29.1 (0.9) | 26.9 (0.8) | 26.9 (0.7) | 0.0234 |
| AST | 25.7 (0.5) | 25.8 (0.5) | 25.3 (0.5) | 26.2 (0.5) | 0.58 |
| Fibrosis panels | |||||
| NFS (mean value, SD) | (-1.52) (0.08) | (-0.99) (0.07) | (-0.71) (0.07) | (-0.67) (0.07) | <0.0001 |
NFS showed significantly greater fibrosis scores with increasing Lead exposure in Q1–Q4 (−1.52, −0.99, −0.71, −0.67, respectively, p<0.0001).
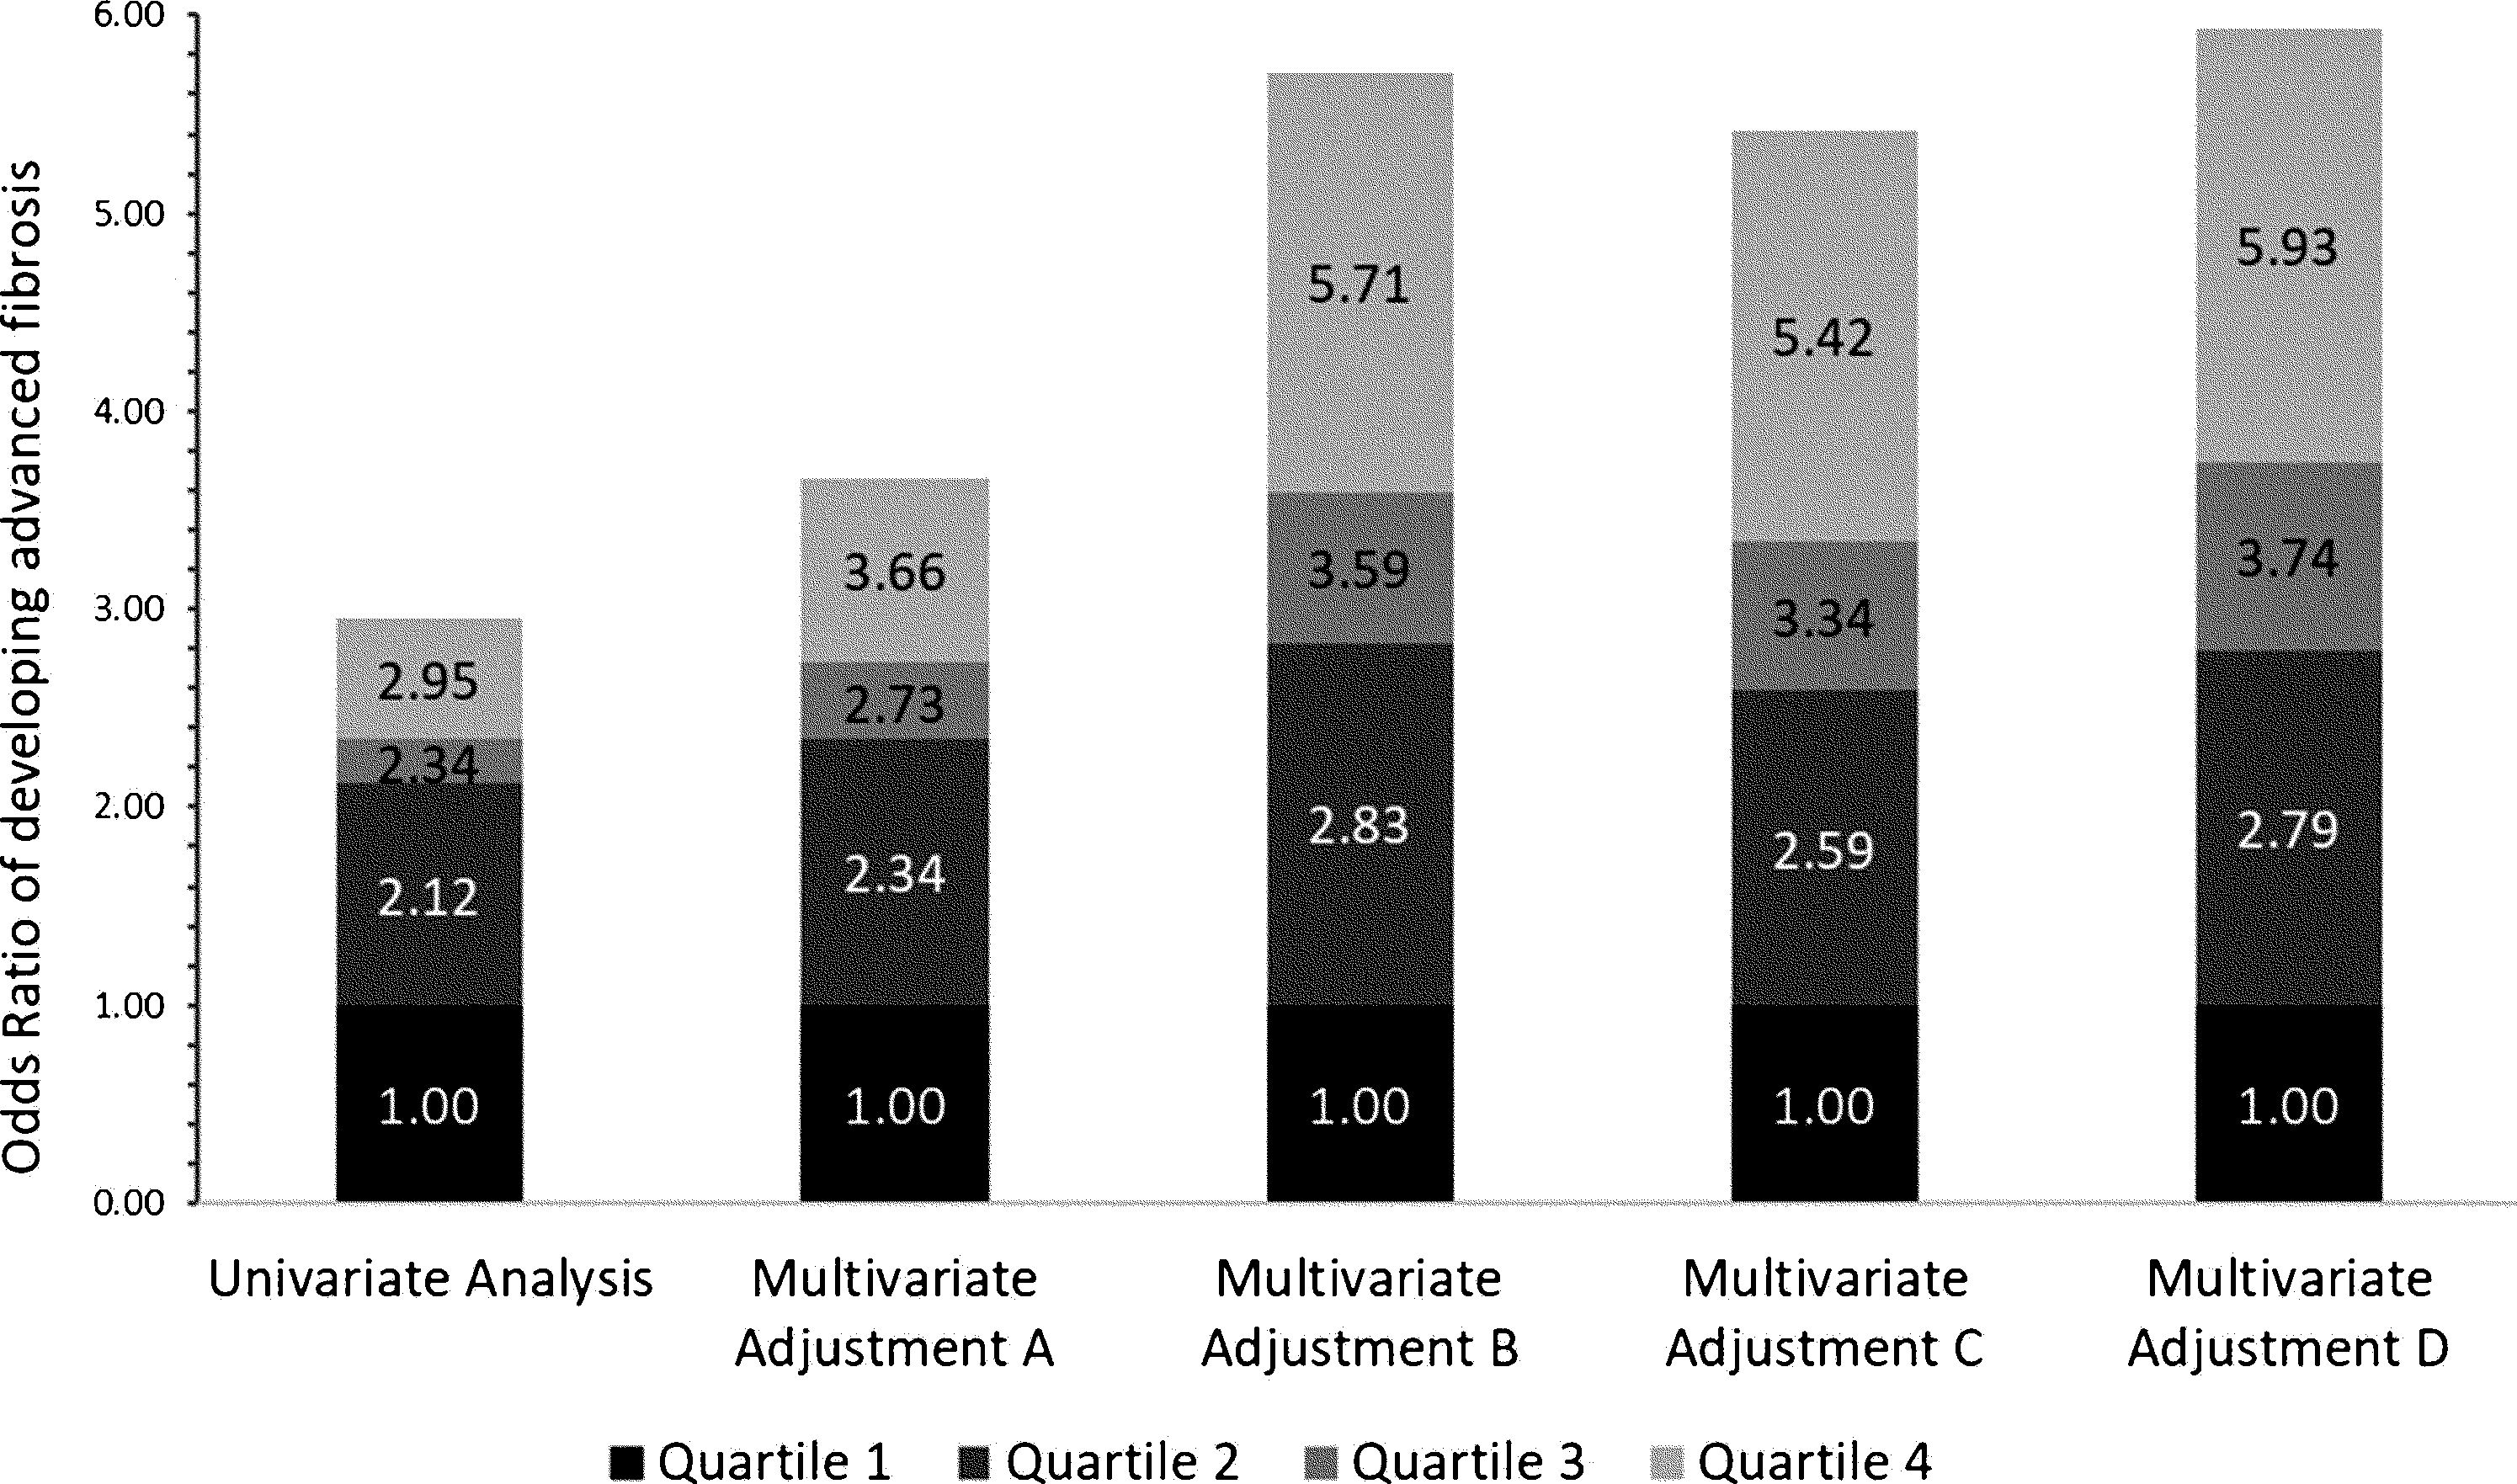
3.2Independent association between advanced fibrosis and blood lead levels in patients with NAFLDPatients with higher blood Lead levels had increased risk of advanced liver fibrosis. Multiple multivariate logistical regression models were created to remove potential confounding factors in the baseline characteristic analyses demonstrated in Table 1. Table 2 and Fig. 2 demonstrate the four main multivariate logistical regression models. Model A was adjusted for patient demographic factors, including age and gender. Model B was adjusted for the same patient demographics as Model A, as well as clinical parameters, including waist circumference and hypertension. Model C was adjusted for Model B, as well as key laboratory parameters, including liver function tests, hemoglobin A1c, and triglycerides. Model D was adjusted for all of the same factors as Model C, with the addition of social factors including smoking and PIR. The odds ratios of developing advanced fibrosis increased significantly with each quartile (Table 2). After adjusting for all confounding factors in Model D, the odds ratio of Advanced Fibrosis in Lead Quartile 4 was [OR 5.93 95% CI 2.88–12.24, p<0.05). These multivariate analyses demonstrate that the independent association is strengthened when all differences in baseline characteristics are adjusted (Fig. 3).
Multivariate logistical regression models of Blood Lead Level and Advanced Liver Fibrosis in patients with NAFLD.
| Analysis | Quartile 1 | Quartile 2 | Quartile 3 | Quartile 4 | p value(Wald score) |
|---|---|---|---|---|---|
| Univariate Odds Ratio | 1.00 | 2.12 (1.20, 3.73) | 2.34 (1.41, 3.89) | 2.95 (1.59, 5.46) | 0.0065 |
| Multivariate Adjustment A | 1.00 | 2.34 (1.35, 4.08) | 2.73 (1.67, 4.49) | 3.66 (2.06, 6.50) | 0.0002 |
| Multivariate Adjustment B | 1.00 | 2.83 (1.53, 5.24) | 3.59 (2.07, 6.23) | 5.71 (3.03, 10.78) | <0.0001 |
| Multivariate Adjustment C | 1.00 | 2.59 (1.39, 4.81) | 3.34 (1.96, 5.67) | 5.42 (2.89, 10.16) | <0.0001 |
| Multivariate Adjustment D | 1.00 | 2.79 (1.39, 5.63) | 3.74 (2.01, 6.96) | 5.93 (2.88, 12.24) | <0.0001 |

Odds ratios from Table 2 represented in stacked bar graph.

The patients in the four quartiles were further stratified into two groups by BMI less than or greater than 30. The independent likelihood of developing advanced liver fibrosis was similar in both groups. For BMI<30, the odds ratio of developing advanced fibrosis in Q2 was 4.58, Q3 5.31, and Q4 was 5.71 (p<0.05). For BMI>30, the odds ratio of developing advanced fibrosis followed a similar trend; Q2 was 2.65, Q3 was 3.46, and Q4 was 6.04 (p<0.05). The association of advanced fibrosis with increased Lead levels is preserved even when the influence of BMI is removed.
4DiscussionIn a United States nationwide cohort of NAFLD patients, we demonstrate that increased Lead levels in the blood is independently associated with worsening liver fibrosis. Our findings suggest elevated Pb levels were associated with up to a six-fold increased risk of liver fibrosis. While those with NAFLD have simple steatosis with favorable long-term outcomes, advanced liver fibrosis is associated with increased mortality, acute liver failure, and extrahepatic disease. Thus, we recommend that NAFLD patients at increased risk of Lead exposure be screened for Lead levels and liver fibrosis.
To date, research in Pb exposure and advanced liver fibrosis is scarce, and only two prior studies have found associations between Pb and NAFLD [14,18]. Cave et al. demonstrated that increased Lead levels were linked to ALT elevations in patients without other causes of liver toxicity [18]. They hypothesized that low-level pollution and Pb exposure led to ALT elevations and, therefore the possible development of NAFLD [18]. However, this study had limitations given that no exact definition for NAFLD was provided in their study, and other etiologies were not adequately evaluated. Zhai et al. found in China that NAFLD was directly linked to Lead exposure in a population undergoing rapid urbanization [14].
In multivariate analyses accounting for baseline subject, metabolic, laboratory, and social characteristics that were viewed as potential key confounding factors, it was found that advanced liver fibrosis was independently associated with Lead levels in patients with NAFLD. In subgroup analysis stratified by BMI, the risk of advanced fibrosis increased with higher Lead levels regardless of BMI. These results are important to note when considering public health risks in the United States. Our findings suggest that appropriate screening for liver fibrosis in patients with elevated blood Pb levels and NAFLD may be important in preventing further progression of the liver disease.
4.1Lead and socioeconomic statusOur findings demonstrate that patients with increased Lead levels were more likely to have not graduated high school and less likely to have advanced education after high school. This finding is consistent with prior studies that show socioeconomic status is a risk factor for Lead toxicity [19–22]. Childhood Lead exposure has been linked to decreased IQ, cognition, and processing, which further leads to downward social mobility. Prior studies have demonstrated that patients with concurrent alcohol and smoking habits were more likely to have increased Pb levels, and cigarettes and alcohol were modifiable risk factors of Lead exposure [23,24]. This is consistent with our findings that patients with increased alcohol consumption and smoking had increased Lead levels. Our study did not reveal statistically significant trends of Lead and race/ethnicity and income. This is likely secondary to limited sampling of the United States population in the NHANES database and the cross-sectional nature of the study. However, prior literature has shown that African Americans bear a higher burden of Lead exposure. Particularly in light of the recent water crisis in Flint, Michigan, Lead toxicity remains an important environmental social justice issue [25].
4.2Pathogenesis of lead exposure in NAFLD and advanced liver fibrosisThe exact pathogenesis of Pb exposure and NAFLD is unclear, but multifactorial involving genetic, endocrine, and oxidative stress functions. Prior studies have examined the role of environmental toxicants as endocrine-disrupting chemicals (EDCs) with a cascade of downstream metabolic effects [26–28]. EDCs bind to nuclear hormone receptors that impair lipid metabolism that may increase the propensity for NAFLD [27]. Additionally, the accumulation of Lead in the liver is known to cause oxidative imbalance [29–31]. This causes free radical damage that leads to hepatic degenerative changes and tissue damage that increases fibrosis risk [13].
In this study, we demonstrated Lead exposure is positively associated with hypertension but negatively associated with BMI and waist circumference. Advanced liver fibrosis was independently associated with elevated Pb level regardless of BMI. This suggests the pathogenesis of Pb on advanced fibrosis is multifactorial and independent of known metabolic pathways implicated in NAFLD.
4.3Clinical implicationsDespite federal regulations, low-level occupational and environmental exposure still poses a public health issue. Racial disparities, along with geographic location and socioeconomic status, have been shown to influence Lead exposure. Typical elevated Pb level is defined as greater than 5μg/dL. We show that levels as low as 0.83μg/dL (median of Quartile 2) is associated with progression of liver fibrosis. We suggest a population-based screening protocol of Lead levels for NAFLD patients that are high risk of Lead exposure (African Americans, smokers, alcoholics, and those of low socioeconomic status).
4.4LimitationsOur study had several limitations. The cross-sectional nature limits our ability to determine causality between lead exposure and fibrosis. NAFLD and liver fibrosis were not diagnosed with liver biopsy, which is needed for definitive diagnosis. FLI was used to identify NAFLD, while the validated NFS score defined hepatic fibrosis.
5ConclusionIn conclusion, we found that the risk of advanced fibrosis was independently associated with increased lead exposure in patients with NAFLD. While the exact etiology is unclear, Pb exposure may lead to oxidative stress and free radical damage that may contribute to the fibrosis seen in these patients. Chronic exposure to low Pb levels still remains a public health issue. Further studies are needed to better understand the association between lead and liver disease.AbbreviationsPb lead National Health and Nutrition Examination Survey fatty liver index NAFLD fibrosis score endocrine disrupting chemicals
This project was presented as a poster at the American College of Gastroenterology in San Antonio, Texas October 25–30, 2019.
Data availabilityThe datasets generated during and/or analyzed during the current study are publicly available at https://www.cdc.gov/nchs/nhanes/index.htm.
AuthorshipAll authors worked in all 4 aspects of authorship as per ICMJE guidelines
Financial supportThis research did not receive any specific grant from funding agencies in the public, commercial, or not-for-profit sectors.
Conflict of interestsNone.


