


Background. The nephrotoxic potential of intravenous iodinated contrast (IC) is controversial. Cirrhotic patients are often submitted to imaging procedures involving IC and small changes in renal function may have detrimental effects.
Material and methods. Retrospective analysis of hospitalized patients with elective imaging by either contrast-enhanced CT or MRI. Contrast induced acute kidney injury (CI-AKI) was diagnosed if there was either an increase of SCr by 25% or by 44 μmol/L or a decrease of estimated glomerular filtration rate by 25% by day 3.
Results. Between 2004 and 2012 152 patients (female: 30.3%, age: 60 ± 10.8 years, MELD 13 ± 6) were included in this study of which 84 (55.3%) had received IC and 68 (44,7%), who served as controls, MRI with gadolinium based contrast (non-IC). Baseline paremeters were well matched except for age (61.7 vs. 56.9) years in the IC vs. non-IC groups, p = 0.005). 15 patients (17.9%) receiving IC and 4 patients (5.9%) not receiving IC (p = 0.026) reached the composite end-point for CI-AKI. In multivariable regression analysis INR [B = 0.252 (95% CI: 0.108-0.397), p = 0.001]; IC [B = 0.136 (95% CI: 0.023-0.248), p = 0.019] and serum sodium [B = 0.011 (95% CI: 0.001-0.023); p = 0.080] were independently associated with changes of SCr. In conclusion IC may cause renal dysfunction in cirrhotic patients. Patients subjected to imaging using IC should be closely monitored.
Renal dysfunction is common in cirrhotic patients, occurring in approximately 20% of all hospitalized patients with cirrhosis and it is associated with significant morbidity and mortality.1,2 At the same time, cirrhotic patients are likely to be subjected to imaging procedures and exposed to iodinated contrast material (IC). IC has long been recognized as a potential risk factor for acute kidney injury (AKI), which, in this setting, is termed contrast-induced acute kidney injury (CI-AKI).
Portal hypertension via mechanisms involving nitric oxide causes splanchnic vasodilation resulting in reduced peripheral vascular resistance, reduced mean arterial pressure and arterial underfilling. In an effort to compensate for the reduced perfusion pressure, endogenous vasoconstrictor mechanisms are activated that result in increased renal tubular reabsorption of sodium and renal vasoconstriction. With advancing hemodynamic disturbance and neuro-humoral activation renal vasoconstriction increases until finally glomerular filtration decreases and overt renal failure develops.3 Renal failure in cirrhotic patients may occur spontaneously or may be triggered by a variety of hemodynamic stress factors such as hemorrhage, infection, overdiuresis or by drug toxicity.4,5
IC toxicity is thought to occur mainly at the outer renal medulla.6–8 This is a region with limited blood supply and intense tubular transport activity in the medullary thick ascending limb of the loop of Henle. The passage of IC further increases metabolic activity of the outer renal medulla and draws upon renal auto-regulatory mechanisms to increase blood-flow. We hypothesize that in cirrhotic patients the additional circulatory demand could overwhelm renal hemodynamic auto-regulation and trigger kidney dysfunction. Several recent studies have questioned the role of intravenous IC as a cause of renal dysfunction.9 One previous study in 31 cirrhotic patients exposed to IC in a tightly monitored surrounding did not show any untoward effect of IC on glomerular filtration rate but an increase of renal plasma flow at 48 hours after IC exposure.10 Other authors suggest that IC is a trigger of AKI in cirrhotic patients.11 Therefore, the aim of our study was to analyze retrospectively whether there is an association between IC and renal dysfunction in cirrhotic patients undergoing contrast-enhanced computed tomography or magnetic resonance imaging to investigate if IC was associated with renal dysfunction.
Material and MethodsAll CT- and MRI studies performed in our institution from January 2004 until December 2012 in cirrhotic patients were included in this study if clinical and laboratory follow-up-data with parameters of renal function were available in the hospitals patient data management system on the day of the procedure before contrast exposure and for the 7 days following. If the patient received multiple imaging procedures only the first examination recorded was used. In all IC-enhanced CT scans iomeprol (Imeron 400®) was used as contrast agent, in MRI gadolinium (Gadovist®). Demographic and clinical parameters were extracted from the electronic medical records. As renal impairment is common in cirrhotic patients and often multifactorial, we aimed at eliminating confounders by limiting our analysis to non-emergent examinations in stable patients. Patients with current infection or hemorrhage were excluded, as were patients treated in the ICU and those who underwent subsequent imaging with jodinated contrast during the following 30 days. Various clinical parameters were defined as follows: Patients were classified as diabetic if they received medical treatment for this condition, as ascitic if imaging indicated more than negligible ascites, history of alcohol consumption was registered as indicated by the patients and HCC was diagnosed if imaging results were typical (arterial hypervascularity in the arterial phase and washout in the portal phase).
For a sensitive detection of renal impairment after contrast exposition, we chose a combined endpoint established previously.12 As summarized by the KDIGO guidelines on contrast-induced acute kidney injury13 the end-point was fulfilled if there was either an increase in creatinine by 44 μmol/l or by 25% of baseline serum creatinine (SCr) or a drop in estimated glomerular filtration rate (eGFR) (as assessed by the MDRD4 equation) by 25% of base-line14 within 72 h of contrast exposure. As secondary end-points, maximum SCr values between 72 and 168 h and at day 30 were evaluated.
Statistical analysisGroup comparisons were performed between patients receiving IC and those who did not and between patients who reached the combined end-point and those who did not. Categorical baseline parameters were presented as frequencies and percentages and compared using the chi-square-test. Continuous variables were visually assessed for normal-distribution using histograms. That condition being fulfilled, t test was used to compare means and data is presented as mean ± standard deviation. Parameters that did not follow a normal distribution were compared using the Mann-Whitney U test for unrelated samples and the Wilcoxon sign rank test for paired samples, respectively. This data is presented as median (25-75th percentiles).
The association of clinical and laboratory parameters with changes of serum-creatinine between baseline and 72 h was investigated with univariate analysis of variance. Parameters unevenly distributed in the group comparisons or displaying a possible association in univariate analysis with a p < 0.100 were inserted into a multivariable regression analysis with backward exclusion (limit p < 0.100 and change of serum-creatinine as the dependent variable.
All reported P values are two-sided and have not been adjusted for multiple testing. All analyses were performed with the use of SPSS software, version 22 for Mac.
Results152 cases fulfilled the inclusion criteria, of which 84 (55.3%) had received between 70 and 120 mls (median 80 mls) of iomeprol. Routinely, diuretics were stopped before JC. Twenty patients received interventions aimed at reducing the risk for CI-AKI prior to CT-scanning: Volume loading with saline and/or human albumin solution alone (n = 16), volume therapy and theophylline and/or bicarbonate (n = 3), theophylline alone (n = 1). Among the patients receiving IC, there was no difference in the occurrence of the composite end-point for CI-AKI between patients receiving these preventive measures, and those who did not (3/20 or 15% vs. 12/64 or 18%, respectively, p = 0.702).
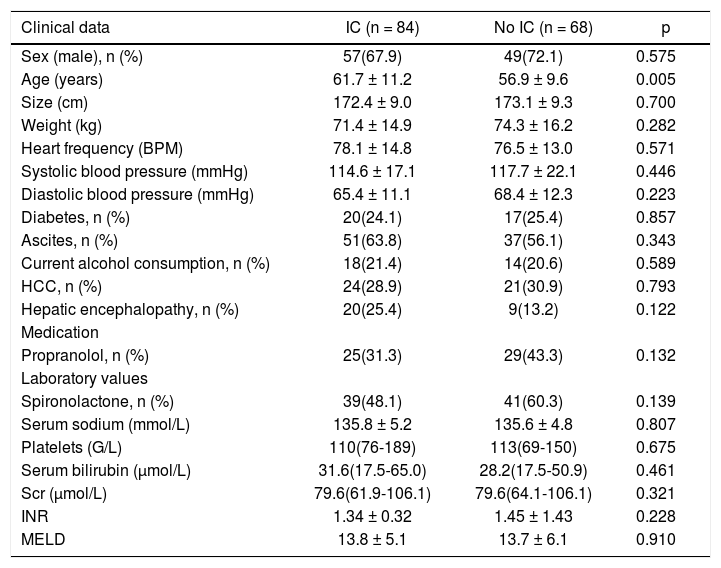
Baseline parameters of both groups (those receiving IC or not) are presented in table 1.
Baseline parameters of patients with and without iodinated contrast.
| Clinical data | IC (n = 84) | No IC (n = 68) | p |
|---|---|---|---|
| Sex (male), n (%) | 57(67.9) | 49(72.1) | 0.575 |
| Age (years) | 61.7 ± 11.2 | 56.9 ± 9.6 | 0.005 |
| Size (cm) | 172.4 ± 9.0 | 173.1 ± 9.3 | 0.700 |
| Weight (kg) | 71.4 ± 14.9 | 74.3 ± 16.2 | 0.282 |
| Heart frequency (BPM) | 78.1 ± 14.8 | 76.5 ± 13.0 | 0.571 |
| Systolic blood pressure (mmHg) | 114.6 ± 17.1 | 117.7 ± 22.1 | 0.446 |
| Diastolic blood pressure (mmHg) | 65.4 ± 11.1 | 68.4 ± 12.3 | 0.223 |
| Diabetes, n (%) | 20(24.1) | 17(25.4) | 0.857 |
| Ascites, n (%) | 51(63.8) | 37(56.1) | 0.343 |
| Current alcohol consumption, n (%) | 18(21.4) | 14(20.6) | 0.589 |
| HCC, n (%) | 24(28.9) | 21(30.9) | 0.793 |
| Hepatic encephalopathy, n (%) | 20(25.4) | 9(13.2) | 0.122 |
| Medication | |||
| Propranolol, n (%) | 25(31.3) | 29(43.3) | 0.132 |
| Laboratory values | |||
| Spironolactone, n (%) | 39(48.1) | 41(60.3) | 0.139 |
| Serum sodium (mmol/L) | 135.8 ± 5.2 | 135.6 ± 4.8 | 0.807 |
| Platelets (G/L) | 110(76-189) | 113(69-150) | 0.675 |
| Serum bilirubin (μmol/L) | 31.6(17.5-65.0) | 28.2(17.5-50.9) | 0.461 |
| Scr (μmol/L) | 79.6(61.9-106.1) | 79.6(64.1-106.1) | 0.321 |
| INR | 1.34 ± 0.32 | 1.45 ± 1.43 | 0.228 |
| MELD | 13.8 ± 5.1 | 13.7 ± 6.1 | 0.910 |
SCr: serum creatinine. HCC: hepatocellular carcinoma. INR: international normalized ratio. MELD: Model of End-Stage Liver Disease. Values presented as mean ± SD or median (25-75th percentiles).
The composite end-point for CI-AKI was reached by 15 patients (17.9%) receiving IC and 4 patients (5.9%) not receiving IC (p = .026). The mean increase in SCr in patients reaching the combined endpoint after exposure to IC was 36 ± 20 μmol.
Median (25-75th percentiles) SCr values on day 3 were 80 (62-106) μmol/L for patients receiving IC and 80 (70-97) μmol for patients receiving no IC (p = 0.810). On day 7 (n = 122) respective values were 88 (62-106) μmol/L and 80 (62-97) μmol/L (p = 0.595) and on day 30 (n = 92) 75 (62-108) μmol/L, and 84 (71-106) μmol/L (p = 0.586).
Of all patients reaching the composite end-point, 5 patients in the IC group and 1 patient in the group without IC had peak SCr-levels of 133 μmol/L or higher (p = 0.158).
30-day-mortality was 10/116 (7.9%) in patients not fulfilling the criteria for CI-AKI and 3/18 (16.7%) in those fulfilling the criteria (p = 0.227). In patients reaching a peak SCr level of 133 μmol/L or higher, 30-day-mortality was 3/6 (50%) compared to 10/138 (7.2%) in the other patients (p = 0.0003).
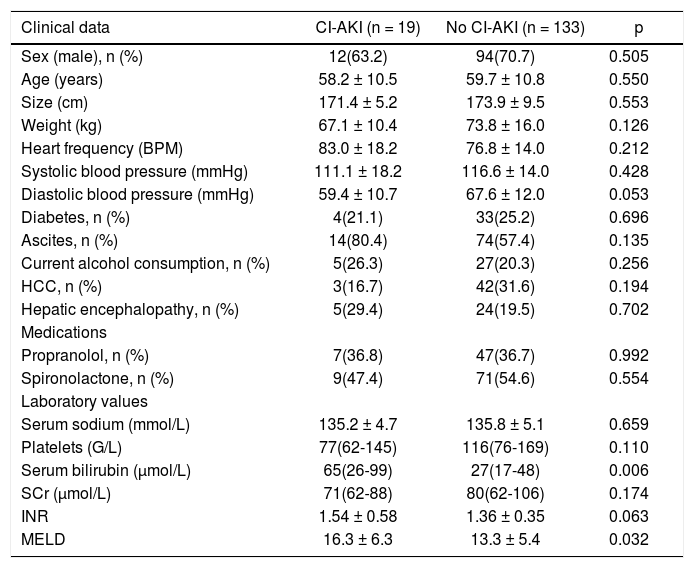
Differences at baseline between patients reaching the composite end-point and patients who did not are presented in table 2.
Differences at baseline between patients developing CI-AKI and those who did not.
| Clinical data | CI-AKI (n = 19) | No CI-AKI (n = 133) | p |
|---|---|---|---|
| Sex (male), n (%) | 12(63.2) | 94(70.7) | 0.505 |
| Age (years) | 58.2 ± 10.5 | 59.7 ± 10.8 | 0.550 |
| Size (cm) | 171.4 ± 5.2 | 173.9 ± 9.5 | 0.553 |
| Weight (kg) | 67.1 ± 10.4 | 73.8 ± 16.0 | 0.126 |
| Heart frequency (BPM) | 83.0 ± 18.2 | 76.8 ± 14.0 | 0.212 |
| Systolic blood pressure (mmHg) | 111.1 ± 18.2 | 116.6 ± 14.0 | 0.428 |
| Diastolic blood pressure (mmHg) | 59.4 ± 10.7 | 67.6 ± 12.0 | 0.053 |
| Diabetes, n (%) | 4(21.1) | 33(25.2) | 0.696 |
| Ascites, n (%) | 14(80.4) | 74(57.4) | 0.135 |
| Current alcohol consumption, n (%) | 5(26.3) | 27(20.3) | 0.256 |
| HCC, n (%) | 3(16.7) | 42(31.6) | 0.194 |
| Hepatic encephalopathy, n (%) | 5(29.4) | 24(19.5) | 0.702 |
| Medications | |||
| Propranolol, n (%) | 7(36.8) | 47(36.7) | 0.992 |
| Spironolactone, n (%) | 9(47.4) | 71(54.6) | 0.554 |
| Laboratory values | |||
| Serum sodium (mmol/L) | 135.2 ± 4.7 | 135.8 ± 5.1 | 0.659 |
| Platelets (G/L) | 77(62-145) | 116(76-169) | 0.110 |
| Serum bilirubin (μmol/L) | 65(26-99) | 27(17-48) | 0.006 |
| SCr (μmol/L) | 71(62-88) | 80(62-106) | 0.174 |
| INR | 1.54 ± 0.58 | 1.36 ± 0.35 | 0.063 |
| MELD | 16.3 ± 6.3 | 13.3 ± 5.4 | 0.032 |
SCr: serum creatinine. HCC: hepatocellular carcinoma. INR: international normalized ratio. MELD: Model of End-Stage Liver Disease. Values presented as mean ± SD or median (25-75th percentiles).
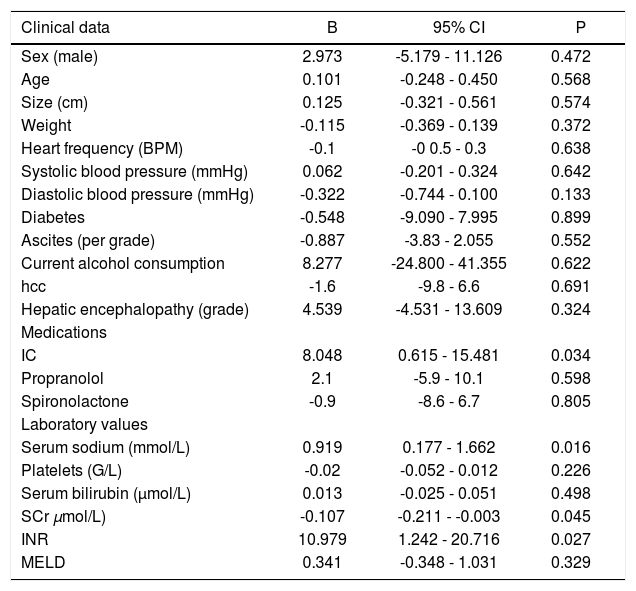
Results of univariate linear regression with changes of SCr between day 1 and day 3 as dependent variable are presented in table 3.
Univariate regression analysis with changes of SCr as dependent variable.
| Clinical data | B | 95% CI | P |
|---|---|---|---|
| Sex (male) | 2.973 | -5.179 - 11.126 | 0.472 |
| Age | 0.101 | -0.248 - 0.450 | 0.568 |
| Size (cm) | 0.125 | -0.321 - 0.561 | 0.574 |
| Weight | -0.115 | -0.369 - 0.139 | 0.372 |
| Heart frequency (BPM) | -0.1 | -0 0.5 - 0.3 | 0.638 |
| Systolic blood pressure (mmHg) | 0.062 | -0.201 - 0.324 | 0.642 |
| Diastolic blood pressure (mmHg) | -0.322 | -0.744 - 0.100 | 0.133 |
| Diabetes | -0.548 | -9.090 - 7.995 | 0.899 |
| Ascites (per grade) | -0.887 | -3.83 - 2.055 | 0.552 |
| Current alcohol consumption | 8.277 | -24.800 - 41.355 | 0.622 |
| hcc | -1.6 | -9.8 - 6.6 | 0.691 |
| Hepatic encephalopathy (grade) | 4.539 | -4.531 - 13.609 | 0.324 |
| Medications | |||
| IC | 8.048 | 0.615 - 15.481 | 0.034 |
| Propranolol | 2.1 | -5.9 - 10.1 | 0.598 |
| Spironolactone | -0.9 | -8.6 - 6.7 | 0.805 |
| Laboratory values | |||
| Serum sodium (mmol/L) | 0.919 | 0.177 - 1.662 | 0.016 |
| Platelets (G/L) | -0.02 | -0.052 - 0.012 | 0.226 |
| Serum bilirubin (μmol/L) | 0.013 | -0.025 - 0.051 | 0.498 |
| SCr μmol/L) | -0.107 | -0.211 - -0.003 | 0.045 |
| INR | 10.979 | 1.242 - 20.716 | 0.027 |
| MELD | 0.341 | -0.348 - 1.031 | 0.329 |
SCr: serum creatinine. HCC: hepatocellular carcinoma. INR: international normalized ratio. MELD: model of end-stage liver disease.
In multivariable linear regression with change in serum creatinin as dependent variable, and iodinated contrast, diastolic blood pressure, serum sodium, baseline creatinine and INR as independent variables, the stepwise backward variable exclusion revealed that INR [unstandardized regression coefficient (B) = 0.252 (95% CI: 0.108-0.397); p = 0.001]; IC [B = 0.136 (95% CI: 0.023-0.248), p = 0.019] and serum sodium [B = 0.011 (95% CI: 0.001-0.023); p = 0.080] were independently associated with changes of SCr between baseline and day 3.
DiscussionThe nephrotoxic potential of IC used to be widely accepted in the medical literature and consequently acute kidney injury after intravascular iodinated contrast material exposure has often been regarded as contrast-material induced nephropathy.15 Early studies on the subject however evaluated high-osmolar contrast media that are no longer used or arterial interventions that may lead to renal dysfunction through other mechanisms. Furthermore many clinical studies lack control groups. Therefore the association of IC with AKI may have been spurious and the clinical relevance has been questioned.9,16 More recent analyses failed to prove an association between intravenous IC and renal impairment. Paradoxically two large monocentric trials found an even higher incidence of AKI in patients undergoing unenhanced CT compared to those receiving IC.17,18 After propensity score matching, both studies found no increased risk of AKI for patients receiving IC. In subgroup analysis of patients with impaired renal baseline function, one of the studies found a higher risk for AKI after IC,17 whereas the other did not.18
In our present study cirrhotic patients receiving IC were more likely to reach a sensitive combined end-point for kidney dysfunction than patients who underwent imaging without IC, namely MRI with gadolinium-based contrast agents. As the binary combined end-point could not be approached by binary logistic regression due to the small number of events, linear regression analysis with changes of SCr between baseline and day 3 as dependent variable was performed. IC was independently associated with increases of serum creatinine in multivariable analysis. The incidence of renal impairment after IC in our study was higher than that reported in a recent meta-analysis on CI-AKI.15 As our study was a retrospective analysis, selection bias may have contributed to the difference in outcome. However groups were well matched for all analyzed baselineparameters except for age. In univariate as well as multivariate analysis age was not associated with changes in SCr.
Several risk factors for post-CT AKI in non-cirrhotic patients have been previously determined.17 Of all tested parameters only IC and INR emerged as independently associated with changes of SCr in the present study. Furthermore, serum sodium showed a trend towards an independent association with the end-point. Interestingly, other parameters associated with cirrhotic circulatory dysfunction (such as diastolic blood pressure, heart frequency and ascites) were eliminated from the analysis.
Some possible risk factors for AKI in cirrhotic patients, such as sepsis, infection or hemorrhage, have been excluded as possible confounders in our study. There were also no type 1 diabetics.
Acute kidney injury in cirrhosis may be due to a variety of mechanisms1 and it often is caused by multiple factors.19 Without further data, such as urinalysis, urinary biomarkers of tubular injury or data on tubular sodium excretion, we cannot speculate on the exact causes of renal impairment in our study. The circulatory disturbance of cirrhosis, as well as inflammatory stimulation due to by bacterial translocation, may pre-dispose cirrhotic patients to develop kidney injury. In this situation IC may merely act as a final trigger for AKI. As in our study we present a highly selected cohort of patients who are hemodynamically stable and devoid of apparent infection, the actual risk of CI-AKI may be higher in real-life patients with acute decompensation of cirrhosis.
Cirrhotic patients have a reduced muscle mass and reduced levels of SCr. SCr levels thus overestimate renal function in cirrhotic patients. Cystatin C has been proposed as a more reliable parameter of GFR.20,21 However, current consensus definitions for AKI as well as hepatorenal syndrome and of CI-AKI rely on absolute values or relative changes of SCr and the fact that absolute values of SCr did not exactly reflect GFR is of minor importance to our investigation.
There are debates concerning the amount of changes in SCr required for a diagnosis of CI-AKI and the timing of measurement. The acute kidney injury network (AKIN) proposed an absolute increase of SCr of 26.4 μmol/L or a relative increase of 50% of SCr as threshold for the diagnosis of CI-AKI, or a reduction in urine output (documented oliguria of < 0.5 mL/kg/h for > 6 h) within 48 h.22 We could not obtain reliable data on urine output for our patients, thus we had to restrict our analysis to changes in SCr. An earlier consensus statement on CI-AKI proposed a 25% relative increase of serum creatinine as a threshold for a diagnosis of CI-AKI.23 As this definition is still widely used and has been the basis of many published trials, it was also used in our study, even if the clinical relevance of such subtle changes of serum creatinine may be questioned. To reduce false-positive diagnoses of CI-AKI, we chose a higher threshold for absolute increases of SCr of 44 μmol/L, as it has been calculated that increases of 26.4 μmol/L may only be relevant of they occur within 24 h after IC.24 In the majority of cases of CI-AKI, however, SCr peaks 3-5 days after the procedure.25
There are no published studies evaluating the relationship between CI-AKI-criteria and survival in cirrhotic patients. Two recent studies, however, examined the prognostic relevance of AKIN-criteria in cirrhotic patients with various causes of kidney dysfunction. In these studies a significant reduction of survival at 90 days became evident only if kidney dysfunction resulted in peak SCr levels of 133 μmol/L and higher.26,27 In the longer term, however, even AKI with peak SCr < 133 μmol/L heralds progressive deterioration of renal function.11
Our results are not in the line of recent large retrospective analyses comparing patients undergoing contrast enhanced CT to patients undergoing non-enhanced CT.17,18 In published studies patients receiving IC are often compared to patients with unenhanced CT examinations. Unenhanced CT is an inferior imaging modality for most indications. As such it is often deliberately chosen as second best for patients thought to be at high risk of renal failure if exposed to IC. This may be a cause for selection bias due to undocumented confounders in those studies. The fact that the groups receiving no IC in these studies paradoxically had a higher incidence of renal dysfunction, a difference that was abolished after propensity score matching, gives more weight to this assumption. In our study, therefore, we chose patients with MRI examination as controls. Our cohort of patients was also relatively homogeneous which may have reduced background noise and may have facilitated the detection of small changes in renal function. Gadolinium may be even more nephrotoxic than IC in equivalent x-ray attenuating doses. However, several reports have shown that low doses such as those used for MRI are safe even in patients with renal impairment.12 Overall we believe that patients receiving MRI may be a more appropriate control group to detect the nephrotoxic potential of IC than patients receiving unenhanced CT.
The only single randomized trial of IC exposure in cirrhotic patients published so far also did not detect a decrease of average GFR. This was interpreted as evidence against an untoward effect of IC on kidney function in cirrhotic patients.10 However, average GFR was little affected in our study as well, whereas the incidence of CI-AKI was significantly higher in patients receiving IC. An explanation for this may be that the effects of IC may depend on co-factors such as the circulatory and renal predisposition of the patients. The incidence of CI-AKI is too low to be explained just by a linear dose-dependent effect. Thus, if analyzed by means of average, the deterioration of GFR in some patients may be offset by improvements in GFR in others. This does not prove that CI-AKI does not occur.
In summary, we find a higher incidence of renal dysfunction in cirrhotic patients receiving IC compared to patients undergoing gadolinium-enhanced MRI examinations. A third of these episodes resulted in peak SCr levels above 133 μmol/L. In multivariable regression analysis, IC remained associated with increases of SCr. Overall, we could not determine a significant effect of CI-AKI on mortality. In patients with peak SCr levels above 133μmol/L mortality was significantly higher than in all other patients. We conclude that cirrhotic patients exposed to IC should be closely monitored for AKI and that other triggers for AKI should be avoided around the imaging procedure. Prospective trials should corroborate this data and investigate risk factors for CI-AKI in cirrhotic patients.
Abbreviations- •
AKI: acute kidney injury.
- •
CI-AKI: contrast induced nephropathy.
- •
eGFR: estimated glomerular filtration rate.
- •
HCC: hepatocellular carcinoma.
- •
IC: iodinated contrast.
- •
INR: international normalized ratio.
- •
MDRD: modification of diet in renal disease.
- •
MELD: Model of End-Stage Liver Disease.
- •
SCr: serum-creatinine.
The authors declare no competing interest. No external funding was received for this study. All work was done with departmental funding as part of the authors’ regular employment at a university hospital.


