


Background. There is sparse literature on the association of adipose tissue with liver histology in patients with nonalcoholic fatty liver disease (NAFLD).
Aim. To study the correlation of visceral adipose tissue (VAT), subcutaneous adipose tissue (SAT) and total adipose tissue (TAT) with liver histology in Indian patients with NAFLD.
Material and methods. A single slice CT scan at the level of L4-L5 vertebrae was done to assess the abdominal VAT and SAT volumes in 21 patients with histological diagnosis of NAFLD. Adult treatment panel III criteria with modified abnormal waist were used to define metabolic syndrome (MS). Histological grading was done according to the NAFLD activity score (NAS).
Results. Twenty-one patients with NAFLD [13 males, median age: 35 years, median BMI: 25.97 kg/m2] were included prospectively. Even though overweight/obese patients had severe liver disease, there was no difference in the volume of VAT adjusted for BMI between 6 (28.5%) lean and 15 (71.5%) overweight/obese patients. Patients with NASH and borderline NASH were older, obese with higher VAT and SAT volumes than no-NASH group. SAT volume (SATV) correlated significantly with hepatic steatosis but none of the adipose tissue volumes had any correlation with other histological variables. Both SATV and TAT volume (TATV) correlated significantly with severity of liver disease as determined by NAS score whereas presence of MS or insulin resistance had no correlation with histological severity.
Conclusion. Both subcutaneous and total adipose tissue volume are related to the disease severity as determined by NAFLD activity score in Indian patients with NAFLD.
Nonalcoholic fatty liver disease (NAFLD) is a broad term consisting of patients with simple steato-sis, nonalcoholic steatohepatitis (NASH), NASH related cirrhosis and hepatocellular carcinoma (HCC) and has emerged as an important cause of unexplained rise in hepatic transaminases and cryptogenic liver disease.1-4 NAFLD is an extremely common liver disease, with a fairly high prevalence in different populations of the World.5-7 Histological severity may differ in different ethnic groups and may be dependent on several factors.8-10 Majority of patients with NAFLD have one or more components of metabolic syndrome (MS) and full blown MS is seen in 50-80% of patients.8-10 The histological severity of disease may be related to presence of metabolic syndrome or insulin resistance (IR) which is the major pathogenic mechanism in NAFLD.11,12 Insulin resistance in patients with NAFLD in turn is related to the overall increase in adipose tissue. Adipose tissue secretes several adipokines that regulate hepatic and peripheral glucose and lipid metabolism. These adipokines mainly include adiponectin, leptin, tumor necrosis factor (TNF-α) and resistin. Adiponectin and TNF-α have opposing effects on insulin sensitivity, and the balance between these adipokines may be important in the pa-thogenesis of NAFLD.13-16 Visceral adipose tissue (VAT) and subcutaneous adipose tissue (SAT) have different expression of these adipokines; SAT has predominant expression of leptin and adiponectin while VAT has predominant expression of TNF-α and interleukin 6,8.16 Because of the cytokine profile promoting insulin resistance, VAT may contribute more than SAT in the pathogenesis of NAFLD. In addition when lipolytic activity is stimulated, visceral fat releases more free fatty acids that are delivered directly to liver through portal venous system which itself promotes insulin resistance and histolo-gical severity.14,17 Still there is lack of consensus on the role of two components of adipose tissue with some studies also supporting the predominant role of subcutaneous fat in the pathogenesis of NAFLD.18
Very few studies from Asia-Pacific have investigated the relationship between adipose and histological severity.17,18 We conducted this study with an aim to assess the correlation between VAT’ SAT and total adipose tissue (TAT) with various histological variables and NAFLD activity score (NAS) in Indian patients with NAFLD.
Material and MethodsTwenty-one biopsy proven patients with NAFLD were enrolled in the study prospectively (July 2009 to July 2010). All patients gave an informed consent and study had the approval of the Institute Ethics Committee. Inclusion criteria included adult patients with alcohol intake < 20 g per day (confirmed by two family members)’ raised serum alanine tran-saminase (ALT) at least one and a half times the upper limit of normal for at least 3 months, ultrasound showing features of steatosis’ exclusion of other liver diseases (serum negative for HBsAg, anti HCV, autoimmune markers, with normal serum ceruloplasmin, negative Kayser Fleischer ring, normal serum ferritin and transferrin saturation) and liver biopsy consistent with NAFLD. Pregnant females, patients with secondary causes of NAFLD (surgery or drugs) and with evidence of ci-rrhosis on imaging or histology were excluded. Patients were classified as having overweight, obesity and central obesity as per the Asian Pacific criteria (overweight as body mass index (BMI) > 23 - < 25 kg/m2, obesity as BMI ≥ 25 kg/m2, central obesity-waist circumference > 90 cm and > 80 cm in males and females respectively).19,20 Diabetes mellitus was defined as per the WHO criteria: fasting plasma glucose (FPG) ≥ 126 mg/dL or plasma glucose ≥ 200 mg/dL or a 2 h plasma glucose on glucose tolerance test ≥ 200 mg/dL in a symptomatic patient (repeat values for asymptomatic subjects).21 Lipids were considered as abnormal if serum high density lipoprotein (HDL) was < 40 mg/dL in males and < 50 mg/dL in females and serum triglycerides (TG) were > 150 mg/dL.22 Insulin resistance was determined by the homeostasis model assessment for insulin resistance (HOMA-IR). HOMA-IR was calculated as the product of fasting insulin [μU/L, measured by chemiluminescence immunoassay (Roche Diagnostics Indianapolis)] and fasting plasma glucose (mmol/L) divided by 22.5. An absolute value of HOMA-IR > 1.64 was taken as abnormal.23,24 Metabolic syndrome was defined by the presence of at least ≥ 3 out of five modified adult treatment panel III criteria including modified abnormal waist as per the Asia Pacific criteria, FPG > 110 mg/dL or known diabetic, hypertension (blood pressure ≥ 130/ 85 mm Hg or on antihypertensive drugs), TG > 150 mg/dL and HDL < 40 mg/dL in males and < 50 mg/ dL in females.22
Assessment of VAT and SATA single slice non contrast CT was done at the level of L4-L5 vertebrae with section thickness of 5 mm and attenuation values of-30 to-190 Hounsfield units were used for adipose tissue.25 Total adipose tissue volume (TATV) was calculated by drawing a line along circumference of abdominal wall. SAT was defined as fat superficial to the abdominal and back muscles.25 Visceral adipose tissue volume (VATV) was calculated by subtracting subcutaneous adipose tissue volume (SATV) from total adipose tissue volume. CT was done in fasting state after bowel preparation to exclude the effect of intraluminal fat within a day to a maximum of 7 days after perfor-ming the liver biopsy. To exclude the effect of BMI on adipose tissue, TATV, VATV and SATV were also adjusted for BMI (TATV/BMI, VATV/BMI and SATV/BMI).
HistopathologyAll patients were subjected to a liver biopsy by a Tru cut needle (16-18G) as an inpatient procedure. Histopathological grading and fibrosis assessment was done by a single pathologist according to the NAFLD activity score (NAS) as given by Nonalcoholic Steatohepatitis Clinical Research Network.26
Statistical methodsStatistical analysis was carried out using SPSS version 13.0 for windows (SPSS Inc., Chicago, IL). Data was expressed as median and 25-75 interquartile range (IQR) and as 95% confidence interval. Frequency of metabolic syndrome and its various components was calculated. Correlations of VAT and SAT with components of MS and histological parameters and NAS score were done by Spearman’s correlation. Histological severity groups (no NASH, borderline NASH and NASH) and lean vs. overweight/ obese patients were compared using Kruskal-Wallis and Mann Whitney test.
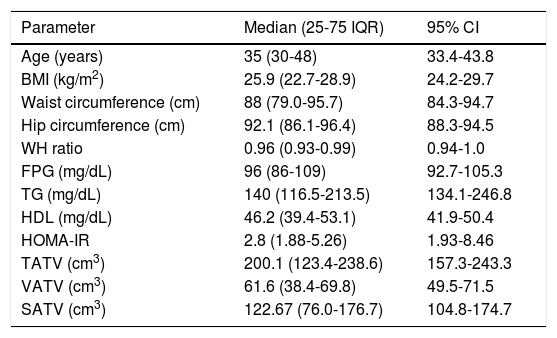
ResultsBaseline characteristics and various adipose tissue volumes in all 21 patients [13 males and 8 females, median age of 35 years] included in the study are shown in table 1.
Anthropometry, biochemical parameters and adipose tissue volumes in patients with NAFLD.
| Parameter | Median (25-75 IQR) | 95% CI |
|---|---|---|
| Age (years) | 35 (30-48) | 33.4-43.8 |
| BMI (kg/m2) | 25.9 (22.7-28.9) | 24.2-29.7 |
| Waist circumference (cm) | 88 (79.0-95.7) | 84.3-94.7 |
| Hip circumference (cm) | 92.1 (86.1-96.4) | 88.3-94.5 |
| WH ratio | 0.96 (0.93-0.99) | 0.94-1.0 |
| FPG (mg/dL) | 96 (86-109) | 92.7-105.3 |
| TG (mg/dL) | 140 (116.5-213.5) | 134.1-246.8 |
| HDL (mg/dL) | 46.2 (39.4-53.1) | 41.9-50.4 |
| HOMA-IR | 2.8 (1.88-5.26) | 1.93-8.46 |
| TATV (cm3) | 200.1 (123.4-238.6) | 157.3-243.3 |
| VATV (cm3) | 61.6 (38.4-69.8) | 49.5-71.5 |
| SATV (cm3) | 122.67 (76.0-176.7) | 104.8-174.7 |
Six patients (28.5%) had normal BMI, three (14.2%) were overweight and rest 12 (57.1%) patients were obese. Class I obesity (BMI > 25 kg/m2) was present in 8 (38%) patients and class II obesity (BMI > 30 kg/m2) was present in 4 (19%) patients. Three patients (14.2%) had diabetes mellitus (all 3 were females) and 4 patients (19%) had hypertension. Seventeen patients (80.9%) had at least one component of metabolic syndrome; ten patients (47.6%) had at least 2 components of metabolic syndrome and 5 patients (23.8%) had full blown metabolic syndrome (3 or more components). Central obesity (abnormal waist circumference) was the most common abnormality present in 12 (57.1%) patients followed by abnormal HDL in 8(38%), abnormal TG in 7 (33.3%), impaired glucose tolerance (IGT) or diabetes mellitus (DM) in 5 (23.7%) and hypertension in 4(19%) patients. Eighteen patients (85.7%) patients had abnormal HOMA-IR values suggesting the presence of insulin resistance. Female patients were significantly older [48 (39-53.75) vs. 32 (28-36) years, p = 0.004] and had higher fasting plasma glucose [103 (94-122) vs. 96 (85-102) mg/dL, p = 0.04] in comparison to male patients. There was no significant difference in anthropometric, other biochemical parameters and adipose tissue volumes between male and female patients.
Comparison of lean and overweight/obese groupPatients were divided as having lean NAFLD (BMI < 23 kg/m2) or overweight/obese (BMI > 23 kg/m2). Six patients (28.5%) had lean NAFLD and 15 (71.4%) had overweight or obesity. Other than the difference in BMI, overweight and obese patients were older, had larger waist circumference and had severe liver disease (higher NAS score) in comparison to lean patients with NAFLD (Table 2). Though adipose tissue volumes were higher in those with overweight or obesity, when the adipose tissue volumes (TAT, VAT and SAT) were adjusted for the BMI, there was no difference in the VATV/BMI in two groups. There was no significant difference in the presence of components of metabolic syndrome between two groups (Table 2).
Differences amongst lean and overweight or obese patients with NAFLD.
| Parameters | Lean NAFLD | Overweight/obese NAFLD | p value |
|---|---|---|---|
| (BMI < 23 kg/m2) | (BMI > 23 kg/m2) | ||
| n = 6 | n = 15 | ||
| Age (years) | 28(24.2-38.7) | 38(34-53) | 0.024 |
| BMI (kg/m2) | 21.7(20.9-22.6) | 27(25.6-30.1) | 0.008 |
| WC (cm) | 78.3(77.2-87.3) | 90.2(86.5-98) | 0.032 |
| FPG (mg/dL) | 102.5(87-110.5) | 96(86-104) | 0.875 |
| TG (mg/dL) | 136.5(97.2-288.2) | 141(130-171) | 0.862 |
| HDL (mg/dL) | 47.5(41.2-54.6) | 46.2(36-54) | 0.509 |
| MS | 1/6(16.6%) | 4/15(26.6°%) | 0.635 |
| HOMA-IR | 1.91(.7-3.82) | 3.43(2.24-5.5) | 0.087 |
| TATV (cm3) | 105.8(83.8-145.1) | 212.5(189-247) | 0.002 |
| VATV (cm3) | 36.3(26.8-49.68) | 65.4(59.5-85.6) | 0.008 |
| SATV (cm3) | 75.2(43.7-100.2) | 152.5(114.7-178.1) | 0.005 |
| TATV(cm3)/BMI | 4.8(3.9-6.4) | 7.8(7.1-8.9) | 0.008 |
| VATV(cm3)/BMI | 1.5(1.2-2.3) | 2.4(1.7-2.8) | 0.066 |
| SATV(cm3)/BMI | 3.4(2.1-4.4) | 4.5(5.5-6.0) | 0.008 |
| NAS | 2(1.7-4.2) | 4(3-4) | 0.036 |
Data shown as median (25-75 IQR).
NAFLD activity score (NAS) in 21 patients with NAFLD showed that nine patients (42.8%) had a steatosis score of 1, seven patients (33.3%) had a steatosis score of 2 and five patients (23.8%) had a steatosis score of 3. One patient (4.7%) did not have lobular inflammation, 10 patients (47.6%) had a lobular inflammation score of 1, 8 patients (38.1%) had a score of 2 and 2 patients (9.5%) had a lobular inflammation score of 3 and 5 patients (23.8%) with evidence of portal inflammation had a portal inflammation score of 1. Only two patients (9.5%) had he-patocyte ballooning with a ballooning score of 2. Twelve patients (57.1%) had no fibrosis, 5 patients (23.8%) had a fibrosis score of 1, 3 patients (14.2%) had a fibrosis score of 2 and only one patient (4.7%) had a fibrosis score of 3. None of the patients had histological evidence of cirrhosis (fibrosis score 4). Female patients had higher steatosis score (2.25 ± 0.7 vs. 1.54 ± 0.7, p 0.049) in comparison to male patients but there was no difference in other histological variables or NAS score between male and female patients.
Comparison of NASH and no NASH groupsAccording to NAS, patients were divided into three groups as having no NASH (score 1 or 2),borderline NASH (score 3 or 4) and NASH (score 5 or more). Four patients (19%) had no NASH, 3 patients (14.2%) had NASH and 14 (66.6%) patients were in borderline group (6 patients had a score of 3 and 8 patients had a score of 4). Even though the number of patients in the definite NASH and no NASH were small, data revealed that patients with NASH and borderline NASH were significantly older, had higher BMI and waist circumference and had higher adipose tissue volumes (TATV, VATV, SATV) than the no-NASH group (Table 3).
Differences amongst no NASH, borderline NASH and NASH group of patients.
| Parameters | Group 1 (no NASH) (n = 4) | Group 2 (borderline) (n = 14) | Group 3 (NASH)(n = 3) | p value (Kruskal Wallis Test) |
|---|---|---|---|---|
| Age (years) | 26 (22.7-28.5) | 38.5 (34.7-53.2) | 35 (30-46) | 0.007 |
| BMI (kg/m2) | 21 (20.7-22.2) | 27.5 (25.3-30.3) | 24 (22.5-27) | 0.005 |
| WC (cm) | 78.3 (76.9-87.5) | 89.3 (86.4-98.5) | 86.5 (77.5-94.5) | 0.085 |
| Waist/hip ratio | 0.95 (0.94-.97) | 0.98 (0.93-1) | 0.93 (0.89-0.96) | 0.208 |
| ALT (IU/L) | 82.3 (60.4-101.9) | 108.8 (72.2-175.2) | 117 (78-182) | 0.441 |
| FPG (mg/dL) | 92.5 (83-105.7) | 97 (92-110) | 86 (84-115) | 0.467 |
| TG (mg/dL) | 136.5 (93.2-323.7) | 144 (124.7-279.2) | 130 (103-141) | 0.442 |
| HDL (mg/dL) | 47.5 (43-51.4) | 44.75 (38.1-52.5) | 54.2 (36-62) | 0.569 |
| Hypertension | 0 | 4 | 0 | ns |
| MS | 0 | 5/14 | 0 | ns |
| HOMA-IR | 1.52 (0.68-2.68) | 3.62 (2.14-7.9) | 2.77 (1.5-5.5) | 0.120 |
| TATV (cm3) | 93.1 (71.6-122.7) | 208.2 (163.8-265.5) | 202.6 (186.0-226.5) | 0.016 |
| VATV (cm3) | 33.0 (25.91-43.45) | 64.4 (54.1-87.4) | 63.7 (48.3-69.2) | 0.042 |
| SATV (cm3) | 57 (41.3-86.8) | 151.7 (105.9-188) | 133.4 (122.6-178.1) | 0.020 |
Data shown as median (25-75 IQR).
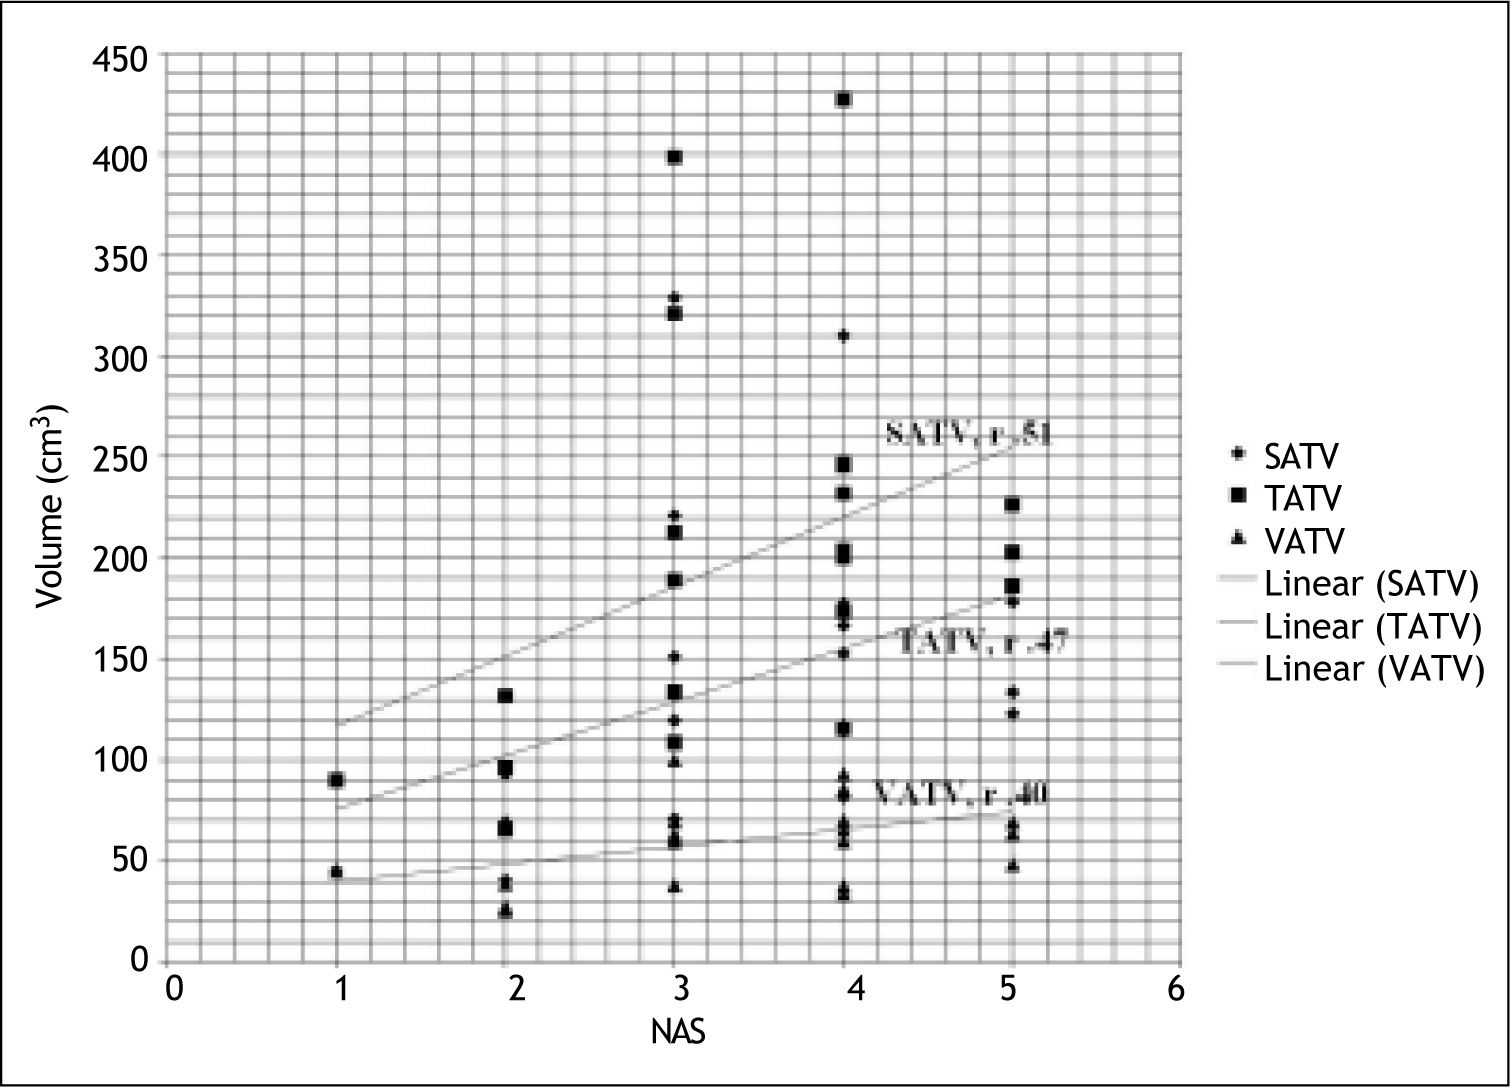
Subcutaneous adipose tissue volume correlated significantly with hepatic steatosis but none of the adipose tissue volumes had any correlation with other histological variables (lobular inflammation, ballooning and fibrosis) (Table 4). Subcutaneous and total adipose tissue volume correlated significantly with severity of liver disease (NAS score) where as visceral adipose tissue volume had no correlation with severity of liver disease (NAS score) (Table 4, Figure 1). Only patients’ age correlated significantly with hepatic fibrosis (r 0.488; p 0.025).
Correlation of histological variables with adipose tissue volumes in patients with NAFLD.
| Steatosis | Lobular inflammation | Ballooning | Fibrosis | Portal inflammation | NAS | |
|---|---|---|---|---|---|---|
| TATV | 0.41 | 0.28 | 0.00 | 0.38 | 0.27 | 0.47(.03) |
| VATV | 0.43 | 0.12 | 0.00 | 0.26 | 0.29 | 0.40 |
| SATV | 0.44 (0.04) | 0.32 | -0.05 | 0.42 | 0.25 | 0.51(.01) |
Data shown as r (p value).
 with various adipose tissue volumes.")
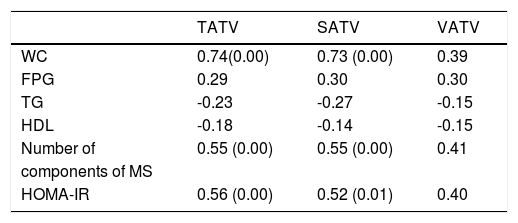
Correlations of adipose tissue volumes with metabolic syndrome are shown in table 5. TATV and SATV correlated significantly with number of components of metabolic syndrome.
Correlation of number of components metabolic syndrome, insulin resistance and adipose tissue volumes in patients with NAFLD.
| TATV | SATV | VATV | |
|---|---|---|---|
| WC | 0.74(0.00) | 0.73 (0.00) | 0.39 |
| FPG | 0.29 | 0.30 | 0.30 |
| TG | -0.23 | -0.27 | -0.15 |
| HDL | -0.18 | -0.14 | -0.15 |
| Number of | 0.55 (0.00) | 0.55 (0.00) | 0.41 |
| components of MS | |||
| HOMA-IR | 0.56 (0.00) | 0.52 (0.01) | 0.40 |
Data shown as r (p value).
Although not statistically significant; presence of metabolic syndrome was associated with more severe histological variables and higher NAS score. Overall, there was no significant correlation of metabolic risk factors or HOMA-IR with various histological variables except HDL levels, which correlated negatively with hepatocyte ballooning (r-0.468, p 0.032).
Correlation of insulin resistance with various parametersHOMA-IR values were significantly higher among patients with metabolic syndrome [10.89(5.53-22.9)] than patients without metabolic syndrome [2.43 (1.57-3.32)]. HOMA-IR also significantly correlated with body weight (r 0.572, p 0.007), waist circumference (r 0.688, p 0.001) and number of components of metabolic syndrome (r 0.722, p 0.000). HOMA-IR had no correlation with various histological variables (steatosis, lobular inflammation, portal inflammation, ballooning, fi-brosis and NAS score). HOMA-IR significantly correlated with total adipose tissue and SAT volumes (Table 5).
DiscussionIn this study we found that subcutaneous adipose tissue volume (SATV) and total adipose tissue volume (TATV) correlated significantly with severity of liver disease as determined by NAS score in patients with NAFLD. Only SATV correlated with hepatic steatosis and none of the adipose tissue volumes had any correlation with other histological variables. We also found that even though metabolic syndrome and insulin resistance correlated with SATV and TATV, these indices had no correlation with histolo-gical severity as determined by NAS score in patients with NAFLD.
According to portal hypothesis visceral adipose tissue is linked to NAFLD as it drains directly into portal venous system thus delivering FFA directly to liver combined with more lipolytic activity linked to the expression of adipocytokines promoting insulin resistance.27 VAT has also been shown to be independently associated with hepatic inflammation, fi-brosis and steatosis.17,28 On the other hand it has been shown that only about 5 to 20% of FFAs in portal venous system originate from visceral fat in lean and obese subjects respectively and majority of FFAs in portal system come from subcutaneous adipose tissue.29 As subcutaneous adipose tissue constitutes greater part of adipose tissue; theoretically it should have more impact on FFAs release and insulin resistance. In fact it has been shown that subcutaneous fat is more important than VAT in causing insulin resistance.30 As visceral fat increases disproportionately with increasing age and body weight, older age and more obese population in the earlier studies may have accounted for a significant role of VAT over SAT in determining the severity of liver disease.31-33
Very few studies from Asia-Pacific have looked at the relationship of adipose tissue with liver histology in patients with NAFLD. One of the studies from Australia that found correlation of VAT with histo-logical severity had a mean age and BMI of 51 years and 30 kg/m2 respectively in contrast to median age and BMI of 35 years and 25.9 kg/m2 respectively in the present study.17 A Japanese study (mean age: 49 years) though found that VAT played important role for steatosis and hepatic fibrosis, showed no correlation of NASH grade with VAT volume in a subset of patients with NASH.34 On the other hand a cross sectional study from Australia which looked at the relationship with only hepatic steatosis found that the severity of hepatic steatosis was associated with the body mass index, waist circumference, subcutaneous adipose tissue thickness, serum leptin level, HOMA IR score and serum ALT level in both genders, but it was associated with increasing visceral adipose tissue thickness and decreasing serum adi-ponectin levels in males alone.18 Except for the difference in age, fasting plasma glucose and hepatic steatosis (all higher in female patients), we did not find any difference in adipose volumes, metabolic syndrome or histological severity amongst male and female patients. Even though we had a small number of patients, our results suggest that SAT may also be an important determinant of histological severity in young patients with NAFLD without a very high BMI, a profile commonly seen in Indian patients with NAFLD.4,10
About one fourth of patients in the present study had normal BMI (< 23 kg/m2). Though adipose tissue volumes were higher in those with overweight or obesity, when the adipose tissue volumes (TAT, VAT and SAT) were adjusted for the BMI, there was no difference in the VATV/BMI in two groups. Hence, in spite of having low BMI, these patients had visceral fat volume comparable to those with overweight and obesity. Das, et al. compared 90 NAFLD patients (BMI < 25 kg/m2) with 134 non-obese controls without NAFLD and found that NAFLD patients had higher percentage of body fat in comparison to non obese controls.35 Results from present study are thus in concordance with Das, et al., and suggest that even if some of the NAFLD patients do not have overweight or obesity, they do have a higher visceral adipose tissue volume. Overall, we found that, overweight and obese patients had severe liver disease (higher NAS score) in comparison to lean patients with NAFLD.
In the present study we also found significant correlation of all the adipose tissue volumes (TATV, VATV, SATV) to number of components of metabolic syndrome, which suggests that, both SAT and VAT are important for development of metabolic syndrome. Our results are similar to Stacy, et al., who also found significant correlation of metabolic risk factors with both VAT and SAT.36 Liu, et al. studied 2,477 patients (participants from the Jackson heart study) and found that both VAT and SAT were associated with metabolic syndrome and it’s components.37 Recently Goel, et al. studied 100 healthy Indian non-diabetic adults (35 with metabolic syndrome) and found that SAT was a better predictor of metabolic syndrome than VAT after adjusting for body fat percentage.38 We found significant correlation of various adipose tissue volumes (Total > SAT > VAT) to HOMA-IR but on multivariate analysis, none was found to be superior to other, which suggests that both SAT and VAT contribute to insulin resistance in patients with NAFLD. Other studies have also found significant correlation of HOMA-IR with both VAT and SAT.39,40
Though there was a trend towards severe liver disease in patients with metabolic syndrome, we did not find significant correlation of individual components of metabolic syndrome or presence of metabolic syndrome with histological severity of various parameters, or overall disease severity (NAS score) in patients with NAFLD. Metabolic syndrome has been shown to be associated with hepatic steatosis and with risk of having NASH among patients with NAFLD.8 Less number of patients in the present study with low prevalence of metabolic syndrome and obesity may be the reason for not finding any correlation of metabolic syndrome with liver histology.
Our study is limited by small number of patients. Even though the patients with NASH and borderline NASH had higher adipose tissue volumes (TATV, VATV and SATV) than patients with no-NASH, in view of the small number of patients in NASH and no NASH groups, we correlated the adipose tissue volumes only with NAS score. The study also lacks a control group without NAFLD but since the study required a liver biopsy for correlating the liver histology with adipose tissue, a control group without liver disease could not be justified ethically.
In conclusion our study observed that in Indian patients with NAFLD, both subcutaneous and total adipose tissue volume are related to the disease severity as determined by NAFLD activity score and subcutaneous adipose tissue volume is also related to the degree of hepatic steatosis. Presence of MS or insulin resistance had no correlation with the histo-logical severity. A study with larger number of patients is required to substantiate the results.
AcknowledgmentNone.
Grants or Financial SupportNone.
Abbreviations- •
NAFLD: nonalcoholic fatty liver disease.
- •
VAT (V): visceral adipose tissue (volume).
- •
SAT (V): subcutaneous adipose tissue (volume).
- •
TAT (V): total adipose tissue (volume).
- •
MS: metabolic syndrome.
- •
NAS: NAFLD activity score.
- •
HOMA-IR: homeostasis model assessment for insulin resistance.
- •
WC: waist circumference.
- •
FPG: fasting plasma glucose.
- •
TG: triglycerides.
- •
HDL: high density lipoproteins.


