


Background. Several noninvasive predictive models were developed to substitute liver biopsy for fibrosis assessment.
Aim. To evaluate the diagnostic value of fibronectin which reflect extracellular matrix metabolism and standard liver functions tests which reflect alterations in hepatic functions.
Material and methods. Chronic hepatitis C (CHC) patients (n = 145) were evaluated using ROC curves and stepwise multivariate discriminant analysis (MDA) and was validated in 180 additional patients. Liver biochemical profile including transaminases, bilirubin, alkaline phosphatase, albumin, complete blood count were estimated. Fibronectin concentration was determined using monoclonal antibody and ELISA.
Results. A novel index named fibronectin discriminant score (FDS) based on fibronectin, APRI and albumin was developed. FDS produced areas under ROC curves (AUC) of 0.91 for significant fibrosis and 0.81 for advanced fibrosis. The FDS correctly classified 79% of the significant liver fibrosis patients (F2–F4) with 87% sensitivity and 75% specificity. The relative risk [odds ratio (OR)] of having significant liver fibrosis using the cut-off values determined by ROC curve analyses were 6.1 for fibronectin, 4.9 for APRI, and 4.2 for albumin. FDS predicted liver fibrosis with an OR of 16.8 for significant fibrosis and 8.6 for advanced fibrosis. The FDS had similar AUC and OR in the validation group to the estimation group without statistically significant difference. Conclusion. FDS predicted liver fibrosis with high degree of accuracy, potentially decreasing the number of liver biopsy required.
In the last decade, clinical investigators have been searching for non-invasive methods for accurate information about liver fibrogenesis activity and fibrosis stages in patients with hepatitis virus C (HCV).1 Guidelines and recommendations indicate that staging of liver fibrosis is the most important parameter for the definition of prognosis and for the subsequent management of the patient with CHC.2 Currently, the standard procedure for evaluating the degree of necroinflammation and fibrosis and for quantifying hepatic liver fibrosis remains liver biopsy. However, this is an invasive procedure with unavoidable risks and limitations including sampling error and variability.3,4 Chronic hepatitis with significant fibrosis is required to initiate the treatment in chronic viral hepatitis.5 Moreover, the decision whether to start an antiviral therapy in cases of chronic viral hepatitis is highly influenced by the staging of liver fibrosis, since treatments are usually long, costly and cause side effects.6,7 Advances in serological and radiological tests such as blood marker panels, transient elastography and their combinations can assess fibrosis accurately and reduce the need for a liver biopsy. Direct markers of liver fibrosis reflect the process of fibrogenesis such as fibronectin, hyaluronic acid, and metalloproteinases. Indirect markers reflect alterations in hepatic functions and satisfy the request for a simple and easy to perform marker such as the aspartate aminotransferase (AST)/alanine aminotransferase (ALT) AST/ALT ratio, albumin, prothrombin time, platelet count and APRI. These markers usually used in combination, have been evaluated.8–13 Fibronectin is a glycoprotein, the major sources of which are hepatocytes, Kupffer cells and endothelial cells.14 Circulating fibronectin represents a viable marker for the presence of significant fibrosis or a lack thereof.15 Recently, fibronectin was identified at 90 kDa and quantified in sera of individuals with CHC using ELISA.16 Here, we have created a predictive model for discriminating patients with significant and advanced liver fibrosis in CHC patients.
Material and MethodsPatientsWe have found 325 patients with chronic viral hepatitis who fulfilled our criteria. Patients used in the estimation group (n = 145) and patients used in validation group (n = 180) were prospectively recruited from the Tropical Medicine Unit, Mansoura University hospitals, Mansoura, Egypt during the period from October 2008 to April 2012. An informed consent was obtained from each individual participated in the present study and all were fully informed concerning the nature of the disease and the diagnostic procedures involved. In the estimation group, blood samples and liver biopsies were taken from untreated consecutive Egyptian individuals (90 males and 55 females aged 42.2 ± 10.3 years). Patients were retrospectively evaluated and assessed with complete laboratory tests needed to decide eligibility for antiviral therapy. Detailed history taking and clinical examination were performed for every patient. Ultrasonographic examination of the liver, spleen and portal vein was done for all patients. Blood tests included liver function tests, kidney function tests, complete blood count, prothrombin time and INR, α fetoprotein, blood glucose, anti-schistosomal antibody, hepatitis B surface antigen, antinuclear antibody, thyroid stimulating hormone and pregnancy test for females. In addition, electrocardiography was conducted for men older than 40 years and for females older than 50 years. Patients with the following conditions were excluded from the study: patients with other causes of chronic liver injury or hepatocellular carcinoma, co-infection with hepatitis A, B viruses and human immunodeficiency virus, hepatocellular carcinoma, prior antiviral or immunosuppressive therapy, metabolic liver disease, insufficient liver tissue for staging of fibrosis, and incomplete data on liver function tests or platelet count within 1 month from the date of biopsy. The clinical and pathological investigation, as well as inclusion and exclusion criteria for the study, and classification adopted in the validation group of patients (124 males, 56 females; aged 40.1 ± 10.5) were the same as those used in patients in the estimation study. The HCV infection was diagnosed based on biochemical, serological and histological criteria. Moreover, all individuals were diagnosed based on a positive test for anti-HCV antibody (ETI-AB-HCVK–3 kit, Sorine Biomedica, Suluggia, Italy). All patients had detectable HCV-NS4 antigen according to Attallah, et al.17 and HCV-RNA (COBAS Ampliprep/COBAS TaqMan, Roche Diagnostics, Pleasanton, USA). The study protocol conforms to the ethical guideline of the 1975 Declaration of the Helsinki.
Liver biopsy and blood collectionLiver biopsy was performed as a part of the routine clinical care of these patients for deciding on antiviral therapy. Needle liver biopsy specimens (n = 145) were obtained with an 18-gauge or larger needle and were routinely stained with hematoxylin-eosin stain. To be considered as adequate for scoring, the liver biopsies had to measure at least 15 mm and/or contain at least five portal tracts, except for cirrhosis for which no limitation was required. METAVIR score was used to stage the liver fibrosis (F0-F4).18 Liver fibrosis was scored on a 5-point scale: F0, no fibrosis; Fl, portal fibrosis alone; F2, portal fibrosis with rare septae: F3 portal fibrosis with many septae; F4, cirrhosis. The presence of stage F0-F1 was termed “minimal fibrosis”; the presence of stage F2-F4 was termed “significant fibrosis” whereas the term “advanced fibrosis” was reserved for stage F3-F4. Necro-inflammatory activity, based on assessment of piecemeal and lobular necrosis, was graded on a 4-point scale: A0, no activity; A1, mild; A2, moderate; A3, severe. Blood samples were collected from all patients by vein-puncture within 2 weeks of liver biopsy and a part of the blood was treated immediately with EDTA-K3 for platelet count. Sera were separated from the rest of blood samples and tested fresh for liver function tests. Liver function tests were measured on an automated biochemistry analyzer (Hitachi 917; Roche Diagnostics, Mannheim, Germany). Platelet counting was performed on KX–21 Sysmex automated hematology analyzer (Sysmex Corporation, Hyogo, Japan). APRI test refers to the AST to platelet ratio index reported by Wai, et al.,19 and was calculated as shown figure 1.
Quantitation of fibronectin using ELISA
Quantitation of fibronectin was determined as previously described by Attallah, et al.16 In brief (50 µL/well) diluted serum samp1es (1: 10) in coating buffer (50 mM Carbonate/Bicarbonate buffer, pH 9.6) were coated ELISA plate. The ELISA plate sealed with an acetate plate sealer and incubated overnight at 2–8 oC. After five washes with phosphate buffered saline-Tween 20 (PBS-T20), the wells free binding sites were blocked with 0.2 % (w/v) BSA in coating buffer (200 µL/well). Fibronectin monoclonal antibody (ABC Diagnostics, New Damietta, Egypt) at dilution 1:100 in PBS was added separately (50 µL/well) and incubated at 37 oC for 2 h. Diluted alkaline phosphatase-conjugated goat anti-mouse lgG (Sigma), 1:500 in 0.2% (w/v) BSA in PBST20, were incubated (50 µL/well) at 37 oC for 1 h. After washing the plates; the amount of coupled conjugate was determined by incubation with 1 mg/mL p-nitrophenyl phosphate in substrate buffer for 30 min at 37 oC. The absorbances were read at 405 nm using a microtiter plate reader (Σ960, Metertech, Inc., Taipei, Taiwan).
Statistical analysesAll statistical analyses were done by a Statistical Package for the Social Sciences (SPSS); version 15.0 on Microsoft Windows XP (SPSS Inc., Chicago, IL, USA). Continuous variables were expressed as mean ± SD, whereas categorical variables were expressed as numbers (percentages). A value of p < 0.05 was considered statistically significant. The correlation was evaluated by Pearson correlation coefficient. Patients were divided by time of assessment into two groups: approximately 44.6% of all cases in estimation group (n = 145) and 55.4% in validation group (n = 180). In accordance with the METAVIR scoring system, patients were divided into several groups. The main endpoint was the identification of patients with significant liver fibrosis (F2–F4) versus those without (F0–F1). F2, F3, and F4 categories were grouped together because F2 is generally chosen as a threshold for treatment of chronic HCV infection.5 In secondary analyses, patients were also classified into advanced liver fibrosis (F3–F4). First, factors that differed significantly between these groups were identified by univariate analyses: χ2, student t test, and ANOVA. The independent discriminative value of blood markers for the diagnosis of significant liver fibrosis was then assessed by ROC curves and stepwise multivariate discriminant analysis. The third step was to construct a score that combined the independent factors. The best score for discrimination was the logistic regression function that combined the most discriminatory independent factors. The best cut-off values for optimal prediction of significant liver fibrosis (F2–F4) were determined from the ROC curves. Common indicators of the candidate blood markers and the model performance (sensitivity, specificity, efficiency, positive and negative predictive values and odds ratio) derived from such a 2 × 2 contingency table. Odds ratios (with 95% confidence intervals) were calculated to estimate the risk of a target disorder from subjects without it.
ResultsClinical characteristics of patientsThe blood liver fibrosis markers (direct and indirect) and Metavir fibrosis stages of the estimation (n = 145) and validation groups (n = 180) are presented in table 1. There is no significant difference (p > 0.05) between the estimation and the validation groups in the blood liver fibrosis markers and Metavir scoring system.
Comparison between laboratory blood tests and Metavir fibrosis stages in estimation and validation groups.
| Estimation group | Validation group | P value** | |
|---|---|---|---|
| • Indirect liver fibrosis markers | |||
| Total bilirubin (mg/dL) | 1.3 ± 0.72 | 1. 1 ±0.32 | NS |
| Albumin (g/L) | 39.3 ± 3.4 | 40±3.1 | NS |
| AST (U/L) | 62 ± 37 | 55±33 | NS |
| ALT (U/L) | 62 ± 33 | 56±30 | NS |
| AST/ALT | 1.1 ± 0.73 | 1. 1 ±0.7 | NS |
| Platelet count (× 109/L) | 189 ± 62 | 198±65 | NS |
| AST/platelet count ratio (APRI)* | 0.94 ± 0.64 | 0.81±0.59 | NS |
| • Direct liver fibrosis markers Fibronectin (mg/L) | 511 ± 319 | 497±303 | NS |
| • Metavir fibrosis stages no (%) | 145 (100%) | 180 (100%) | |
| F0 | 20 (13.8 %) | 15 (8.3°%) | |
| F1 | 42 (29 %) | 73 (40.6%) | |
| F2 | 31 (21.4%) | 31 (17.2%) | |
| F3 | 17 (11.7%) | 23 (12.8%) | |
| F4 | 35 (24.1%) | 38 (21.1%) |
References values: Aspartate aminotransferase (AST) up to 40 U/L; alanine aminotransferase (ALT) up to 45 U/L; albumin 38–54 g/L; platelet count 150–400 (× 109/L); fibronectin 250–400 mg/L according to Fortunato, et al.32.
The distribution of albumin, AST, AST/ALT, platelet count and APRI differed significantly (P < 0.05-P < 0.0001) between patients with minimal liver fibrosis and patients with significant liver fibrosis. ALT and total bilirubin didn’t differ significantly which were excluded from subsequent analyses. The level of fibronectin was increased significantly with the progression of fibrosis stages but decreased in cirrhosis. Areas under ROC curves were used for evaluating the overall diagnostic performance of direct and indirect liver fibrosis markers for discriminating patients with minimal liver fibrosis (F0–F1) from patients with significant liver fibrosis (F2–F4). Areas under ROC curves ranged from 0.83 for fibronectin to 0.59 for AST/ALT ratio (data not shown). Based on the areas under the ROC curves, fibronectin (mg/L) was the most efficient marker among other markers. The mean ± SD (mg/L) of the most efficient marker (fibronectin) candidate markers in different METAVIR fibrosis groups were listed in table 2. The level of APRI and fibronectin was increased significantly with the progression of liver fibrosis stages. The level of albumin was decreases significantly with the progression of liver fibrosis stages from F0 to F4. Serum fibronectin was chosen as the basic marker to combine with other indices to discriminate patients with significant liver fibrosis (F2–F4) from minimal liver fibrosis (F0–F1).
Levels of candidate markers and fibronectin discriminant score (FDS) to differentiate patients with different liver fibrosis stages in the estimation and validation groups.
| Analyte* | Estimation study (n = 145) | Validation study (n = 180) | ||||
|---|---|---|---|---|---|---|
| Metavir scoring system | P value** | Metavir scoring system | P value** | |||
| F0–F1 (n = 62) | F2–F4 (n = 83) | F0–F1 (n = 88) | F2–F4 (n = 92) | |||
| Albumin (g/L) | 40.7 ±1.87 | 38.4± 3.9 | < 0.0001 | 40.8 ±1.8 | 38.4 ±2.9 | < 0.0001 |
| APRI* | 0.59 ±0.39 | 1.2 ± 0.67 | < 0.0001 | 0.52 ±0.36 | 1.1 ±0.62 | < 0.0001 |
| Fibronectin (mg/L)* | 317 ±184 | 656 ± 323 | < 0.0001 | 301 ±173 | 583 ±321 | < 0.0001 |
| FDS | 0.29 ±0.19 | 0.74 ± 0.34 | < 0.0001 | 0.26 ±0.18 | 0.67 ±0.29 | < 0.0001 |
| F0–F2 (n = 93) | F3–F4 (n = 52) | F0–F2 (n = 119) | F3–F4 (n = 61) | |||
| Albumin (g/L) | 40.3 ±2.5 | 37.8 ± 4.3 | < 0.0001 | 40.6 ±1.8 | 38.2 ±3.1 | < 0.0001 |
| APRI* | 0.78 ±0.58 | 1.2 ± 0.68 | < 0.0001 | 0.58 ±0.42 | 1.1 ±0.64 | < 0.0001 |
| Fibronectin (mg/L) | 401 ±240 | 707 ± 351 | < 0.0001 | 324 ±200 | 597 ±327 | < 0.0001 |
| FDS | 0.41 ±0.28 | 0.79 ± 0.36 | < 0.0001 | 0.29 ±0.21 | 0.68 ±0.32 | < 0.0001 |
References values:
Table 3 presents the diagnostic performances of the investigated markers and combined markers at the optimal cutoff. The values were based on the differentiation between minimal liver fibrosis and significant liver fibrosis. The best combination of blood markers was selected by stepwise MDA using the minimum Wilk’s lambada test. A function was selected based on absolute values of two routine laboratory tests (APRI and albumin) which reflect alterations in hepatic functions and one direct liver fibrosis marker (fibronectin) which reflects fibrogenesis. We developed a novel nonin-vasive index for predicting liver fibrosis groups, named fibronectin discriminant score (FDS) (Figure 2).
The diagnostic performances of single marker and combined markers (FDS) to differentiate patients with significant liver fibrosis (F2–F4) and advanced liver fibrosis (F3–F4) in the estimation groups.
| Estimation study; F0–F1 (n = 62) vs. F2–F4 (n = 83) | ||||||||
|---|---|---|---|---|---|---|---|---|
| Analyte a | Sensitivity | Specificity | PPV b | NPV c | Efficiency | Odd ratio (95 % CId); | p value | |
| Fibronectin ≥ 380 mg/L | 70% | 73% | 77% | 64% | 71% | 6.1 | (2.9–12.7); | p < 0.0001 |
| APRI ≥ 1.5 | 25% | 94% | 84% | 48% | 54% | 4.9 | (1.6–15.2); | p < 0.0001 |
| Albumin ≤ 39 g/L | 58% | 74% | 74% | 57% | 65% | 4.2 | (2.0–8.7); | p < 0.0001 |
| FDS e ≥ 0.35 | 87% | 75% | 76% | 84% | 79% | 16.8 | (7.8–36.5); | p < 0.0001 |
| Estimation study; F0–F2 (n = 93) vs. F3–F4 (n = 52) | ||||||||
| Fibronectin ≥ 415 mg/L | 60% | 58% | 59% | 44% | 72% | 2.0 | (1.0–4.1); | p = 0.042 |
| APRI ≥ 1.5 | 20% | 84% | 40% | 65% | 61% | 1.2 | (0.5–2.9); | p = 0.636 |
| Albumin ≤ 37.5 g/L | 40% | 87% | 64% | 72% | 70% | 4.9 | (2.1–11.5); | p < 0.0001 |
| FDS e ≥ 0.55 | 67% | 76% | 61% | 81% | 73% | 8.6 | (3.8–19.6); | p < 0.0001 |

There was significant correlation between liver fibrosis stages and FDS (r = 0.571; P < 0.0001). FDS shows a highly significant difference (P < 0.0001) between liver fibrosis stages in significant and advanced liver fibrosis (Figure 3). The AUCs of FDS for prediction of significant liver fibrosis and advanced liver fibrosis were 0.91 and 0.81 respectively, with highly significant difference (P < 0.0001) (Figure 4). The AUC was 0.91 (p < 0.0001) for discriminating patients with minimal liver fibrosis (F0–F1) from significant liver fibrosis (F2–F4) and the best cutoff value was 0.35. The FDS correctly classified 79% of the significant liver fibrosis patients (F2– F4) (i.e. less than 0.35 indicated minimal liver fibrosis and greater than 0.35 indicated significant liver fibrosis) with 87% sensitivity and 75% specificity; respectively. The relative risk [odds ratio, (OR)] of having significant liver fibrosis using the cut-off values determined by ROC curve analyses were 6.1 for fibronectin, 4.9 for APRI, and 4.2 for albumin. FDS predicted liver fibrosis with an OR of 16.8 for significant fibrosis and 8.6 for advanced fibrosis. The diagnostic values of FDS in significant liver fibrosis and advanced liver fibrosis are listed in table 3.
 based on fibronectin, APRI and albumin in significant liver fibrosis (F2–F4) and advanced liver fibrosis (F3–F4). A. Box plots for patients with significant liver fibrosis (F2–F4). B. Box plots for patients with advanced liver fibrosis (F3–F4). The box represents the interquartile range. The whiskers indicate the highest and lowest values, and the line across the box indicates the median value. Overall significance of differences between the liver fibrosis groups was determined by t-test.")
Box plots for fibronectin discriminant score (FDS) based on fibronectin, APRI and albumin in significant liver fibrosis (F2–F4) and advanced liver fibrosis (F3–F4). A. Box plots for patients with significant liver fibrosis (F2–F4). B. Box plots for patients with advanced liver fibrosis (F3–F4). The box represents the interquartile range. The whiskers indicate the highest and lowest values, and the line across the box indicates the median value. Overall significance of differences between the liver fibrosis groups was determined by t-test.
 based on fibronectin, APRI and albumin in the estimation group. A. For discriminating patients with significant liver fibrosis (F2–F4) with AUC = 0.91 (p < 0.0001) and best cutoff value at ≥ 0.35. B. For discriminating patients with advanced liver fibrosis (F3–F4) with AUC = 0.81 (p < 0.0001) and best cutoff value at ≥ 0.55.")
ROC curves for fibronectin discriminant score (FDS) based on fibronectin, APRI and albumin in the estimation group. A. For discriminating patients with significant liver fibrosis (F2–F4) with AUC = 0.91 (p < 0.0001) and best cutoff value at ≥ 0.35. B. For discriminating patients with advanced liver fibrosis (F3–F4) with AUC = 0.81 (p < 0.0001) and best cutoff value at ≥ 0.55.
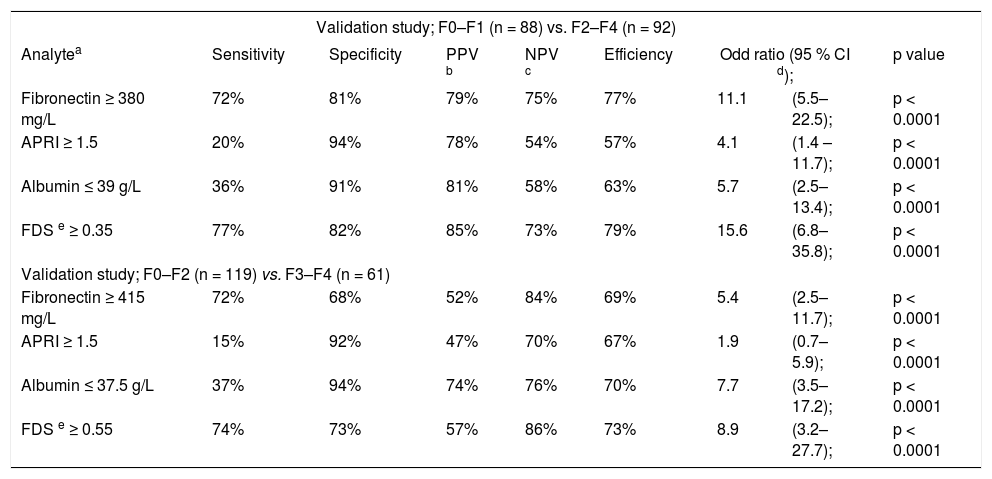
The validation group included 180 CHC patients (124 males, 56 females; aged 40.1 ± 10.5). The clinical and pathological investigations, as well as the inclusion and exclusion criteria for the estimation study were the same. Classifications adopted in this second group of patients were the same as those used in patients in the estimation study. There is no significant difference between the laboratory blood tests in the estimation and the validation studies, table 1. The FDS score was evaluated for discriminating patients with significant liver fibrosis (F2– F4) from minimal liver fibrosis (F0–F1) at cutoff 0.35 in the validation group. The AUCs of FDS for prediction of significant liver fibrosis and advanced liver fibrosis were, 0.90 and 0.86; respectively with highly significant difference (P < 0.0001) (Figure 5). The FDS correctly classified 79% of the significant liver fibrosis patients (F2–F4) (i.e. less than 0.35 indicated minimal liver fibrosis and greater than 0.35 indicated significant liver fibrosis) with 77% sensitivity and 82% specificity; respectively. The FDS correctly classified 73% of the advanced liver fibrosis patients (F3–F4) (i.e. greater than 0.55 indicated advanced liver fibrosis) with 74% sensitivity and 73% specificity; respectively. FDS predicted liver fibrosis with an OR of 15.6 for significant fibrosis and 8.9 for advanced fibrosis (Table 4). There is no significant difference between the diagnostic performances of FDS in the estimation and the validation studies.
 based on fibronectin, APRI and albumin in the validation group. A. For discriminating patients with significant liver fibrosis (F2–F4) with AUC = 0.90 (p < 0.0001) and best cutoff value at ≥ 0.35. B. For discriminating patients with advanced liver fibrosis (F3–F4) with AUC = 0.86 (p < 0.0001) and best cutoff value at ≥ 0.55.")
ROC curves for fibronectin discriminant score (FDS) based on fibronectin, APRI and albumin in the validation group. A. For discriminating patients with significant liver fibrosis (F2–F4) with AUC = 0.90 (p < 0.0001) and best cutoff value at ≥ 0.35. B. For discriminating patients with advanced liver fibrosis (F3–F4) with AUC = 0.86 (p < 0.0001) and best cutoff value at ≥ 0.55.
The diagnostic performances of single marker and combined markers (FDS) to differentiate patients with significant liver fibrosis (F2–F4) and advanced liver fibrosis (F3–F4) in the validation groups.
| Validation study; F0–F1 (n = 88) vs. F2–F4 (n = 92) | ||||||||
|---|---|---|---|---|---|---|---|---|
| Analytea | Sensitivity | Specificity | PPV b | NPV c | Efficiency | Odd ratio (95 % CI d); | p value | |
| Fibronectin ≥ 380 mg/L | 72% | 81% | 79% | 75% | 77% | 11.1 | (5.5–22.5); | p < 0.0001 |
| APRI ≥ 1.5 | 20% | 94% | 78% | 54% | 57% | 4.1 | (1.4 –11.7); | p < 0.0001 |
| Albumin ≤ 39 g/L | 36% | 91% | 81% | 58% | 63% | 5.7 | (2.5–13.4); | p < 0.0001 |
| FDS e ≥ 0.35 | 77% | 82% | 85% | 73% | 79% | 15.6 | (6.8–35.8); | p < 0.0001 |
| Validation study; F0–F2 (n = 119) vs. F3–F4 (n = 61) | ||||||||
| Fibronectin ≥ 415 mg/L | 72% | 68% | 52% | 84% | 69% | 5.4 | (2.5–11.7); | p < 0.0001 |
| APRI ≥ 1.5 | 15% | 92% | 47% | 70% | 67% | 1.9 | (0.7–5.9); | p < 0.0001 |
| Albumin ≤ 37.5 g/L | 37% | 94% | 74% | 76% | 70% | 7.7 | (3.5–17.2); | p < 0.0001 |
| FDS e ≥ 0.55 | 74% | 73% | 57% | 86% | 73% | 8.9 | (3.2–27.7); | p < 0.0001 |
Fibrosis prediction is an essential part of the assessment and management of patients with chronic liver disease. Blood-based biomarkers offer a number of advantages over the traditional standard of fibrosis assessment of liver biopsy, including safety, cost-savings and wide spread accessibility.20 In the present study, the most informative blood markers were, in decreasing rank: fibronectin, APRI and albumin. Fibronectin is multifunctional extracellular matrix glycoprotein that is important component of the extracellular matrix in normal and fibrotic liver and seems to play a pacemaker role in liver fibrogenesis.21 The excessive synthesis of fibronectin and other extracellular matrix proteins deteriorates hepatic architecture and results in liver fibrosis.22 The level of fibronectin was increased significantly with the progression of fibrosis staging but decreased in cirrhosis. This could be explained by the fibronectin level is increased in the development of early liver fibrosis and fibronectin may act as a chemotactic factor for collagen producing cells and as a skeleton for the new collagen formation.23 The decreased levels of fibronectin in patients with liver cirrhosis are related to hepatic dysfunction.24–25 The finding of decreased platelet count and increased AST level with progression of liver fibrosis has been reported in many studies.26–28 The liver has large reserves of albumin synthetic capacity, and thus decreased serum albumin from liver impairment is highly important and was already used to assess liver fibrogenesis.29–30 Several previous studies described the use of blood markers to assess stages of liver fibrosis.31–32 The FDS had sensitivity 87%, and accuracy 79%, which was higher than APRI sensitivity (25%) and accuracy (54%) when using APRI alone. FDS is much simpler and practical score than other scores such as Fibrotest including (total bilirubin, γ-glutamyl-transpeptidase, 2-macroglobulin, apolipoprotein A1 and haptoglobin, corrected for age and gender).33 In a large study (n = 1,307), Degos, et al.34 comparing prospectively several scores (FibroTest, Fibrometre, Hepacore and APRI), the AUCs ranged from 0.72 to 0.78 for significant fibrosis and from 0.77 to 0.86 for cirrhosis. In the present study, FDS produced higher areas under ROC curves (AUC) of 0.91 for significant fibrosis. The sensitivity, specificity and efficiency of FDS to differentiate significant liver fibrosis from minimal liver fibrosis were 87%, 75% and 79%, respectively. The sensitivity, specificity, positive predictive value and negative predictive value of the Fibrotest to differentiate significant liver fibrosis from minimal liver fibrosis were 80%, 63%, 79% and 66%, respectively.35 The FDS showed a diagnostic sensitivity for significant liver fibrosis higher than FIBROSpect (72%).36 Fibroscan is a noninvasive method that evaluates liver stiffness. The development of fibroscan provides clinicians with a non-invasive, accurate, and reproducible tool to estimate liver fibrosis.37 The fibroscan might be convenient in clinical practice but the device for fibroscan is costly; and required higher experience operator.38 Obesity, and general features of the metabolic syndrome were the main obstacle for fibroscan and elastography failure or unreliable results39 Fibroscan produced AUC of 0.79 for significant fibrosis and 0.91 for liver cirrhosis in 935 patients with CHC40 Takemoto, et al.41 reported higher diagnostic value of FibroScan for predicting advanced liver fibrosis, in 44 patients with CHC (sensitivity, specificity, positive predictive value, negative predictive value and accuracy were 100%, 74%, 78%, 100% and 86%, respectively). The estimated OR was 16.8 for the FDS, which was better than the individual markers alone (6.1, 4.9 and 4.2). Once FDS was above the cut-off value (0.35) in a given patient, this patient was 16.8 times more likely to have significant liver fibrosis. OR of significant liver fibrosis in the FDS was higher than OR of Forns’ score (6.3); OR of Fibrotest (15.7) and lower than OR of SHASTA (19.1).42 We applied the MDA function of the score to the validation groups of CHC patients. The accuracy of FDS tends to decrease slightly when applied to the validation study and it was found that no significant difference from the results of the estimation groups of patients. The ability of Hepascore to predict significant fibrosis (F2–F4) as determined by AUC was lower than our work in the estimation (0.83) and the validation study (0.81) and was comparable to the results that had been seen in previous studies.31 Because treatment is generally recommended when significant liver fibrosis is present, patients with FDS at cutoff 0.35 may be considered for antiviral therapy without the requirement for liver biopsy.5 In addition, the exclusion of patients with advanced fibrosis, FDS cutoff at 0.55 may be particularly useful in providing prognostic information for patients who are reluctant to undergo biopsy. Also FDS may be useful for elderly patients who are unlikely to develop liver related morbidity or mortality in the absence of advanced fibrosis.43 The FDS in our study has several unique features. FDS is based on a simple and easy to perform tests (albumin and APRI) reflect alterations in hepatic functions and fibronectin reflect the process of fibrogenesis. Fibronectin is available to most laboratories and requires only a microplate colorimetric reader. It is therefore less costly and more convenient to perform. An obvious advantage of the FDS is that it is published and freely available. In conclusion, FDS has good correlation with the progression of the hepatic fibrosis stages. Our score could be used as blood tests for the non-invasive diagnosis of liver fibrosis and to reduce the need for liver biopsy that cannot be completely avoided.
Abbreviations- •
ALT: alanine aminotransferase.
- •
AST: aspartate aminotransferase.
- •
CHC: chronic hepatitis C.
- •
FDS: fibronectin discriminant score.
- •
HCV: hepatitis virus C.
- •
MDA: multivariate discriminant analysis.
The authors declared that there was no conflict of interest.


