


Background. Hospital outcome report cards are used to judge provider performance, including for liver transplantation. We aimed to determine the impact of the choice of risk adjustment method on hospital rankings based on mortality rates in cirrhotic patients.
Material and methods. We identified 68,426 cirrho-tic patients hospitalized in the Nationwide Inpatient Sample database. Four risk adjustment methods (the Charlson/Deyo and Elixhauser algorithms, Disease Staging, and All Patient Refined Diagnosis Related Groups) were used in logistic regression models for mortality. Observed to expected (O/E) death rates were calculated for each method and hospital. Statistical outliers with higher or lower than expected mortality were identified and rankings compared across methods.
Results. Unadjusted mortality rates for the 553 hospitals ranged from 1.4 to 30% (overall, 10.6%). For 163 hospitals (29.5%), observed mortality differed significantly from expected when judged by one or more, but not all four, risk adjustment methods (25.9% higher than expected mortality and 3.6% lower than expected mortality). Only 28% of poor performers and 10% of superior performers were consistently ranked as such by all methods. Agreement between methods as to whether hospitals were flagged as outliers was moderate (kappa 0.51-0.59), except the Charlson/Deyo and Elixhauser algorithms which demonstrated excellent agreement (kappa 0.75).
Conclusions. Hospital performance reports for patients with cirrhosis require sensitivity to the method of risk adjustment. Depending upon the method, up to 30% of hospitals may be flagged as outliers by one, but not all methods. These discrepancies could have important implications for centers erroneously labeled as high mortality outliers.
Information about the performance of hospitals, health professionals, and health care organizations has become central to health care delivery in the United States. Comparisons of patient outcomes across providers, variously called ‘performance reports’, ‘report cards’, or ‘provider profiles’, have been released publicly for nearly two decades and are mandated in various jurisdictions.1–3 The unrestricted disclosure of outcome data has been proposed as a mechanism for improving the quality of care by providing more transparency and greater accountability of health care providers.4,5 Although data is conflicting, evidence suggests that publicly reporting performance data stimulates quality improvement activity, at least at the hospital level, and may influence the selection of providers by patients and managed care organizations.6–8 With growing interest in pay-for-performance programs as a means of rewarding quality care, the public release of performance data will likely continue to grow.9,10
In order to make valid comparisons across providers, it is necessary to adjust for patient risk, recognizing that the nature of some patients’ diseases makes them more likely than others to have poor outcomes.11 There are numerous methods available for assessing patient risk, including proprietary and non-proprietary alternatives.12 Risk adjustment is vital to avoid penalizing providers who care for the most severely ill patients. As observed in other conditions,13,14 we have described markedly different predicted probabilities of death in hospitalized patients with cirrhosis depending on which risk adjustment measure is employed.15 The impact of these patient-level differences on performance profiles of hospitals has yet to be determined.
Therefore, the objective of our study was to determine if the choice of risk adjustment method has an impact on the ranking of hospitals based on inhospital mortality rates in patients with cirrhosis. We hypothesized that variations in risk adjustment across methods would result in conflicting hospital rankings depending on the choice of method. We focused on this patient population because cirrhosis is an important and growing cause of morbidity and mortality,16,17 and already the subject of hospital rankings,18 particularly in the field of liver transplantation.19
Material and MethodsData sourceAll data were extracted from the Healthcare Cost and Utilization Project (HCUP) Nationwide Inpatient Sample (NIS) database for the years 2002 to 2005.20 The NIS is the largest all-payer database of national hospital discharges (~8 million per annum) maintained by the Agency for Healthcare Research and Quality. It represents a 20% stratified sample of non-federal acute-care hospitals in the U.S. Stratified random sampling ensures that the database is representative of the U.S. population and that it accounts for ~90% of all hospitalizations. Each discharge abstract includes a patient identifier, demographic data, transfer status, admission type, primary and secondary diagnoses (up to 15), procedures (up to 15), and hospital characteristics including location, teaching status, and bed size. Since each record in the NIS is for a single hospita-lization, not a person, there could be multiple records for an individual if they had several hospitalizations. This NIS has been used to study the epidemiology and outcomes of numerous liver di-sorders.15,21–26 NIS data compares favorably with the National Hospital Discharge Survey, supporting the validity of this database.27
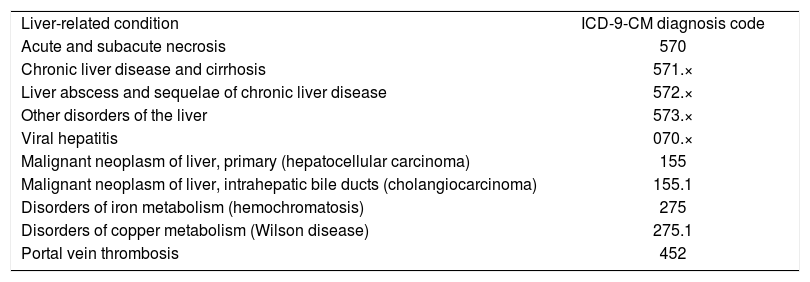
Study sample and outcomesWe used International Classification of Diseases 9th Version, Clinical Modification (ICD-9-CM) diagnosis codes (571.2, 571.5, and 571.6) to identify adult patients (≥ 18 years) hospitalized with a primary diagnosis of cirrhosis between 2002 and 2005.28 We also included admissions with a secondary diagnosis of cirrhosis if the primary diagnosis was a liver-related condition (see Appendix for specific conditions and their ICD-9-CM codes). We excluded patients with missing data on in-hospital mortality (our primary outcome measure) or that required for calculation of the risk adjustment measures (see below). We also excluded transferred patients because they tend to be sicker than non-transferred patients. Their inclusion would negatively affect outcomes for the accepting institution and positively bias outcomes for the transferring institution. Moreover, in-hospital mortality in patients transferred out is not available. Finally, because of our interest in hospital-level analyses, we eliminated institutions with fewer than 50 eligible cases over the 5-year study interval. Hospitals with fewer cases would risk violating the normal approxi-mation for mortality and produce mortality estimates with poor precision.12
Risk adjustment measuresWe studied four commonly used risk adjustment measures: the Deyo adaptation of the Charlson co-morbidity algorithm,29 the Elixhauser comorbidity algorithm,30 Disease Staging (Thomson Medstat Inc., Ann Arbour, MI, USA),31 and All Patient Refined Diagnosis Related Groups (APR-DRGs; 3M Health Information Systems, Wallingford, CT, USA).32 These methods use information obtained in the standard hospital discharge abstract including demographics, diagnosis, and procedure codes. The Charlson/Deyo and Elixhauser algorithms, which are non-proprietary and can be routinely applied to administrative data using widely available computer algorithms, identify 17 and 30 categories of comorbi-dities, respectively, using ICD-9-CM diagnosis codes.29,30 The Elixhauser method employs a DRG restriction that eliminates conditions directly related to the primary reason for hospitalization.30 Accordingly, a secondary diagnosis (e.g. congestive heart failure) related to the primary diagnosis (e.g. myocardial infarction) via a specific DRG category is considered a modifier of this diagnosis and an indicator of illness severity, rather than a comorbidity. Both the Charlson/Deyo and Elixhau-ser algorithms contain a variable for liver disease as a comorbidity that includes diagnosis codes for cirrhosis. The Charlson/Deyo algorithm contains an additional variable that includes codes for variceal bleeding, hepatic encephalopathy, and other sequelae of chronic liver disease. Because our cohort was restricted to cirrhotic patients, we excluded these variables from the analysis. Previous work has revealed a minimal impact on discrimination with exclusion of these variables.15
We also examined Disease Staging and APR-DRGs, which are proprietary risk adjustment methods with logic unavailable for outside scrutiny. In Disease Staging, severity is defined as the likelihood of death or organ failure resulting from disease progression and independent of the treatment process.31 Disease progression is measured using four stages (with additional sub-stages) of increasing complexity (stage 1 = no complications or problems of minimal severity; stage 2 = problems limited to a single organ or system; significantly increased risk of complications; stage 3 = multiple site involvement; generalized site involvement; poor prognosis; and stage 4 = death). Disease Staging uses age, gender, admission and discharge status and diagnoses, to generate a predictive scale for mortality.31
APR-DRGs is a clinical model that expands on the basic DRG structure designed to group patients into approximately 500 categories with similar clinical features and resource utilization.32 APR-DRGs include the addition of four subclasses to each DRG category serving to identify minor, moderate, major, or extreme risk of mortality, defined as the extent of physiologic decompensation or organ system loss of function. The process of classifying a patient consists of assessing the level of each secondary diagnosis; determining the base subclass for the patient based on all of their secondary diagnoses; and finally, determining the final subclass of the patient by incorporating the impact of the principal diagnosis, age, procedures, and combinations of categories of secondary diagnoses.32
Statistical analysisWe used logistic regression to develop models including each of the four risk adjustment methods. Each model also contained a set of independent variables that are associated with in-hospital mortality in cirrhotic patients including age, gender, health insurance status (private, Medicaid, Medicare, self-pay, other/unknown), race (white, African-American, Hispanic, Asian, other/unknown), admission status (emergency vs. urgent and elective combined),25,26 and the performance of surgical procedures during the hospitalization (defined by the presence of a surgical DRG).30 To account for the complex sampling design and the hierarchical nature of NIS data, generalized estimating equations with discharge-level weights published by HCUP were used in these models.33,34
Our logistic regression models were used to calculate a predicted probability of death for each patient according to each risk adjustment measure. For each hospital, observed/expected ratios (O/E) were calculating by dividing the observed number of deaths (O) by the expected number of deaths (E) based on the risk adjustment models. O/E ratios are commonly used in hospital report cards to judge provider performance.12 O/E ratios significantly greater than 1 indicate higher than expected mortality, whereas ratios less than 1 indicate lower than expected mortality. Confidence intervals (95% CI) for O/E ratios were calculated based on a normal approximation to the logarithm of the O/E ratio.35
Comparison of risk adjustment methodsOur primary objective was to compare the agreement between risk adjustment methods for the identification of hospitals with particularly good or poor performance. We used an approach commonly employed in hospital report cards, namely, the detection of statistical outliers with O/E ratios significantly greater than or less than 1 (indicating higher or lower observed mortality than expected, respectively).12 For each risk adjustment measure, hospital performance was either flagged as worse than expected, better than expected, or not significantly different from expected, based on their O/E ratios. Agreement in rankings between risk adjustment measures was calculated using the kappa statistic, which measures the proportion of observed to expected agreement.36 Kappa values below 0.4 indicate poor agreement; 0.41-0.60 moderate agreement; 0.61-0.80 full agreement; and greater than 0.80 almost perfect agreement.
To complement these pair-wise comparisons at the hospital level, we explored the predictive power of the risk adjustment models at the individual patient level. To do so, we calculated the c-statistic, an approximation to the area under the receiver operating characteristic (ROC) curve and a measure of model discrimination.37 The c-statis-tic ranges from 0.5 to 1.0, with 1.0 indicating perfect discrimination and 0.5 indicating no ability to discriminate. We calculated 95% CIs and compared c-statistics using the method of DeLong, et al.38 In addition, we examined the correlation between the predicted probabilities of death at the indivi-dual patient and hospital levels according to each of the risk adjustment methods using Pearson correlation coefficients.
All statistical analyses were performed using SAS version 9.1.3 (SAS Institute Inc., Cary, NC, USA) and SAS-callable SUDAAN version 9.0.1 software (Research Triangle Institute, Research Triangle Park, NC, USA).
ResultsCharacteristics of the included patients and hospitalsDuring the four-year study period, there were 68,426 admissions of patients with cirrhosis to 553 hospitals that met our inclusion criteria. Cirrhosis was the primary diagnosis in 63% (n = 43,419) of patients. The median age of the cohort was 53 years (interquartile range [IQR] 47-62), 65% were male, 46% were white, and 27% had private health insurance. The majority of the patients (60%) were admitted emergently and 9% underwent surgery. Median length of stay was 4 days (IQR 2-7).
Of the 553 included hospitals, 94% were urban, 44% were teaching centers, and 65% were large (as defined by the NIS). Forty-three percent of the hospitals were located in the Southern U.S., 26% in the West, 16% in the Northeast, and 14% in the Midwest. The median number of total discharges per hospital and cirrhotic patients, specifically, were 18,285 (range 2,411-114,163; IQR 11,996-25,617) and 86 (range 50-890; IQR 64-133), respectively.
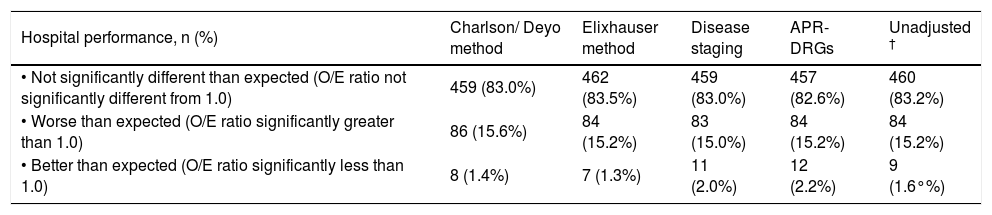
Relative hospital performanceAmong all hospitals, 10.6% (n = 7,272) of patients died. Unadjusted mortality rates ranged from 1.4 to 29.6% for the 553 hospitals. Table 1 includes hospital mortality rankings according to each of the risk adjustment measures after controlling for sociode-mographic variables, admission status, and surgical procedures. Rankings for an additional model that did not adjust for severity of illness (the ‘unadjusted model’) are also included for comparison. In general, approximately 15% of the hospitals had higher than expected mortality, 1-2% had lower than expected mortality, and 83% had mortality rates that were not significantly different from expected. In total, 390 hospitals (70.5%) had observed mortality rates that were similar to expected according to all four risk adjustment methods. Forty hospitals (7.2%) were consistently ranked poorly and two (0.4%) had superior performance when judged by all of the methods. The median (range) unadjusted mortality rates among hospitals consistently ranked as poor, not significantly different than expected, and superior were 18.0% (14.3%-29.6%), 9.6% (1.4%-20.3%), and 4.9% (4.4%-5.3%), respectively.
Performance of hospitals for managing patients with cirrhosis according to the method of risk adjustment (n = 553).*
| Hospital performance, n (%) | Charlson/ Deyo method | Elixhauser method | Disease staging | APR-DRGs | Unadjusted † |
|---|---|---|---|---|---|
| • Not significantly different than expected (O/E ratio not significantly different from 1.0) | 459 (83.0%) | 462 (83.5%) | 459 (83.0%) | 457 (82.6%) | 460 (83.2%) |
| • Worse than expected (O/E ratio significantly greater than 1.0) | 86 (15.6%) | 84 (15.2%) | 83 (15.0%) | 84 (15.2%) | 84 (15.2%) |
| • Better than expected (O/E ratio significantly less than 1.0) | 8 (1.4%) | 7 (1.3%) | 11 (2.0%) | 12 (2.2%) | 9 (1.6°%) |
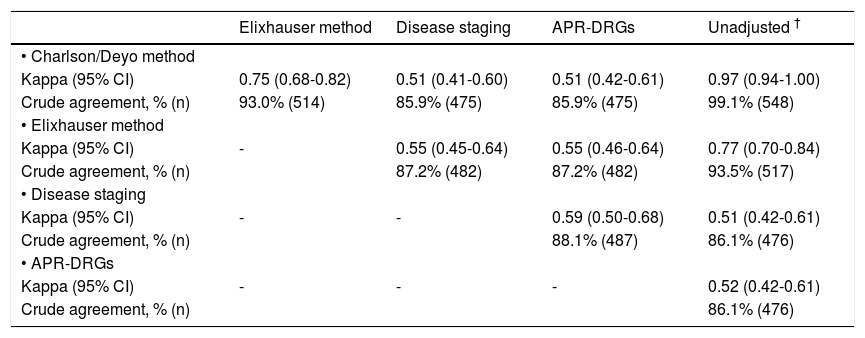
For 163 hospitals (29.5%), observed mortality rates differed significantly from expected when judged by one or more risk adjustment methods. One hundred forty-three hospitals (25.9%) were ranked poorly and 20 (3.6%) had lower than expected mortality by at least one of the methods. Table 2 shows details of comparisons between risk adjustment methods on whether hospitals were flagged as statistical outliers, indicating the number of hospitals on which agreement occurred and kappa values for each comparison. Crude agreement in rankings between measures ranged from 86 to 99% of hospitals. The Charlson/Deyo and Elixhauser methods demonstrated excellent agreement (kappa 0.75), and both agreed well with the unadjusted model (kappa 0.97 and 0.77, respectively). Agreement between these methods and Disease Staging and APR-DRGs was lower (kappa 0.51-0.55), as was agreement between the latter measures (kappa 0.59). Agreement between Disease Staging and APR-DRGs with the unadjusted model was moderate (kappa 0.51 and 0.52, respectively), but lower than that observed for the Charlson/Deyo and Elixhauser algorithms.
Agreement between risk adjustment methods for the ranking of hospital performance (n = 553).*
| Elixhauser method | Disease staging | APR-DRGs | Unadjusted † | |
|---|---|---|---|---|
| • Charlson/Deyo method | ||||
| Kappa (95% CI) | 0.75 (0.68-0.82) | 0.51 (0.41-0.60) | 0.51 (0.42-0.61) | 0.97 (0.94-1.00) |
| Crude agreement, % (n) | 93.0% (514) | 85.9% (475) | 85.9% (475) | 99.1% (548) |
| • Elixhauser method | ||||
| Kappa (95% CI) | - | 0.55 (0.45-0.64) | 0.55 (0.46-0.64) | 0.77 (0.70-0.84) |
| Crude agreement, % (n) | 87.2% (482) | 87.2% (482) | 93.5% (517) | |
| • Disease staging | ||||
| Kappa (95% CI) | - | - | 0.59 (0.50-0.68) | 0.51 (0.42-0.61) |
| Crude agreement, % (n) | 88.1% (487) | 86.1% (476) | ||
| • APR-DRGs | ||||
| Kappa (95% CI) | - | - | - | 0.52 (0.42-0.61) |
| Crude agreement, % (n) | 86.1% (476) |
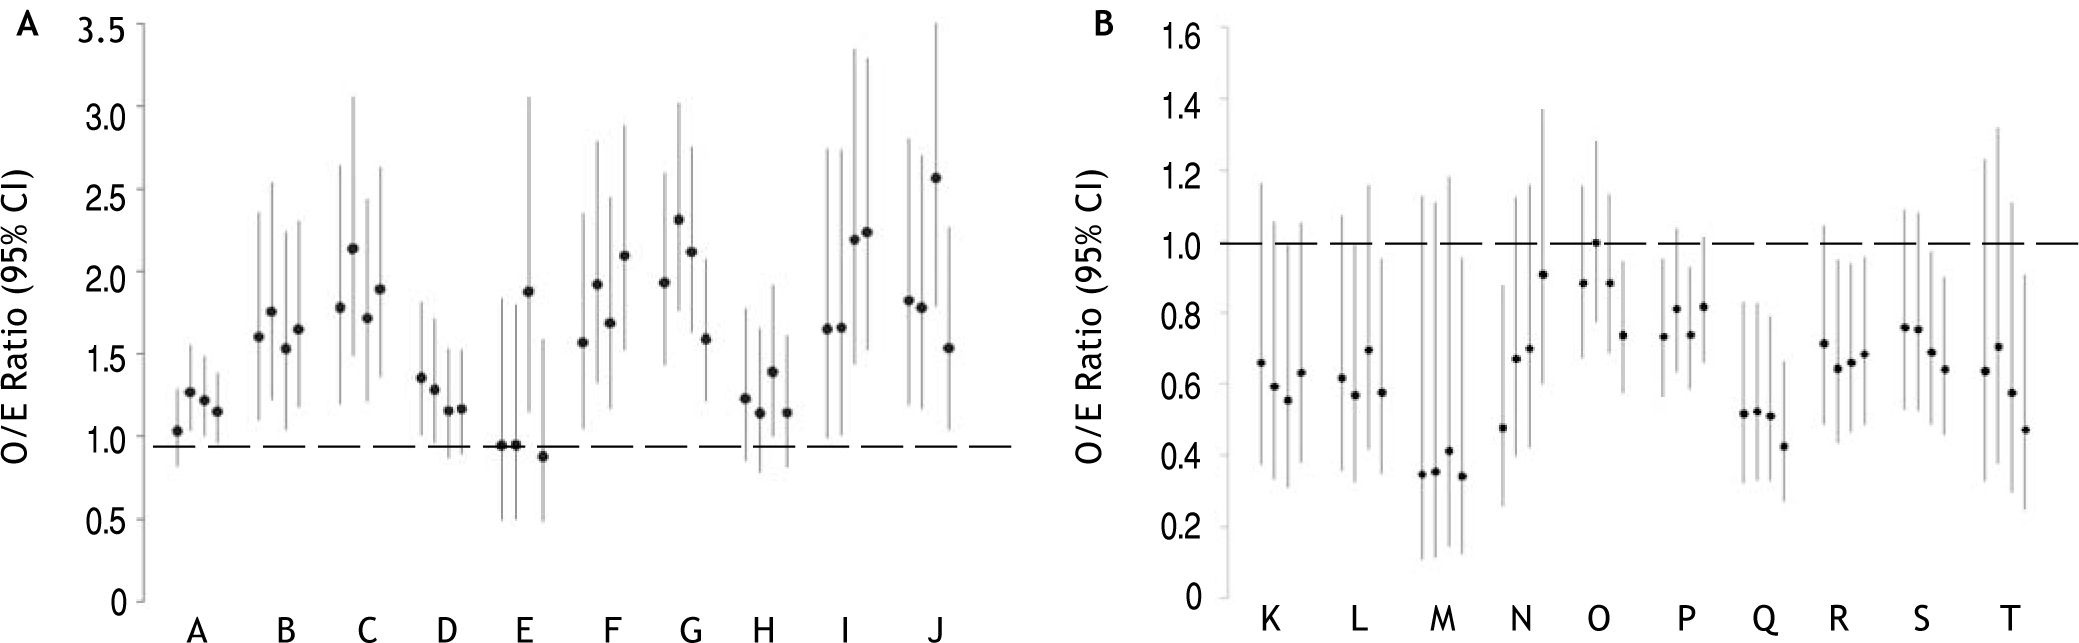
Figure 1 shows O/E ratios according to each of the risk adjustment methods for hospitals ranked as statistical outliers by at least one of the methods. For ease of presentation, 10 randomly-selected hospitals (out of 143) ranked as poor (Figure 1A) and 10 (out of 20) ranked as superior (Figure 1B) by at least one of the methods are included. All disagreements involved the ranking of a hospital as a statistical outlier by one or more methods versus ‘as expected’ by the other(s). None of the hospitals had lower than expected mortality by one method and higher than expected mortality by another. For example, hospitals B, C, F, G, and J were ranked as poor performers and hospital Q was ranked as superior according to all methods. On the contrary, hospital A was rated a poor performer by the Elixhauser method and Disease Staging, but not by the Charlson/ Deyo algorithm or APR-DRGs. Hospital L had lower than expected mortality according to the Elixhauser algorithm and APR-DRGs, but mortality not significantly different than expected according to the Charlson/Deyo algorithm or Disease Staging.
 ranked as statistical outliers with poor (A) or superior (B) performance according to at least one of the risk adjustment methods. O/E ratios (95% CI) according to the Charlson/Deyo, Elixhauser, Disease Staging, and APR-DRG methods are presented from left to right, respectively, for each hospital. O/E ratios significantly greater than 1 indicate higher than expected mortality, whereas ratios less than 1 indicate lower than expected mortality.")
O/E ratios for randomly selected hospitals (denoted by different letters) ranked as statistical outliers with poor (A) or superior (B) performance according to at least one of the risk adjustment methods. O/E ratios (95% CI) according to the Charlson/Deyo, Elixhauser, Disease Staging, and APR-DRG methods are presented from left to right, respectively, for each hospital. O/E ratios significantly greater than 1 indicate higher than expected mortality, whereas ratios less than 1 indicate lower than expected mortality.
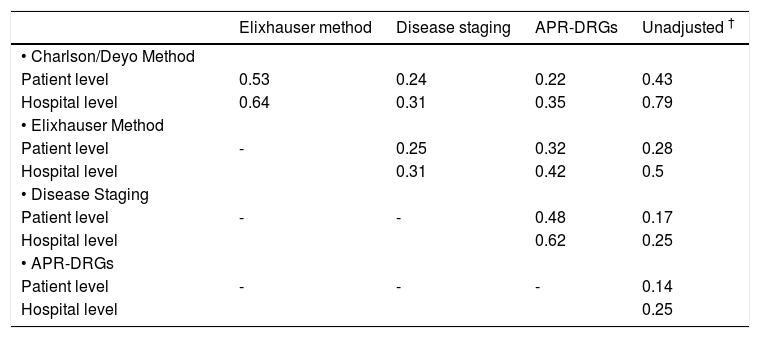
As observed at the hospital level, prediction of mortality at the individual patient level differed significantly according to the method of risk adjustment. Predicted mortality ranged from 1.1 to 61.2% for the Charlson/Deyo method, 0.4 to 85.4% for the Elixhauser method, 2.4 to 98.5% for Disease Staging, and 0.5 to 74.5% for APR-DRGs. Correlation coefficients for predicted mortality at the patient level are shown in table 3. The highest correlation coefficients were 0.53 for the comparison of the Charlson/Deyo and Elixhauser methods, and 0.48 for Disease Staging and APR-DRGs. For comparison purposes, correlation coefficients for predicted mortality at the hospital level are also shown. In general, differences in predictions for individual patients tended to average out so that higher correlations among methods were observed at the hospital level.
Correlation coefficients between risk adjustment methods for predicted mortality at the individual patient (n = 68,426) and hospital levels (n = 553).*
| Elixhauser method | Disease staging | APR-DRGs | Unadjusted † | |
|---|---|---|---|---|
| • Charlson/Deyo Method | ||||
| Patient level | 0.53 | 0.24 | 0.22 | 0.43 |
| Hospital level | 0.64 | 0.31 | 0.35 | 0.79 |
| • Elixhauser Method | ||||
| Patient level | - | 0.25 | 0.32 | 0.28 |
| Hospital level | 0.31 | 0.42 | 0.5 | |
| • Disease Staging | ||||
| Patient level | - | - | 0.48 | 0.17 |
| Hospital level | 0.62 | 0.25 | ||
| • APR-DRGs | ||||
| Patient level | - | - | - | 0.14 |
| Hospital level | 0.25 |
Statistical performance for mortality prediction varied markedly across methods. Specifically, the c-statistics for mortality were 0.64 (95% CI 0.63-0.65) for the Charlson/Deyo method, 0.72 (0.71-0.72) for the Elixhauser method, 0.78 (0.78-0.79) for Disease Staging, and 0.85 (0.85-0.86) for APR-DRGs (P<0.0001 for all pair-wise comparisons). The c-sta-tistic for the base model that did not control for severity of illness was lower at 0.56 (95% CI 0.56-0.57), demonstrating the added discrimination provided by risk adjustment.
DiscussionRisk-adjusted mortality rates are frequently used in public reports, pay-for-performance programs, and quality improvement initiatives as indicators of the quality of hospital care.1–3 In order to accurately assess hospital performance, it is vital to adjust for differences in illness severity among patients seen at various centers.12 Not doing so would penalize hospitals caring for the sickest patients, while favoring hospitals with the lowest risk case-mix. In this study of U.S. nationwide data in over 68,000 hospitalized patients with cirrhosis, we examined the magnitude of this effect using methods commonly employed in hospital report cards. We found that mortality rates varied widely among hospitals (from 1 to 30%) and that the probability of a hospital being identified as a statistical outlier was highly dependent on the method of risk adjustment.
Specifically, 30% of hospitals were identified as having poor or superior performance by one, but not all four, risk adjustment methods. Viewed in another manner, of 143 hospitals flagged by at least one method as having higher than expected mortality, only 28% (n = 40) were categorized as such by all methods. Conversely, only 10% of centers (2 of 20) identified as superior performers had lower than expected mortality when judged by all methods. Therefore, whether or not a hospital was labeled as having particularly good or poor performance depended in large part on the method of risk adjustment. These results are in accordance with findings in patients with pneumonia,39 acute myocardial in-farction40 and stroke,41 in which mortality performance varied for 29 to 32% of hospitals depending on the method of risk adjustment. These findings were not replicated in a study of patients undergoing coronary artery bypass graft (CABG) surgery in which hospital rankings based on observed mortality were essentially unaffected by risk adjustment.42
We compared four methods of risk adjustment based on widely available hospital discharge abstract data. Although alternative methods, including clinical and laboratory-based measures (e.g. the Child-Pugh or Model for End-stage Liver Disease scores), may have improved model performance,43,44 this data is not routinely available in administrative databases including the NIS. We chose these methods because they encompass both proprietary (Disease Staging and APR-DRGs) and non-proprietary (Charlson/Deyo and Elixhauser algorithms) alternatives, and they are commonly used by payers, policymakers, and researchers in the assessment of patient outcomes and provider performance.12 As illustrated in table 2, agreement between methods was variable and linked with model performance. The most discriminative models, Disease Staging and APR-DRGs (c-statistics 0.78 and 0.85, respectively) were in agreement (kappa 0.59), while the less discriminative Charlson/Deyo and Elixhauser algorithms (c-statistics 0.64 and 0.72, respectively), agreed very well with each other (kappa 0.75), but less so with the other measures (kappa 0.51-0.55). Analogous results were found in our analyses of correlation coefficients for predicted mortality at the patient and hospital levels (Table 3). In some instances, rankings of hospital performance based on unadjusted mortality rates agreed as much or more than assessments including risk adjustment (Tables 2 and 3). This finding may suggest that severity adjustment is not useful. However, it is important to note that unadjusted mortality rates predict that each cirrhotic patient within a hospital has the same chance of dying (i.e. the overall rate, 10.6%). Risk adjustment permits the identification of categories of patients with very different likelihoods of death, which can facilitate the interpretation of hospital death rates. For example, one would be more concerned if a hospital’s deaths were occurring among low-risk versus high-risk patients. The identification of such disparities may permit more efficient targeting of quality improvement initiatives to achieve better patient outcomes.
To our knowledge, this is the first study to assess the impact of risk adjustment methods on rankings of hospital performance in patients with liver disease. Most studies have examined cardiovascular conditions (e.g. myocardial infarction and CABG surgery)40,42,45 because performance reports have generally focused on these conditions.2,3,6 One may question the necessity of assessing hospital performance for management of patients with cirrhosis. We feel that this is vital considering the magnitude of the problem-approximately 1 in 10 individuals suffer from liver disease, which is the 12th leading cause of mortality in the U.S.–16,17 and in-hospital mortality is high. In fact, hospital rankings in this field are already being reported. Perhaps most widely publicized is U.S. News and World Report’s listing of ‘America’s Best Hospitals’, which includes hospital performance in patients with liver disease among a myriad of quality indicators.18 In the field of transplantation, the United Network for Organ Sharing (UNOS) Scientific Registry of Transplant Recipients (SRTR) routinely publishes center-specific results of liver transplantation including outcomes on the waiting list and post-transplantation graft and patient survival.19 These report cards could be used by patients and referring physicians to select a transplant center; by government agencies to assist in accreditation of these centers; and by payers to select health care providers for managed care.46 The models used to risk adjust in these reports, based on a variety of patient and donor characteristics, generally have c-statistics in the 0.65 to 0.70 range (similar to that observed for the Charl-son/Deyo and Elixhauser algorithms in our study).47 According to the 2005 SRTR report,47 10% of U.S. liver transplant centers (13 of 126) were labeled as having significantly higher than expected mortality. As is evident from our findings, several of these centers would not have been flagged if a more discriminative risk adjustment model were used. For example, of hospitals flagged as high mortality outliers according to the Charlson/Deyo algorithm in our study, approximately 40% were not flagged by the more discriminative APR-DRG method. Since the impact of being labeled a poor performer can have drastic consequences for a hospital (e.g. revenue losses, suspension of residency training programs, and personal and professional implications for health care workers),48,49 such discrepancies are of con-siderable importance. Conversely, being labeled a superior performer can have a variety of rewards, most notably financial, as attested to by the marketing practices of hospitals with such designations.21 Although we could not specifically address the performance of liver transplant centers using the NIS database due to a small number of hospitals performing transplants, our findings have important implications worthy of examination with more applicable datasets (e.g. the UNOS database).
Our study has several limitations. First, as with all studies using administrative data, the validity of coding must be considered.50 Because hospital discharge abstracts often result from billing, financial motivations may compromise data accuracy. For example, ‘code creep’ –deliberate and systematic shifts in diagnostic coding made specifically to increase reimbursement– is a well-recognized phenomenon that may affect risk-adjusted outcomes based on hospital discharge abstracts.51,52 Second, we assessed in-hospital mortality only. Other quality indicators including patient satisfaction, safety, and extended mortality should be examined. Unfortunately, the NIS database precludes examination of post-discharge deaths (e.g. at 30 days or one year), which may vary depending on hospital discharge practices (e.g. premature discharges predisposing to higher out-of-hospital mortality). Nevertheless, studies have shown good correlation between in-hospi-tal and 30-day mortality.53 Third, we excluded a substantial number of patients (largely due to missing mortality data) and centers with fewer than ~10 hospitalized patients with cirrhosis per year. With the exception of a reduction in the proportion of hospitals identified as statistical outliers (due to the poor precision of estimates from small centers), we are skeptical that these exclusions would have had a major impact on our findings since they are non-differential with respect to our primary objective of comparing risk adjustment methods. Finally, because each record in the NIS is for a single hospi-talization, not a person, there could be multiple records for an individual if they had several admissions.20 Since linkage of individual patient data within the NIS is impossible, the inability to adjust for within-patient correlations may have biased our estimates of hospital mortality.
In conclusion, our results suggest that hospital performance reports for the management of patients with cirrhosis require sensitivity to the method of risk adjustment. Depending upon the chosen method, up to 30% of hospitals may be flagged as statistical outliers by one, but not necessarily all methods. To avoid erroneously labeling hospitals as statistical outliers, studies of hospital performance should pay particular attention to the method of risk adjustment.
Abbreviations- •
APR-DRGs: all patient refined diagnosis groups.
- •
CI: confidence interval.
- •
IQR: interquartile range.
- •
NIS: nationwide inpatient sample.
- •
OR: odds ratio.
- •
UNOS: United Network for Organ Sharing.
Dr. Myers conceived the study idea, performed statistical analyses, and drafted the manuscript. J. Hubbard and A. Shaheen assisted with statistical analyses and revised the manuscript critically for important intellectual content. Drs. Dixon and Kaplan revised the manuscript critically for important intellectual content. Dr. Myers is the guarantor of the study.
Competing InterestsNone to disclose.
AcknowledgementsDr. Myers is supported by a Clinical Investigator Award from the Alberta Heritage Foundation for Medical Research (now Alberta Innovates-Health Solutions) and New Investigator Award from the Canadian Institutes for Health Research (CIHR).
ICD-9-CM diagnosis codes used to indicate the presence of liver-related conditions.
| Liver-related condition | ICD-9-CM diagnosis code |
| Acute and subacute necrosis | 570 |
| Chronic liver disease and cirrhosis | 571.× |
| Liver abscess and sequelae of chronic liver disease | 572.× |
| Other disorders of the liver | 573.× |
| Viral hepatitis | 070.× |
| Malignant neoplasm of liver, primary (hepatocellular carcinoma) | 155 |
| Malignant neoplasm of liver, intrahepatic bile ducts (cholangiocarcinoma) | 155.1 |
| Disorders of iron metabolism (hemochromatosis) | 275 |
| Disorders of copper metabolism (Wilson disease) | 275.1 |
| Portal vein thrombosis | 452 |


