


Background and rationale for the study. We designed to test whether there is interaction of maternal separation (MS) on the ethanol-preferring rats liver structure. The UCh rat pups were separated daily from their mothers during the stress hyporesponsive period (SHRP), between four and 14 days-old, always at the same time for four hours in a cage containing eight subdivisions, one for each pup. Subsequently, rats that presented the highest (UChB) and the lowest (UChA) ethanol (EtOH) consumption were selected to the study. Both UChB and UChA rats received 10% (v/v) EtOH and distilled water ad libitum until the end of the experiment (120 days-old). The liver was collected to histological routine for morphometric and stereological analyses, and immunohistochemistry.
Results. There was an interaction of MS and EtOH on the liver: increased liver mass, peritubular vessels, stellate cell numbers, steatosis and cell death, decreased necrosis, sinusoidal capillary diameters and cell proliferation. While there was a decrease in FSH, testosterone and 5a-di-hidrotestosterone, and increasing corticosterone and cholesterol.
Conclusions. There is interaction of MS and EtOH on the liver structure, dependent on the amount of EtOH intake. Furthermore, the interaction of stress and drugs can increase or decrease their effects on the liver or indirectly via hypothalamic-pituitary-adrenal (HPA) and hypothalamic-pituitary-gonadal (HPG) axes.
EtOH is the main etiological agent of chronic liver disease. It causes progressive lesions as steatosis, fibrosis, necrosis, and apoptosis. Mechanisms of action such as direct hepatotoxicity, reduced immunity, inflammation and increased intestinal permeability are involved.1–3 Acetaldehyde, a major toxic metabolite, is responsible for trans-differentiate hepatic stellate cells (HSC) into collagen-secreting myofibroblasts (COLL) to perisinusoidal space, making the sinusoids to be highly capillarized. The acetaldehyde is converted to the acetate by aldehyde dehydrogenase (ALDH), producing reduced NAD (NADH). The increase in the ratio NADH/NAD promotes the synthesis of fatty acids (steatosis), reduces the activity of the Krebs cycle and leads to accumulation of acetyl CoA and acetaldehyde. The Microsomal Ethanol Oxidation System (MEOS) is another EtOH converter dependent on cytochrome P-4502E1 and important in the genesis of alcoholic liver disease (ALD) by producing reactive oxygen species (ROS) associated with tissue damage.4 Steatosis may progress to perivenular fibrosis5 and degeneration of hepatocytes.6 The liver is at the same time, the main EtOH-metabolizing organ and the target of its deleterious effects.7 The absence of parental care (maternal separation) represents a stress factor during early life and potentiate the risk for development of depression- and anxiety-like symptoms during adulthood.8 Experiencing trauma in childhood may not only increase the risk of these neurological disorders, but also alter the effectiveness of the treatment under certain conditions.9 The environment provided by the mother in the postnatal period produces psychological and neurobiological impacts on animals and humans. The stress is capable of influencing metabolic responses such as hyperlipidemia, throughout life,10 prolonging their effects even after the end of exposure.11,12 Notably, many factors observed in alcoholics may be the result of stress experienced in early and may be potentiated or not in adults. It is well known that stress and EtOH intake share some effects on liver tissue such as oxidative damage and inflammation. Adverse experiences in childhood are associated to the vulnerability in developing abusive EtOH ingestion through alterations of HPA axis.8 EtOH consumption reduces anxiety while it simultaneously activates the stress-related hormones through the HPA axis with the intensity and duration of glucocorticoid response being strictly dependent on the amount of EtOH consumed.13 Therefore, this study was designed to test whether there is interaction of MS and EtOH consumption on the structure of UCh rat liver.
Material and MethodsRat models and treatmentsThe UChA strain rats (rats selected for low voluntary 10% EtOH consumption with brother X sister mating, Wistar) and UChB (rats selected for high voluntary 10% EtOH consumption with brother X sister mating, Wistar) strains were obtained from the Anatomy Department Animal Facility at the Institute of Bioscience, Campus of Botucatu (IBB/UNESP). Twelve couples of each strain were used with two experimental groups (Control and Maternal Separation-MS). Adult females, after fertilization were accompanied during the gestational period. The birth date was stipulated as day zero, with the litter standardized with eight pups by selecting the largest number of males as possible. Each group used ten rats for 120 days of experimentation. The rats were kept in polypropylene cages measuring 40 x 30 x 15 cm with laboratory-grade pine shavings as bedding, under controlled conditions of brightness (12 h light and dark cycle), temperature (20 to 25 °C) with water and standard pellet food (Nuvital®) ad libitum. All animal experiments were performed under a protocol approved by the local ethical committee (IBB/UNESP) and in accordance with the Brazilian Animal Protection Legislation. Four groups were formed (Table 1).
Animal experiments were performed under a protocol approved by the local ethical committee (IBB/UNESP) and in accordance with the Brazilian Animal Protection Legislation.
| UChA | UChAMS | UChB | UChBMS |
|---|---|---|---|
| Ethanol consumption lower than 2 g of ethanol/kg body weight/day | Ethanol consumption lower than 2 g of ethanol/kg body weight/day | Ethanol consumption higher than 2 g of ethanol/kg body weight/day | Ethanol consumption higher than 2 g of ethanol/kg body weight/day |
| Control | MS | Control | MS |
Pups were separated daily from their mothers, during the SHRP, between four and 14 days-old, always at the same time. During MS, the pups were isolated for 4 h in a cage containing eight subdivisions, one for each pup. The rats were kept in a neighboring room at 30 °C and over 50% humidity. Afterwards, the pups were brought back to their mothers that had been removed from their respective cages before meeting their litter again. Control pups were not separated from their mothers and were only subjected to the standard procedures used for laboratory animals. Rats were handled by only one researcher during the whole experiment. The animal facility room was isolated as much as possible from external noise. The researcher’s hands were washed in running water, dried and rubbed on the wood of the litter cage roof in order to eliminate smells that could make mothers reject their offspring. The male pups were housed in boxes with a minimum of two and a maximum of four rats after weaning to 21 days, avoiding stress by social isolation. The male pups were individualized and received standard procedures during their development.
Selection of EtOH consuming ratsAt 65 days-old, UChA and UChB rats started receiving a 10% (v/v) EtOH solution and water ad libitum for 15 days, being the bottles alternated periodically (water and EtOH) positions in the cage during the measurements. Rats that presented the highest (UChB) and the lowest (UChA) EtOH consumption were selected to the experiment. Both EtOH (10%) and water were provided ad libitum to UChA and UChB rats until the end of the experiment (120 days) (Figure 1). UChA and UChB strains were selected and standardized according to Mardones and Segovia-Riquelme.14
Biological materials
All biological samples were harvested at 120 days of age under two distinct procedures: five rats were undergoing euthanasia by decapitation for evaluation of blood plasma hormonal concentrations. Five rats were submitted to transventricular infusion with Bouin’s solution after anesthesia. The liver was collected to histological routine for morphometric and stereological analyses, weighed and fixed by immersion in Bouin’s solution during 24 h. After washing in the increased ethanol series, the tissue fragments were dehydrated and embedded in paraplastic (Oxford Labware, St. Louis, USA). The blocks were sectioned at four mm thickness (LEICA 2145 microtome) and stained with Hematoxilin-Eosin (HE) (focal necrosis, microvesicular steatosis and sinusoid’s diameter) and Picrosirius red (COLL fiber bundle under polarized light microscope, μm2, AxioVision, Zeiss, Hamburg, Germany). The slides were analyzed and captured by digital photomicroscope Axiophot II (Zeiss). The area occupied by COLL was measured around vessels with approximately 50 mm diameter. The microvesicular steatosis was evaluated by the ratio of positive cells and the total hepatocytes. The focal necrosis was quantified by the amount of necrotic foci. The diameter of hepatic sinusoid was expressed in im (software AxioVision Zeiss, Hamburg, Germany). In all measurements we utilized 10 microscopic fields (x 400) per rat.
ImmunohistochemistrySections of liver tissue (n = 10/group) were deparaffinized in xylene based on the areas previously identified during the morphological characterization. Thereafter, tissue sections were microwaved while immersed in 0.01 M sodium citrate buffer, pH 6.0, for 3 x 5 min for antigen retrieval. After blocking endogenous peroxidase activity with 3% hydrogen peroxide and 97% MeOH, the tissues were incubated in 3% bovine serum albumin (BSA) for 1 h to eliminate non-specific binding. Subsequently, liver tissues were incubated with primary polyclonal antibodies diluted in PBS (1:100), anti-a-smooth muscle Actin (Anti-aSMA, Abcam, Cambridge, MA, UK), anti-transforming growth factor beta (Anti-TGF-Beta, Abcam, Cambridge, MA, UK) and mouse monoclonal anti-proliferating cell nuclear antigen (Anti-PCNA, Dako, CA, USA 0879) at 4 °C overnight. After washed in PBS, sections were incubated with Novolink Polymer Detection Systems (Leica Microsystems, Wetzlar, Germany) for 1 h. Then, the slides were reacted with chromogen diaminobenzidine (DAB; Sigma, St. Louis, MO, USA) for 5 min. Apoptotic cells were quantified by TUNEL assay through terminal deoxynucleotidyl transferase (TdT) using the FragELTM DNA Kit (Calbiochem, La Jolla, CA, USA). The apoptotic nuclei were identified with DAB. After these procedures, the sections were counterstained with Harris hematoxylin and photographed on a Zeiss Axiophot light microscope (Zeiss, Hamburg, Germany). The apoptosis and mitosis were expressed by the ratio of stained and non-stained nuclei. The quantification of TGF-Beta was made by counting the number of immunoreacted stellate cells and the SMA was determined by calculating the size of the area marked (Zeiss AxioVision, Hamburg, Germany). All measures were made in 10 microscopic fields (X 400) per rat.
Hormonal assaysAfter decapitation, trunck blood samples were obtained into heparinized tubes to verify Testosterone (T), 5α-di-hidrotestosterone (DHT), and Corticosterone (CORT) hormone levels using ELISA kits (Maia, BioChem Immuno Systems, Italia SPA). The LH and FSH plasma concentrations were achieved by double antibody radioimmunoassay method (RIA, Harbor-UCLA, USA). All samples were run in the same assay for each hormone to avoid interassay variations.
Biochemical assayThe biochemical levels: total cholesterol (TC), high density lipoprotein-cholesterol (HDL-C), low density lipoprotein-cholesterol (LDL-C), very low density lipoprotein-cholesterol (VLDL-C), and triglycerides (TG) were measured using the spectrophotometric method according to the manufacturer’s (Bioclin, Belo Horizonte, MG, Brasil). Results were expressed as mg.dL-1.
Statistical analysesKolmogorov-Smirnov test was used to determine parametric distribution of data. Two-tailed Student’s t-tests were used for comparisons involving only two groups. All data were presented as mean ± standard deviation (SD) and P < 0.05 was considered significant.15
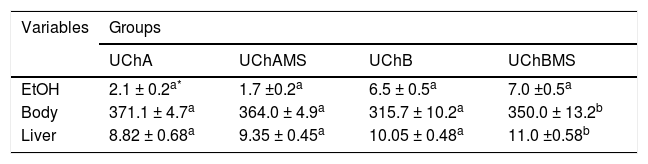
ResultsEthanol intake, body and liver weightTable 2 shows increase of body and liver weight in the UChBMS.
Mean and standard deviation of EtOH consumption (g/kg/day), body and liver weight (g), according to the group (UChA and UChB), and experimental condition (control and MS).
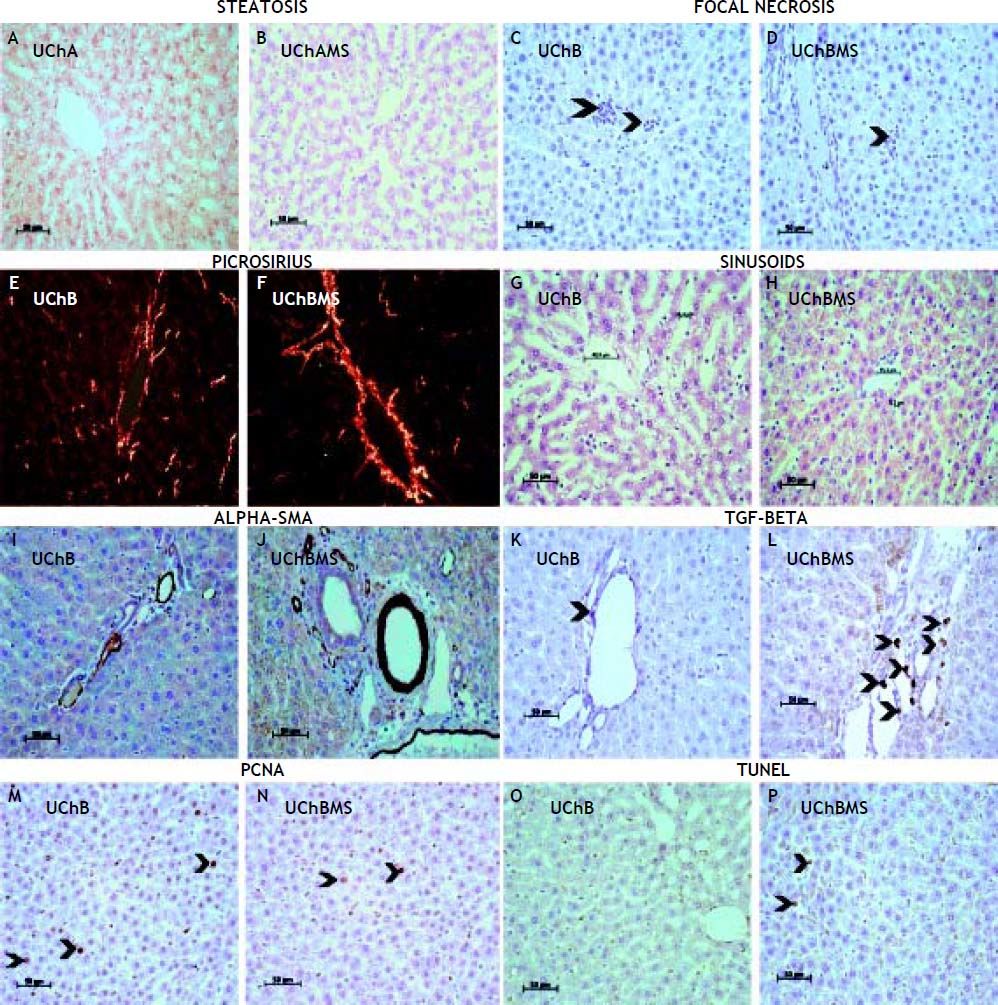
Table 3 shows decrease of focal necrosis (Figures 2C, 2D) and sinusoidal capillarie diameter (Figures 2G, 2H) in the UChBMS, and increase of microvesicular (Figures 2A, 2B) steatosis in the UChAMS.
Mean and standard deviation of focal necrosis, microvesicular steatosis and sinusoidal capillarie diameter (μm), according to the group (UChA and UChB), and experimental condition (control and MS).
 of UChB and UChBMS, HE. E, F. Picrosirius red of UChB and UChBMS. G, H. Sinusoids of UChB and UChBMS, HE. I, J. Alpha-SMA of UChB and UChBMS. K, L. TGF-beta (arrowhead) of UChB and UChBMS. M, N. PCNA (arrowheads) of UChB and UChBMS. O, P. TUNEL (arrowheads) of UChB and UChBMS.")
Photomicrograph showing interaction MS and EtOH on the liver tissue. A, B. Steatosis of UChA and UChAMS, HE. C, D. Focal necrosis (arrowheads) of UChB and UChBMS, HE. E, F. Picrosirius red of UChB and UChBMS. G, H. Sinusoids of UChB and UChBMS, HE. I, J. Alpha-SMA of UChB and UChBMS. K, L. TGF-beta (arrowhead) of UChB and UChBMS. M, N. PCNA (arrowheads) of UChB and UChBMS. O, P. TUNEL (arrowheads) of UChB and UChBMS.
Table 4 shows an increase in the area of perilobular vessels by the presence of a-SMA (Figures 2I, 2J) and in the number of immunostaining HSC (Figures 2K, 2L) in the UChBMS. Conversely, a decreased cell proliferation rate was common in the UChBMS (Figures 2M, 2N), whereas apoptosis had an increase in the UChAMS and UChBMS (Figures 2O, 2P).
Mean and standard deviation of the area of the Anti-SMA in perilobular vessels, the HSC by the Anti-TGF-Beta and the stained hepatocyte nuclei proportion by PCNA and TUNEL, according to the group (UChA and UChB), and experimental condition (control and MS).
| Variables | Groups | |||
|---|---|---|---|---|
| UChA | UChAMS | UChB | UChBMS | |
| Area | 1,063.0± 306.3a* | 1,310.4 ± 143.0a | 1,155.6 ± 188.4a | 1,488.6 ± 300.6b |
| HSC | 3.58 ± 1.02a | 4.74 ± 0.51a | 4.58 ± 1.80a | 6.48 ± 1.92b |
| PCNA | 0.0036 ± 0.0007a | 0.0035 ± 0.0005a | 0.0079 ± 0.0018b | 0.0032 ± 0.0012a |
| TUNEL | 0.0027 ± 0.0007a | 0.0055 ±0.0020b | 0.0028 ± 0.0006a | 0.0068 ± 0.0021b |
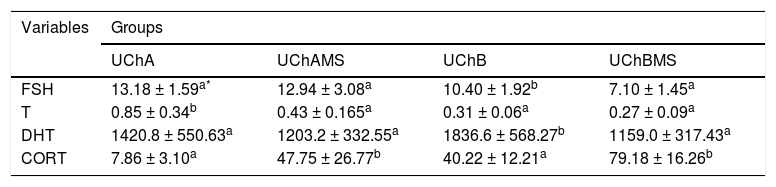
Table 5 shows decrease of FSH and DHT in the UChBMS, and T in the UChAMS, and increase of CORT in the UChAMS and UChBMS.
Mean and standard deviation of plasma FSH (ng.mL-1), T (ng.mL-1), DHT (mg.dL-1) and CORT (ng.mL-1), according to the group (UChA and UChB), and experimental condition (control and MS).
Table 6 shows increase of TC in the UChAMS and UChBMS.
Mean and standard deviation of plasma TC (mg.dL-1), TG (mg.dL-1), HDL-C (mg.dL-1), LDL-C (mg.dL-1) and VLDL (mg.dL-1), according to the group (UChA and UChB), and experimental condition (control and MS).
| Variables | Groups | |||
|---|---|---|---|---|
| UChA | UChAMS | UChB | UChBMS | |
| TC | 68.4 ± 5.86a* | 81.4 ± 12.56b | 75.8 ± 8.41a | 90.2 ± 3.03b |
| TG | 89 ± 9.85a | 100.5 ± 17.5a | 107.2 ± 13.61a | 110.8 ± 10.73a |
| HDL-C | 22.6 ± 1.52a | 23.6 ± 1.52a | 21.2 ± 1.30a | 23 ± 1.87a |
| LDL-C | 31.4 ± 5.66a | 38.92 ± 8.51a | 42.24 ± 9.65a | 44.28 ± 7.94a |
| VLDL-C | 14.34 ± 2.51a | 19.32 ± 4.83a | 20.76 ± 3.76a | 22.2 ± 3.81a |
There was interaction of MS-EtOH on the liver structure: increased mass, peritubular vessels, stellate cell numbers, steatosis and cell death, decreased necrosis, sinusoidal capillary diameters and cell proliferation. There was a decrease in FSH, T and DHT levels whereas CORT and cholesterol were increased.
The liver mass may vary with the presence of inflammatory cells, deposition of lipid and collagen, being a marker of liver regeneration, but rarely is a solid parameter.16 Apoptosis did not affect the liver mass. However, the number of mitoses, especially, microvesicular steatosis and COLL production has been the main responsible for the gain in liver mass.
The imbalance in the extracellular matrix leads to liver fibrosis because of progressive fibrotic septum thickness and chemical cross-linking of COLL.17 The altered matrix contains COLL I, II and fibronectin.18 These alterations change the environment of the matrix, preventing normal flow of the plasma-way between the sinusoid and the hepatocytes light by changing the liver function. This may also be related to increased apoptosis, because the altered matrix cannot avoid death and proteolysis of growth factors. The healing is a common response to liver injury against toxic, metabolic and viral insults.17
Ethanol induces overexpression of CYP2E1 and sensitizes Kupffer cells to produce lipopolysaccharide (LPS) with amplification of ROS production and activation of NF-kB, resulting in increased production of TNF-α. ROS lead to hepatocyte necrosis, inducing phagocytosis and antibody production, damaging them. The interaction of MS decreased necrosis, possibly due to increased programmed cell death19.
EtOH alters the metabolic pathways to increase the activity of nuclear receptors related to the synthesis and release of lipoproteins and decrease the β-oxidation of fatty acids, leading to steatosis with progressive loss of hepatocytes.19 The UChA rats increased microvesicular steatosis associated with MS, so it is more sensitive to variations in EtOH intake.
The sinusoid vascular congestion has direct dependence of MS and EtOH amount. The sinusoidal dilatation suggests elimination strategy of hepatic metabolites. Alterations on sinusoidal flow or small increases in portal pressure, may cause circulatory stasis20 that may increase hypoxia and aggravate the liver injury since this is the place of biotransformation activity related to EtOH metabolism. The absence of basal membrane becomes hepatic sinusoids sensitive to changes in blood pressure. In general, EtOH promotes sinusoidal constriction in mice, accompanied by blood stasis.21 Vasoactive substances induced by EtOH may alter the hepatic circulation and microcirculation and can be further exacerbated by stress.22
During liver injury, the quiescent HSC are induced by paracrine signal to an activated condition.23 Alter their cytoplasm rich in lipids and begin to show a greater capacity for proliferation, motility, contractility, COLL synthesis, and extracellular matrix components (EMC). Furthermore, the cytoplasmic contractile processes adhered to sinusoids affects hemodynamics, thus becoming essential in the pathogenesis of fibrosis and portal hypertension.24–26 We noted the strong action of MS on the degree of HSC activation, as evidenced by the intensity of sinusoidal constriction and collagen deposition. The activated HSC regulates the flow during the intrahepatic injury through extensive long cytoplasmic foot processes, embrace the sinusoids and resemble tissue pericytes, a cell population thought to regulate blood flow by modulating pericapillary resistance.27 The regulatory mechanisms that control gene expression in HSCs during fibrosis have focused primarily on transcriptional control pathways.28
The accumulation of ECM and scar formation is a result of chronic liver injury, including ALD.29 Under normal conditions, the HSC are quiescent and fulfill various functions in the liver, among them the most important are: storage of vitamin A, intercellular communication (mediators) and remodeling of the ECM. The TGF-beta is secreted by various cell types and in the liver by HSC. Autocrine, paracrine and intercellular stimuli resulting from chronic tissue injury promotes the expression of genes capable of producing cellular changes, leading HSC to assume COLL-like myofibroblastic phenotype.30,31 The TGF-beta acts in an autocrine manner on the HSC to modulate the production of alpha-SMA, an essential molecule for the activation of myofibroblasts and secretion of ECM proteins, mainly type I COLL.32 This event further alter the function and homeostasis of the liver parenchyma.33 The TGF-Beta has broad functional plasticity resulting from distinct signaling pathways,6,34 mostly having anti-apoptotic properties.35 The increase in the production of COLL, alpha-SMA and TGF-Beta confirmed the interaction MS and EtOH on the activation of HSC.
The proliferative activity, apoptosis and morphological changes are important in assessing the behavior of hepatocytes against aggression. Apoptosis is an indicator of liver damage and is associated with increased enzyme activity derived from hepatocyte.36,37 Apoptosis is dramatically associated with EtOH intake38 due to production of ROS and proinflammatory cytokines by innate immune cells.39 The interaction MS and EtOH was able to reduce the number of mitosis and increase apoptosis.
EtOH is anxiolytic at low doses. However, the repeated exposure is associated with neuroadaptative changes, persistent in stress situations.40 CORT is responsible for decreased phagocytosis after stress caused by cold.41 There is interaction between the MS and EtOH-mediated corticotrophin-releasing factor (CRF).42 CRF belongs to excitatory and inhibitory circuits that modulate behavioral states of stress, anxiety and self-administration of drugs, playing an important role in determining the fine balance between excitation and inhibition of brain circuits.40,43 The interaction MS-EtOH increased the production of CORT. Stressors agents such as EtOH are able to increase adrenomedullary gene expression to synthesize catecholamines. Likewise, serum catecholamine levels may also vary during exposure of EtOH and MS.44
EtOH can modify behavioral and neurochemical mechanisms induced by stress. It can still interfere with catecholamines, CORT, non-esterified fatty acids, and amino acids. Its mediation occurs through endogenous opioids, GABA, HPA axis and the noradrenergic system.40,44 The mechanisms involved in the reduction of T and DHT are related to the suppressive effect of EtOH on T synthesis and to the reduction of FSH during high EtOH consumption.
Chronic exposure to EtOH causes hypercholesterolemia due to a decrease in the number of LDL receptors in the liver.45 EtOH consumption is often associated with increase in oxidative stress, production of proinflammatory cytokines and adhesion molecules such as intercellular adhesion molecule-1 (ICAM-1) and vascular adhesion molecule-1 (VCAM-1) which promote atherosclerotic plaque formation.46 Stress can activate the HPA axis and result in hypersecretion of corticosteroids and desensitization of its central receptors. This hyperactivity of the HPA axis futher results in hepatic lipid transformation and hypercholesterolemia,47 corroborating the findings in UCh rat.
The etiologies of chronic liver diseases, such as hepatitis, alcoholic liver disease, nonalcoholic fatty liver, and their downstream effect cancer will allow effective therapies and advances in biomarkers for chronic liver diseases.48
In conclusion, there is interaction of MS-EtOH on the liver structure, dependent on the amount of EtOH intake. The interaction of stress and drugs can increase or decrease the effects directly on the liver or indirectly via hypothalamic-pituitary-adrenal (HPA) and hypothalamic-pituitary-gonadal (HPG) axes.
SupportFAPESP São Paulo Research Foundation (08/ 56229-8) and CAPES Coordination of Improvement of Higher Education Personnel.


