


Introduction.ARFI is a new technique that uses acoustic push pulse to generate tissue displacement resulting in shear wave propagation, can be used to measure elasticity of tissue. We aim to assess feasibility of ARFI as a non-invasive method to measure liver fibrosis compared to histological fibrosis scores and to compare our results with the published pooled-meta-analysis cut off values.
Material and methods. Prospective study to compare median velocities of ARFI shear wave measurements (Virtual Touch Imaging™ ACUSON S2000, Siemens, Mountain View CA) with Batts and Ludwig liver fibrosis scoring system F0-F4.
Results. 70 patients (mean = 49 years) were included. Etiologies were chronic hepatitis C (n = 43), chronic hepatitis B (n = 7) and others (n = 20). Median ARFI values (m/sec) for fibrosis stages and inflammatory stages measured were F0: 1.52, 1.42; F1: 1.50, 1.37; F3: 2.36, 2.41 and F4: 2.61. Areas under the curve for grade 3 = 0.875, stage 3 = 0.867; grade 2 = 0.4, stage 2 = 0.3.Using the cut-off ARFI value of 1.34 m/s for F ≥ 2 suggested in the meta-analysis, we found sensitivity of detecting true F > 2 is 68%, specificity 66%, PPV 74% and NPV 59%. For F ≥ 3 using the cut-off ARFI value of 1.55 m/s, we found sensitivity of 95%, specificity 86%, PPV 74% and NPV 98%. No stage 4 was compared due to insufficient cases.
Conclusion. ARFI has strong correlation with higher fibrosis scores compared to lower. When compared to the pooled meta-analysis cut off values, the sensitivity and specificity for detecting true F ≥ 3 are higher than that of F ≥ 2.
Chronic hepatitis, in particular secondary to hepatitis C remains an important public health issue as it affects 3% of the population worldwide.1 The sequelae of chronic hepatitis are liver fibrosis, cirrhosis, liver failure and the development of hepatocellular carcinoma (HCC). The assessment of liver fibrosis is therefore clinically important in predicting outcome and prognosis. HCCs rarely develop without the underlying fibrosis and cirrhosis.2 Traditionally, liver biopsy has been used and still is the gold standard method for staging fibrosis.3,4 The procedure has several disadvantages; its invasive nature has associated morbidity and mortality,5 heterogeneous involvement of liver fibrosis and inter-observer variability in histological grading of the specimens.6 Biopsying a small core of tissue thus may not be representative of the full extent of disease.
As a consequence, there is considerable research into finding the best non-invasive method of assessing liver fibrosis. Several serum biomarkers have been shown to predict severe liver fibrosis.7,8 simple scoring systems which incorporate patients’ routine laboratory measurements have been devised to improve the diagnosis of liver fibrosis9 and elastography using ultrasound and magnetic resonance based imaging have also been developed.10 There has been considerable interest in the development and usage of transient elastography, (Fibroscan® Echo Sens, Paris France) which has been shown to be a promising non-invasive method for the assessment of liver fibrosis.11 Fibroscan® is limited by obesity for patients with body mass index exceeding 28,12 interven-ing ribs and the presence of ascites, even though there is extensive experience in this technique. There is also a lack of anatomical correlation with high-resolution ultrasound imaging and the absence of diagnostic imaging capability (e.g. surveillance for hepatocellular carcinoma, portal hypertensive changes and portal vein thrombosis).
Acoustic radiation force impulses (ARFI) is a new imaging tool, which uses acoustic-push pulse to generate acoustic shear wave on a region of interest and uses tissue displacement response to estimate the elasticity of the particular tissue. The speed of shear wave propagation is expressed in meters per second (m/s). The peak displacement amplitude is inversely proportional to the elasticity of tissue which is based on Young modulus. It has been shown that the time to peak displacement and recovery time correlates with tissue stiffness.13 To generate useful images, ultrasound tracking algorithm is utilised and commercially available ultrasound machines have since been developed which is able to incorporate acoustic radiation forces generated on tissues and monitor their displacements, using correlation-based methods. The data collected is then used to generate transient information of the time to peak tissue displacement and recovery time which can be use to derive the tissue stiffness.14
There is increasing interest in this technique with several studies published in the recent literature comparing ARFI with other non-invasive methods and liver biopsies as reference standards in the assessment of liver fibrosis. The pooled meta-analysis by Friedrich-Rust, et al. attempts to find a cut-off ARFI value for each histological fibrosis stage.15 In several recent studies, ARFI has been compared with other non-invasive techniques16 or liver biopsies but in these, biopsy was not performed at the time of ARFI measurement.17 Additionally, to our knowledge, there has been no prospective study that compares the cut-off ARFI value and same day liver biopsy with the recommended pooled-meta-analysis ARFI values.
The primary end point of our study is to compare ARFI values with the histological assessments of liver fibrosis and inflammatory activities expressed in stage and grade respectively, which is the current gold standard.
A secondary end point is a comparison of our results with the cut-off values for each histological staging recommended in the pooled meta-analysis, the largest series to date.
Material and MethodsNo direct financial support was provided for this study. Ethics approval was obtained from the Uni- versity of British Columbia Ethics Research Board. Consecutive patients who were referred for percutaneous core liver biopsy from the Division of Gastroenterology were recruited. Study period was from September 2009 to January 2012.
Inclusion criteriaAll patients referred for ultrasound-guided percutaneous liver biopsies with a history of chronic liver disease for the assessment of liver fibrosis. Patients who were able to provide full informed consent for the study in addition to the required informed consent for the liver biopsies.
Exclusion criteriaPatients who were unable to provide full informed consent for the study even though consent via family members may have been obtained for the clinically needed liver biopsy. Abnormal coagulation profiles that preclude liver biopsies based on departmental protocol; international normalized ratio (INR) > 1.5, prothrombin time > 50 seconds and platelet count < 50,000/mL. Relative and absolute contraindications to liver biopsy e.g. biliary ductal dilatation, ascites, and presence of hepatocellular carcinoma.
UltrasoundAll patients attended for liver biopsies had abdominal ultrasounds performed by qualified technologists prior to the biopsies. After it was deemed safe to biopsy, with consent obtained both for the study and the biopsy, the radiologists (WWY and RK with 5 years of ultrasound experience each) then positioned the patient appropriately and selected the area to biopsy. ARFI measurements were obtained from the chosen location. The measurements were taken from the right lobe, not more than 5 cm from the skin surface, using an intercostal approach. After the measurements were recorded, a single core needle biopsy using an 18G biopsy needle, was taken from the area in which the measurements were made. Specimens were fixed in formalin and sent to the laboratory. Patients recovered and were monitored in the department for one hour prior to discharge.
Acoustic radiation frequency impulsesARFI technology uses tissue strain imaging to assess tissue stiffness. A baseline measurement obtained by passing a diagnostic intensity ultrasound pulse through the tissue to be assessed, and a short duration (about 100 microseconds) high intensity ‘push’ pulse is subsequently transmitted through the same tissue. Diagnostic intensity tracking beams are then used to assess the magnitude of displacement.18,19 Most tissues show displacement magnitudes between one and 20 microns. Peak displacement time is usually less than one millisecond. Most tissues revert to their original state within five milliseconds.20,21
Siemens ACUSON S2000 (Virtual Touch Imaging™, Siemens, Mountain View, CA) Virtual Touch Tissue quantification method of ARFI with a diagnostic 1-4 MHz transducer was used for our study. In this method, the velocity of the propagated shear wave measured by the generation of a numerical value usually expressed in meters per second (m/s), which correlates with the stiffness of the tissue. A conventional B mode ultrasound image was obtained and an ROI (region of interest) was placed within the tissue. A median of 10 measurements were obtained for each patient, expressed in m/s, and median values calculated. All measurements were taken under direct sonographic visualization from the right lobe of the liver. Factors such as aortic pulsation, respiratory fluctuations and presence of food in the stomach may be responsible for left lobe measurements being less accurate22 (Figure 1) (e.g. of ARFI measured on ultrasound).

The Batts and Ludwig scoring system for chronic hepatitis and liver fibrosis was used where necro-inflammation is graded and fibrosis is staged using a five-point scale, grade and stage 0-4.23 The biopsy core was deemed adequate if the specimen was two cm or longer in length. Grading is a measure of the severity of necro-inflammation with lymphocytic piecemeal necrosis, lobular inflammation and necrosis as criteria. Numerical values are given.23
- •
Grade 0. Portal inflammation only or no activity.
- •
Grade 1. Minimal and patchy involvement.
- •
Grade 2. Mild-involving some of the portal tracts.
- •
Grade 3. Moderate involving all portal tracts.
- •
Grade 4. Severe-may have bridging fibrosis.
The fibrosis score is as follows:
- •
Stage 0. No fibrosis.
- •
Stage 1. Fibrosis confined to portal tracts.
- •
Stage 2. Fibrosis extending into the periportal region with rare portal to portal septae.
- •
Stage 3. Many fibrous septae extending into the parenchyma but no cirrhosis.
- •
Stage 4. Cirrhosis.
The primary outcome measure is the median ARFI value computed from 10 measurements per patient. As was done in previous research with ARFI scores, the median was used to remove effects of any unusual observations (a companion analysis was carried out using mean ARFI scores, but results were not different from those using median ARFI scores). SPSS version 20 was used for all statistical analysis. Scatterplots, Pearson and Spearman correlation coefficients were computed to assess association between ARFI values and fibrosis stage and grade. The cut-offs identified in a meta-analysis by Friedrich-Rust, et al.15 were used to define significant and severe fibrosis. Using these binary definitions, and each binary split of fibrosis grade and stage, two-by-two tables were constructed and sensitivity, specificity, positive predictive value and negative predictive value computed. Receiver operating characteristic (ROC) curves, and area under the curve, were calculated for each two-by-two table.
ResultsSeventy-one patients met the inclusion criteria. One patient was excluded due to complete necrosis of the core biopsy specimen obtained as a result of acute hepatic necrosis secondary to autoimmune hepatitis. ARFI values of 70 patients were available for analysis. There were 31 females and 39 males, mean age of 49 years (range 20-83 years). Etiologies of the chronic liver disease were divided into 43 chronic hepatitis C, 7 chronic hepatitis B and 20 others comprised of 7 autoimmune hepatitis, 1 primary biliary cirrhosis, 2 alcoholic hepatitis, 5 non alcoholic steatohepatitis (NASH), 2 cryptogenic hepatitis and cirrhosis, 1 cholestatic hepatitis, 1 methotrexate induced hepatitis and 1 Wilson’s disease.
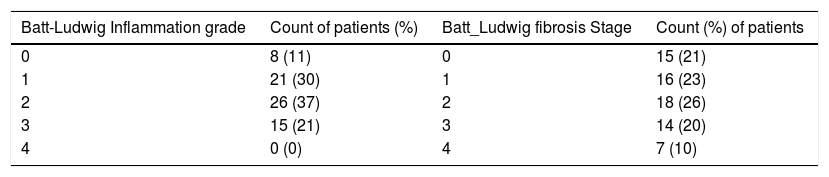
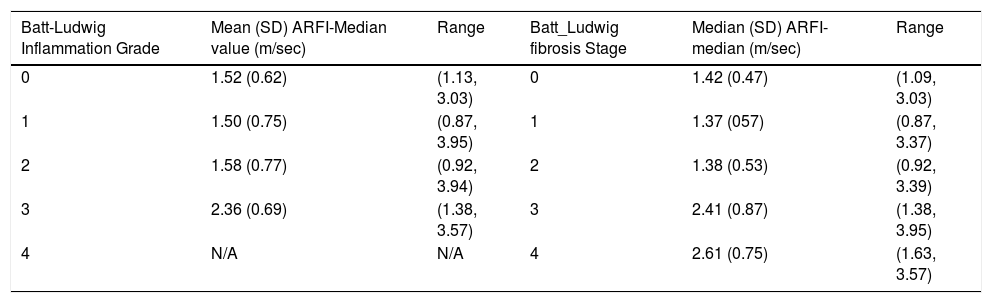
The number and percent of patients at each grade and stage of fibrosis score are presented in table 1. Descriptive statistics of ARFI values for each fibrosis grade and stage are shown in table 2. Correlation between ARFI and histological findings shown in figure 2 for Batts and Ludwig grade and figure 3 for Batts and Ludwig Stage. AUROC for Batts and Ludwig grade 3 = 0.875 showed in figure 4. AUROC for stage 3 is 0.867 shown in figure 5. Area under the curve for stage 2 is 0.3 and grade 2 is 0.4.
Mean, standard deviation and range of ARFI-Median values at each level of Batt and Ludwig fibrosis grade.
| Batt-Ludwig Inflammation Grade | Mean (SD) ARFI-Median value (m/sec) | Range | Batt_Ludwig fibrosis Stage | Median (SD) ARFI-median (m/sec) | Range |
|---|---|---|---|---|---|
| 0 | 1.52 (0.62) | (1.13, 3.03) | 0 | 1.42 (0.47) | (1.09, 3.03) |
| 1 | 1.50 (0.75) | (0.87, 3.95) | 1 | 1.37 (057) | (0.87, 3.37) |
| 2 | 1.58 (0.77) | (0.92, 3.94) | 2 | 1.38 (0.53) | (0.92, 3.39) |
| 3 | 2.36 (0.69) | (1.38, 3.57) | 3 | 2.41 (0.87) | (1.38, 3.95) |
| 4 | N/A | N/A | 4 | 2.61 (0.75) | (1.63, 3.57) |
 and grading of liver necroinflammatory process.")
 and Batts and Ludwig stage.")
 for Batts and Ludwig grade 3 = 0.875.")
 for Stage 3 is 0.867.")
The authors of the pooled meta-analysis15 with which our results are compared, have defined F ≥ 2 as significant fibrosis, F ≥ 3 as severe fibrosis and F = 4 as cirrhosis. They chose optimum cut-off values of 1.34 m/s for F ≥ 2, 1.55 m/s for F ≥ 3 and 1.80 m/s for F = 4. Using the cut-off ARFI value of 1.34 m/s for significant fibrosis as suggested by the metaanalysis, our study found a sensitivity of detecting true F ≥ 2 is 68%, specificity of 66%, positive predictive value (PPV) of 74% and negative predictive value (NPV) of 59%. For F ≥ 3 (severe fibrosis) using the cut-off ARFI value of 1.55 m/s, our study found a sensitivity of 95%, specificity of 86%, PPV of 74% and NPV of 98%.
We were not able to compare the cut-off values suggested by the meta-analysis for stage 4 as we only have one patient has histologically proven cirrhosis.
DiscussionIn patients with chronic liver disease, the assessment of fibrosis is paramount in aiding clinical decision-making, to discuss prognosis and in treatment planning which may include transplantation. Traditionally, histopathological grading is the gold standard. With the advent of non-invasive imaging techniques, there is increasing interest in the utility of these methods, with the hope of reducing the number of invasive liver biopsies needed.
Currently, the most widely used non-invasive technique is transient elastography (TE- Fibroscan®). This technique is influenced by gender, by body mass index and by metabolic syndrome.24 Obesity is one of the limiting factors, but this has been partially solved by the development of a large XL probe, designed to assess liver more than 2.5 cm from the skin. However, the validity and cut-off value for this probe in the assessment of fibrosis has not been established.25 The lack of real-time morphological assessment of the liver using this technique also potentially limits its use.
ARFI technology provides non-invasive information about mechanical properties of tissue, with additional advantage of concomitant high quality imaging, since ARFI technology is incorporated into a conventional ultrasound machine. The assessment of the background liver, complications of chronic liver disease (e.g., development of hepatocellular carcinoma or ascites), and Doppler assessment of hepatic vasculature can all be performed together with the evaluation of the severity of fibrosis.
The potential clinical use of ARFI was shown in vivo20 and since then, growing interest has developed in evaluating its clinical utility. This technique had been used to assess multiple organs with variable results, for example, the thyroid gland,26 the testicles27 and assessment of fibrosis post renal transplant.28 Its use in the assessment of liver fibrosis is one of the most widely evaluated. Multiple studies have been performed to assess the degree of fibrosis in the presence of known chronic liver disease.17,25
Our results are comparable with other published data that showed that ARFI measurements increase as the liver fibrosis grade using Batts and Ludwig score, increase (2.61 m/s for fibrosis stage 4). At the lowest fibrosis score, in our study, unlike that by Frederick-Rust, et al.17 no healthy volunteers were included. The aim of our study was histological correlation with ARFI without the utility of other parameters, therefore, obtaining our local ethics committee approval to biopsy normal volunteers as controls will not be possible and will be deemed unethical. The median ARFI values for grade and stage 0 were 1.52 m/s and 1.42 m/s respectively.
One patient had a value of 3.03 m/s, but moderate hepatic steatosis (30% of fat) was found in this specimen, which may have affected the measurement. In the presence of non-alcoholic fatty liver disease (NAFLD) or non-alcoholic hepatic steatosis (NASH), the correlation of ARFI value with fibrosis stage is not as good as those published on viral hepatitis.25,29 The correlation with severe fibrosis and cirrhosis is better using transient elastography with an XL probe than using ARFI in this group of patients.
Most of the other studies also utilized healthy volunteers with no known history of chronic liver disease and stage their fibrosis as F0 in the assumption that their livers are healthy without correlated with liver function tests or other serum biomarkers. In those populations in the published study17 considerable variability was demonstrated in the measured ARFI values with some volunteers having values that reached those with cirrhosis. In our study group, stage and grade 0 were histological proven, albeit small in number (Table 1), it showed that apart from one patient with high ARFI value and intercurrent hepatic steatosis, median ARFI values were below 1.5 m/s.
Multiple previous studies have managed to calculate cut-off values for their respective stages of fibrosis above grade 1, and some correlating with histopathological findings. Lupsor, et al.30 showed that the cut-off values (m/s) for fibrosis stages were: 1.19 (F ≥ 1), 1.34 (F ≥ 2), 1.61 (F ≥ 3) and 2.00 (F4). The study was performed in 112 patients. When they compared ARFI and TE, the areas under the receiver operating characteristic curves (AUROC) were 0.709 vs. 0.902, P = 0.006 (F ≥ 1), 0.851 vs. 0.941, P = 0.022 (F ≥ 2), 0.869 vs. 0.926, P = 0.153 (F > 3) and 0.911 vs. 0.945, P = 0.331 (F4). Sporea, et al.31 showed that the cut-off values for predicting the stages of fibrosis were 1.19 m/s for F ≥ 1 (based on Metavir staging system), 1.21 m/s, (F ≥ 2 ), 1.58 m/s (F ≥ 3) and 1.82 m/s (F = 4). This was conducted in 247 patients with hepatitis C and the correlation of 0.707 (Spearman r) was found.
In our pilot study32 of 21 patients, the median values of the ARFI measurements and the histological fibrosis stage using modified Ishak score and Batts-Ludwig score were both highly significant (p < 0.01) with rho = 0.69 and rho = 0.72 respectively. The median ARFI for the pilot study population ranged from 0.92 to 4.17 m/sec. AUROC for the accuracy of ARFI imaging using both Ishak and Batts-Ludwig scores were 1.00 and 0.35, for the diagnosis of moderate fibrosis (histologic fibrosis stage F ≥ 2) and 0.85 and 0.85 respectively for the diagnosis of cirrhosis.
Our current study found that the correlations of ARFI values with fibrosis stage and inflammatory grade ≥ 3 were 0.86 and 0.87, respectively. However, the correlation was poorer for grade and stage < 3. We were not able to calculate meaningful ‘cut-off’ values for the respective fibrosis stages and inflammatory grades as shown on the scatter plot. This differs from the other previous studies. The reasons may be due to our relatively small sample size and heterogeneous group of patients, but all our patients’ measurements were correlated with histological grading and staging. Stage F2 represents ‘significant fibrosis’ group and F3 is ‘pre-cirrhosis’ and together with F1, they are also the intermediate group, the so-called ‘gray zone’, as other non-invasive methods have difficulty separating these groups reliably. Our study has shown that ARFI may be able to distinguish these two groups (F2 from F3) and this has clinical implication since treatments differ, especially in the context of viral hepatitis. There is emerging evidence however that liver biopsy has a 25% inherent error and the ‘gray zone’ is due to the artifact secondary to lower performance of biopsy for the intermediate group.33
In the second section where we compare our results with the pooled meta-analysis15 with cut-off value of 1.34 m/s for significant fibrosis, our study found that the sensitivity of detecting true F ≥ 2 was lower when compared to cut-off ARFI value of 1.55 m/s for F ≥ 3 (severe fibrosis). This demonstrates that the ARFI values we obtained in our study population correlated better when fibrosis stage is 3 or higher, which also mean that ARFI may not be as useful in patients when fibrosis stages are 2 or lower, when those proposed cut-off values were used. As shown on the scatterplot (Figures 1 and 2), there is very little difference in the ARFI values between F0 and F2, which suggests that this method may not be as useful in differentiating between lower fibrosis grades.
Comparable with other data, we have shown that ARFI is good at determining Stage F4 as our median value was 2.61 m/s. We were not however able to determine the cut off value suggested by the meta-analysis since our sample size for this group is small. Although the pooled meta-analysis is a positive attempt in collate data from a variety of generally relatively small sample size studies, unfortunately, this is subject to a large variability in study methods and techniques. In our study, there is no statistically significant difference in the ARFI values correlating with fibrosis stage or inflammatory grade, unlike what was previously reported. 34
The limitations of our study include relatively small sample size, heterogenous etiologies for liver fibrosis which may affect the results. In addition, Batts-Ludwig fibrosis score is a 5 point scoring system which may be insufficient in differentiating the diverse group of patients who have fibrosis stages of 0 to 2. When we used Ishak scoring systems in our pilot study,32 our correlation was better compared to when the Batts-Ludwig system was used. However, the Batts-Ludwig scoring system was the only one used in our current study as, it once again reflects our clinical practice if ARFI was going to be utilized for day-to-day clinical use.
Although there had been promising results in recent published literature, we do not think that the cut-off values proposed by the pooled meta-analysis should be incorporating into clinical practice as yet in view of the poor sensitivity of detecting F ≥ 2, although better results seen for F ≥ 3. Further research with a prospective longitudinal study for tracking temporal progression of fibrosis in patients at risk may be able to expand the use of ARFI.
In conclusion, our study showed that ARFI measurements increase as fibrosis stages and inflammatory grades increase. It correlates best with fibrosis grades and inflammatory stages 3 and above. In our study population, we did not find as good a correlation for F2 and lower, unlike that found in other published data. When we compare our results with the meta-analysis using the proposed cut-off values, the sensitivity, specificity, positive and negative predictive values are best when fibrosis stage is 3. These findings may be of value clinically as ARFI may be able to distinguish the two stages in the intermediate group (F2 vs. F3) which also traditionally known as the ‘gray zone’.
Abbreviations- •
ARFI: acoustic radiation force imaging impulse.
- •
AUROC: area under receiver operating characteristic.
- •
HCC: hepatocellular carcinoma.
- •
INR: international normalized ratio.
- •
m/s: meters per second.
- •
NAFLD: non-alcoholic fatty liver disease.
- •
NASH: non alcoholic steatohepatitis.
- •
NPV: negative predictive value.
- •
PPV: positive predictive value.
- •
ROC: receiver operating characteristic.
- •
ROI: region of interest.


