


Background & aim. This study assessed the involvement of metabolic factors (anthropometric indices, insulin resistance (IR) and adipocytokines) in the prediction of portal hypertension, esophageal varices and risk of variceal bleeding in cirrhotic patients.
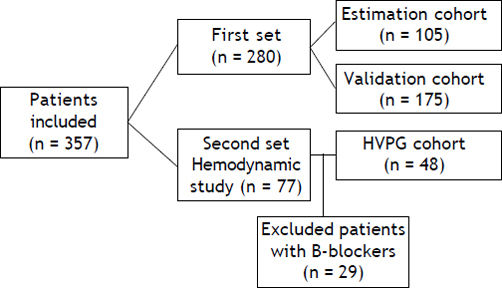
Material and methods. Two prospective and retrospective cohorts of cirrhotic patients were selected (n = 357). The first prospective cohort (n = 280) enrolled consecutively in three centers, underwent upper gastrointestinal endoscopy, seeking evidence of esophageal varices. Clinical, anthropometric, liver function tests, ultrasonographic, and metabolic features were recorded at the time of endoscopy, patients were followed-up every 6 months until death, liver transplantation or variceal bleeding. The second retrospective cohort (n = 48 patients) had measurements of the hepatic venous pressure gradient (HVPG). Statistical analyses of the data were with the SPSS package.
Results. The presence of esophageal varices was independently associated with lower platelet count, raised HOMA index and adiponectin levels. This relationship extended to subset analysis in patients with Child A cirrhosis. HOMA index and adiponectin levels significantly correlated with HVPG. Beside Child-Pugh class, variceal size and glucagonemia, HOMA index but not adiponectin and leptin plasma levels were associated with higher risk of variceal bleeding.
Conclusion. In patients with cirrhosis, HOMA score correlates with HVPG and independently predict clinical outcomes. Three simple markers i.e. platelet count, IR assessed by HOMA-IR and adiponectin significantly predict the presence of esophageal varices in cirrhotic patients.
Portal hypertension (PHT) is a key factor in the pathogenesis of cirrhosis outcomes. Esophageal varices (EV) are present in approximately 24 to 80% of cases1 and variceal bleeding (VB) still carries a mortality of up to 20% within 6 weeks of the bleeding episode. The Baveno IV Consensus Conference on PHT recommended that all cirrhotic patients should be screened for presence of varices. Endoscopy should be performed at 2–3 yearly intervals in patients without varices and at 1–2 yearly intervals in patients with small varices.2 However, a generalized screening program of periodic upper gastro-esophageal endoscopy in cirrhotic patients leads to high costs, and patient compliance may become reduced. Hence, the selection of patients who may be at a higher risk of having gastro-esophageal varices would be highly beneficial, and cost-effective. In recent years a number of clinical, laboratory, and ultrasonographic variables have been explored as non-invasive alternatives to endoscopy.3 Recently, obesity and metabolic abnormalities have been identified as factors having an impact on the natural history of compensated cirrhotic patients; albeit not well characterized.4 EV marks a crucial turning point in the outcome of the disease.5 Adipocyte-derived hormones (leptin and adiponectin) are likely candidates to elucidate the biological mechanisms underlying obesity-mediated increase in disease risk. Leptin and adiponectin are inversely related to increasing adiposity,6 and the plasma leptin-to-adiponectin ratio may be a potential measure of insulin resistance (IR).7 However, it is still unknown whether these adipocytokines, by themselves or in association with IR and/or hyperinsulinemia, contribute to the progression of liver disease and development of EV in patients with cirrhosis. Hepatic vein pressure gradient (HVPG) has been established as gold standard in predicting the development of EV.8
We undertook this large-scale prospective multi-centered study to assess in cirrhotic patients, the value of several routinely-measurable clinical (anthropometric variables) and laboratory (including metabolic variables such as IR and adipocytokines) indices in relation to presence of EV and to develop an accurate non-invasive model for predicting the presence of EV. The second aim was to examine the possible prognostic value of those markers correlating with haemodynamics with regard to clinical outcome. The third aim was to explore the relationship between IR, adipocytokines levels, and portal hemodynamics.
Material and MethodsStudy design and follow upThis was a multi-centered study conducted in 3 centers (2 in Spain and 1 in Egypt). Two sets of newly diagnosed cirrhotic patients, independently of etiology consecutively observed at the participating centers, between January 2009 and December 2011, and fulfilling all criteria detailed below were enrolled. Patients were included if they had a diagnosis liver cirrhosis based on clinical, biochemical, ultrasonographic and/or histological criteria. Exclusion criteria were: gastrointestinal bleeding; HIV, Schistosoma co-infection, or hepato-renal syndrome (HRS) within 1 month; prothrombin concentration < 40% and bilirubin > 2 mg/dL; patients with history of diabetes mellitus (DM), pregnancy; portal vein thrombosis; cardiac, renal or respiratory failure; previous surgical or transjugular intrahepatic portosystemic shunt (TIPS); hepatocellular carcinoma (HCC); cholestatic liver disease and treatment with vasoactive drugs (including β-blockers), statins, aspirin or other NSAIDs, antibiotics and antioxidants in the previous 2 weeks.
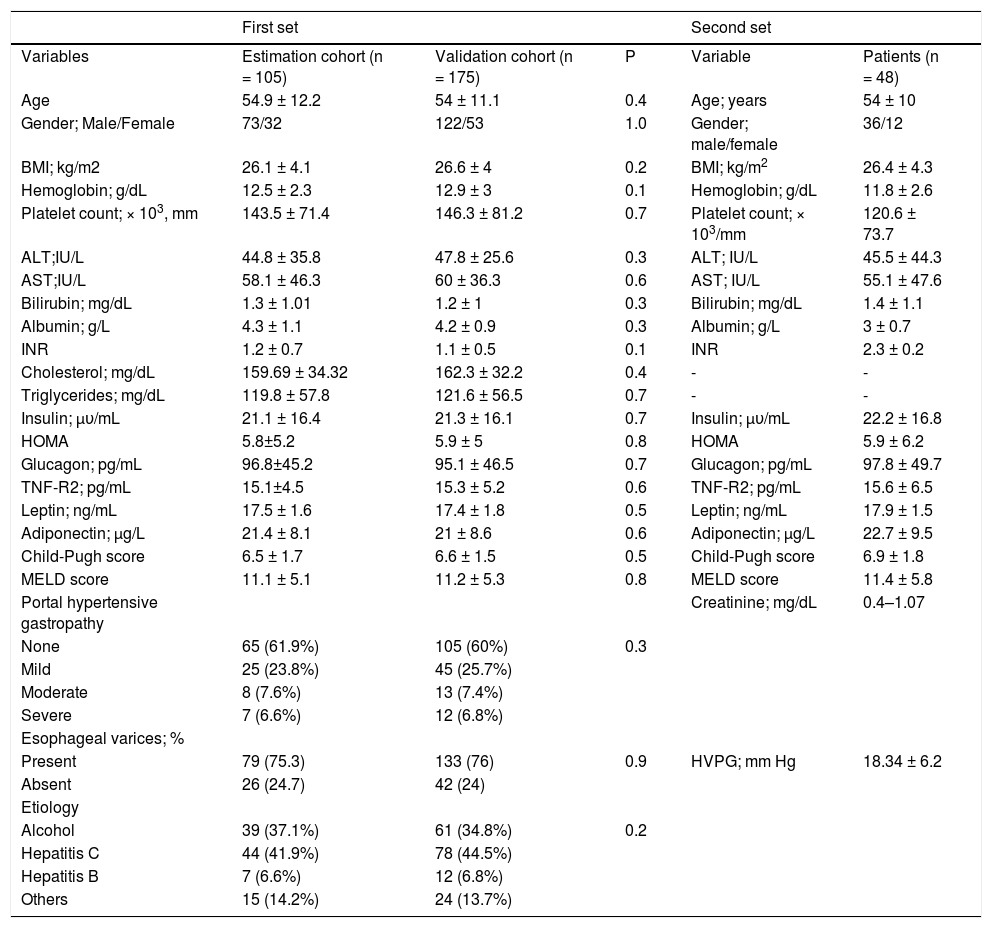
The first set was a prospective cohort in which all consenting newly diagnosed cirrhotic patients who underwent upper gastrointestinal tract endoscopy, was enrolled. This set involved 280 consenting individual patients; 105 in the estimation cohort and 175 in the validation cohort (Figure 1). There were 73 males and 32 females with mean age of 54.9 ± 12.2 years. The mean BMI was 26.1 ± 4.1. The mean HOMA-IR score was 5.8 ± 5.2. The mean Child-Pugh score was 6.5 ± 1.7. EV was recorded in 75% of patients (79 of 105). Alcoholic etiology 39 (37%), hepatitis C virus 44 (42%), hepatitis B virus 7 (6.6%) and others 15 (14.2%). The baseline characteristics of the patient validation cohort were comparable to those in the estimation cohort; 122 males (69.7%), mean age 54 ± 11.1 y; EV was recorded in 76% of patients (133 of 175). The mean HOMA-IR score was 5.9 ± 5. Liver function as scored on the Child-Pugh scale was 6.6 ± 1.5 (Table 1).

Demographic and baseline and hemodynamic characteristics of patients in the first set (estimation cohort) and the second set.
| First set | Second set | ||||
|---|---|---|---|---|---|
| Variables | Estimation cohort (n = 105) | Validation cohort (n = 175) | P | Variable | Patients (n = 48) |
| Age | 54.9 ± 12.2 | 54 ± 11.1 | 0.4 | Age; years | 54 ± 10 |
| Gender; Male/Female | 73/32 | 122/53 | 1.0 | Gender; male/female | 36/12 |
| BMI; kg/m2 | 26.1 ± 4.1 | 26.6 ± 4 | 0.2 | BMI; kg/m2 | 26.4 ± 4.3 |
| Hemoglobin; g/dL | 12.5 ± 2.3 | 12.9 ± 3 | 0.1 | Hemoglobin; g/dL | 11.8 ± 2.6 |
| Platelet count; × 103, mm | 143.5 ± 71.4 | 146.3 ± 81.2 | 0.7 | Platelet count; × 103/mm | 120.6 ± 73.7 |
| ALT;IU/L | 44.8 ± 35.8 | 47.8 ± 25.6 | 0.3 | ALT; IU/L | 45.5 ± 44.3 |
| AST;IU/L | 58.1 ± 46.3 | 60 ± 36.3 | 0.6 | AST; IU/L | 55.1 ± 47.6 |
| Bilirubin; mg/dL | 1.3 ± 1.01 | 1.2 ± 1 | 0.3 | Bilirubin; mg/dL | 1.4 ± 1.1 |
| Albumin; g/L | 4.3 ± 1.1 | 4.2 ± 0.9 | 0.3 | Albumin; g/L | 3 ± 0.7 |
| INR | 1.2 ± 0.7 | 1.1 ± 0.5 | 0.1 | INR | 2.3 ± 0.2 |
| Cholesterol; mg/dL | 159.69 ± 34.32 | 162.3 ± 32.2 | 0.4 | - | - |
| Triglycerides; mg/dL | 119.8 ± 57.8 | 121.6 ± 56.5 | 0.7 | - | - |
| Insulin; μυ/mL | 21.1 ± 16.4 | 21.3 ± 16.1 | 0.7 | Insulin; μυ/mL | 22.2 ± 16.8 |
| HOMA | 5.8±5.2 | 5.9 ± 5 | 0.8 | HOMA | 5.9 ± 6.2 |
| Glucagon; pg/mL | 96.8±45.2 | 95.1 ± 46.5 | 0.7 | Glucagon; pg/mL | 97.8 ± 49.7 |
| TNF-R2; pg/mL | 15.1±4.5 | 15.3 ± 5.2 | 0.6 | TNF-R2; pg/mL | 15.6 ± 6.5 |
| Leptin; ng/mL | 17.5 ± 1.6 | 17.4 ± 1.8 | 0.5 | Leptin; ng/mL | 17.9 ± 1.5 |
| Adiponectin; μg/L | 21.4 ± 8.1 | 21 ± 8.6 | 0.6 | Adiponectin; μg/L | 22.7 ± 9.5 |
| Child-Pugh score | 6.5 ± 1.7 | 6.6 ± 1.5 | 0.5 | Child-Pugh score | 6.9 ± 1.8 |
| MELD score | 11.1 ± 5.1 | 11.2 ± 5.3 | 0.8 | MELD score | 11.4 ± 5.8 |
| Portal hypertensive gastropathy | Creatinine; mg/dL | 0.4–1.07 | |||
| None | 65 (61.9%) | 105 (60%) | 0.3 | ||
| Mild | 25 (23.8%) | 45 (25.7%) | |||
| Moderate | 8 (7.6%) | 13 (7.4%) | |||
| Severe | 7 (6.6%) | 12 (6.8%) | |||
| Esophageal varices; % | |||||
| Present | 79 (75.3) | 133 (76) | 0.9 | HVPG; mm Hg | 18.34 ± 6.2 |
| Absent | 26 (24.7) | 42 (24) | |||
| Etiology | |||||
| Alcohol | 39 (37.1%) | 61 (34.8%) | 0.2 | ||
| Hepatitis C | 44 (41.9%) | 78 (44.5%) | |||
| Hepatitis B | 7 (6.6%) | 12 (6.8%) | |||
| Others | 15 (14.2%) | 24 (13.7%) | |||
* Data are presented as mean ± SD as percentage.
After enrollment all patients in the estimation cohort (105 patients) were followed in the outpatient clinic at 1, 3 and 6 months and every 6 months thereafter or whenever an adverse clinical event occurred during follow-up. Medical history, physical examination, biochemistry, hematology tests, abdominal ultrasound and alcohol consumption were recorded every 6 months. Follow-up data were collected for up to 2 years, or death, or liver transplantation, or if a derivative procedure was performed (TIPS or surgery). We registered the following clinical events:
- •
PHT-related events that included first VB; de novo ascites, hepatic encephalopathy requiring hospitalization, HRS and spontaneous bacterial peritonitis (SBP).
- •
Death.
- •
Liver transplantation.
In the second set, retrospective determination of metabolic factors (adiponectin, leptin and insulin) in frozen samples of cirrhotics that underwent a hepatic and systemic hemodynamic study for the evaluation of PHT (HVPG) study. We retrospectively included 77 patients underwent hemodynamic study, 29 who received prophylactic medications for VB were excluded, leaving 48 patients in the HVPG cohort; 36 males (75%), mean age 54 ± 10 y, liver function as scored on the Child-Pugh scale was 6.8 ± 1.8 and MELD score was 11.4 ± 5.8 points (Table 1).
The protocol was approved by the Institutional Ethics Committee of participating centers, and all patients gave informed consent to participate in this study. The study was conducted in accordance with the ethical guidelines of the Declaration of Helsinki and International Conference on Harmonization Guidelines for Good Clinical Practice.
Clinical and laboratory assessmentThe following data were collected at baseline: gender, age, geographical origin, daily alcohol intake in the past 6 months (g/day), body mass index (BMI), waist circumference, and routine laboratory tests. BMI was calculated as weight divided by the square of the height (kg/m2). Waist circumference was measured to the nearest 0.5 cm at the shortest point below the lower rib margin and the iliac crest. A 12h overnight fasting blood sample was drawn at the time of recruitment for the measurement of alanine aminotransferase (ALT), gamma-glutamyltransferase (gGT), total cholesterol, high-density lipoprotein cholesterol (HDL-C), triglycerides, fasting glucose, insulin, and platelet count. Insulin was determined by electrochemiluminescence immunoassay (Elecsys 2010; Roche Diagnostics, Indianapolis, Indiana, USA). IR was then investigated in all patients at baseline by the homeostasis model for the assessment of IR (HOMA-IR) using the standard formula:
HOMA-IR = fasting insulin (μU/mL) × fasting glucose (mmol/L)/22.5,
and IR arbitrarily defined as HOMA-IR > 2, 3 and 4 in different analysis. TNF-a was measured using an enzyme-linked immunosorbent assay (Quantikine ELISA; R&D System, Minneapolis, MN, USA). Serum glucagon, leptin and adiponectin levels were measured in duplicate by Luminex xMAP technology using a multiplex assay (Linco Research, St. Charles, MO, USA). The mean values of duplicate measurements were used in the statistical analyses.
Endoscopic studyUpper tract endoscopy was performed by three experienced operators (one in each center) who were blinded with respect to the results of non-invasive marker measurements, apart from those necessary to perform the endoscopy safely (e.g. platelet count and prothrombin time). All operators applied the following classification of EV: 0 = absent; I = thin EV vanishing with the endoscopic insufflations; II = non-confluent EV protruding into the lumen despite insufflations; III = confluent thick EV. Presence of red signs was also recorded in all patients, including those with small varices (EV grade I). According to the criteria proposed at the Baveno I Consensus Conference, patients with large EV were defined as grade PII.9
Hemodynamic studyAfter fasting overnight, the patients were transferred to the hepatic hemodynamic laboratory. Under local anesthesia, an 8F venous catheter introducer (Axcess; Maxim Medical, Athens, TX, USA) was placed in the right jugular vein under ultrasonographic guidance (SonoSite Inc, Bothell, Washington, USA) using the Seldinger technique. Under fluoroscopic control, a SwaneGanz catheter (Edwars Laboratory, Los Angeles, CA, USA) was advanced into the pulmonary artery for the measurement of cardiopulmonary pressures and cardiac output by thermal dilution. A 7F balloon-tipped catheter (Edwars Laboratory) was also advanced into the main right hepatic vein to measure the wedged hepatic venous pressure and free hepatic venous pressure. Mean arterial pressure was measured every 5 min by an external automatic sphygmomanometer (Marquette Electronics, Milwaukee, WI, USA). Heart rate was derived from continuous electrocardiogram monitoring. All measurements were performed in triplicate in each study period, and permanent tracings were obtained on a multichannel recorder (Marquette Electronics) for subsequent confirmatory analyses. Portal pressure was estimated from the HVPG and defined as the difference between wedged hepatic venous pressure and free hepatic venous pressure.
Statistical analysesDescriptive results were expressed as mean ± SD (standard deviation) or number (percentage) of patients with a condition. When appropriate, either the Student t-test, or non-parametric Mann-Whitney test or the Wilcoxon test was used to compare quantitative data, and the χ2 test was applied for comparison of frequency data. All tests were two-tailed and p values < 0.05 were considered significant. The two patient cohorts studied in the first set were the estimation cohort used to develop the predictive index for presence of EV and a second (validation) cohort in whom the derived index was assessed prospectively. In the initial cohort, univariate logistic regression was used to quantify the association between all the variables and the presence of EV. Using multiple logistic regressions; the independent predictors of the presence of EV in the best fitting model were identified. Receiver operating characteristic (ROC) curves were applied to determine the best cutoff values, and to identify the area under ROC curve (AUC) of the individual variables independently associated with the presence of EV. Significant variables in the multivariate analysis were also used to generate the model of EV probability and to illustrate its diagnostic capacity to identify those with EV in both the initial and the validation cohorts. Performance of the model was expressed as sensitivity, specificity, positive and negative predictive values (PPV and NPV, respectively), and positive and negative likelihood ratio (LR). Sensitivity, specificity, PPV and NPV were expressed as percentage. The diagnostic value of the model was expressed using the AUC and its corresponding 95% CI.
The adjusted influence of each marker on the risk of developing the clinical endpoints was estimated by a multivariate Cox analysis introducing the MELD score and HVPG as covariates. The contribution of each variable to the risk of reaching the endpoint was estimated by the relative hazard with its 95% CI. The best cut-off level of HOMA to predict the clinical outcome was selected using the Youden index, a well characterized objective method that maximized the sum of sensitivity and specificity. The discriminative ability of this cut-off to predict the prognosis was analyzed by Kaplan-Meier curves and compared with the log-rank test. Patients’ data were collected in a computerized database and analyzed using the SPSS package (SPSS 18.0 for Windows, SPSS, Chicago, IL, USA).
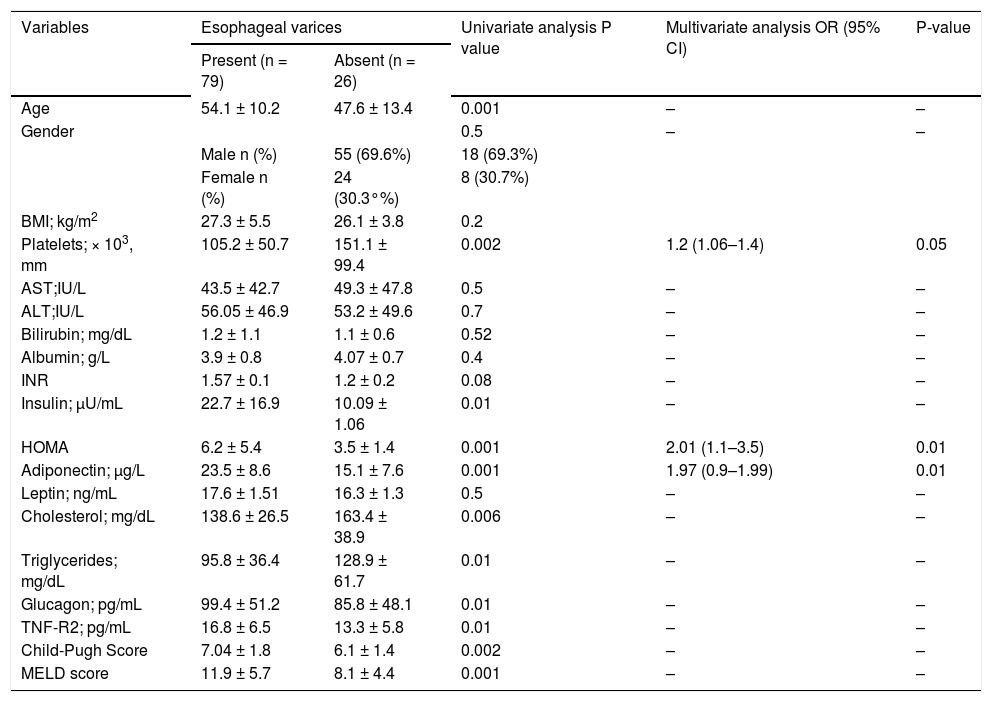
ResultsFactors associated with EVUnivariate and multivariate comparisons of variables between those with and those without EV are summarized in table 2. Older age, higher insulin levels, HOMA-IR score, TNF-R2, adiponectin, Child-Pugh classification and MELD score were all associated with the presence of EV, as were lower platelet counts, triglyceride and cholesterol concentrations. Variables independently linked to the presence of EV were (Table 2):
- •
High HOMA-IR [odds ratio (OR): 2.01, 95% confidence interval (95%CI): 1.1–3.5; P = 0.01].
- •
High adiponectin (OR: 1.97, 95% CI: 0.9–0.1.9; P = 0.01).
- •
Low platelet count (OR: 1.2, 95% CI: 1.06–1.4; P = 0.05).
Univariate and multivariate analysis of factors associated with presence of esophageal varices in 105 consecutive patients in the elimination cohort
| Variables | Esophageal varices | Univariate analysis P value | Multivariate analysis OR (95% CI) | P-value | |
|---|---|---|---|---|---|
| Present (n = 79) | Absent (n = 26) | ||||
| Age | 54.1 ± 10.2 | 47.6 ± 13.4 | 0.001 | – | – |
| Gender | 0.5 | – | – | ||
| Male n (%) | 55 (69.6%) | 18 (69.3%) | |||
| Female n (%) | 24 (30.3°%) | 8 (30.7%) | |||
| BMI; kg/m2 | 27.3 ± 5.5 | 26.1 ± 3.8 | 0.2 | ||
| Platelets; × 103, mm | 105.2 ± 50.7 | 151.1 ± 99.4 | 0.002 | 1.2 (1.06–1.4) | 0.05 |
| AST;IU/L | 43.5 ± 42.7 | 49.3 ± 47.8 | 0.5 | – | – |
| ALT;IU/L | 56.05 ± 46.9 | 53.2 ± 49.6 | 0.7 | – | – |
| Bilirubin; mg/dL | 1.2 ± 1.1 | 1.1 ± 0.6 | 0.52 | – | – |
| Albumin; g/L | 3.9 ± 0.8 | 4.07 ± 0.7 | 0.4 | – | – |
| INR | 1.57 ± 0.1 | 1.2 ± 0.2 | 0.08 | – | – |
| Insulin; μU/mL | 22.7 ± 16.9 | 10.09 ± 1.06 | 0.01 | – | – |
| HOMA | 6.2 ± 5.4 | 3.5 ± 1.4 | 0.001 | 2.01 (1.1–3.5) | 0.01 |
| Adiponectin; μg/L | 23.5 ± 8.6 | 15.1 ± 7.6 | 0.001 | 1.97 (0.9–1.99) | 0.01 |
| Leptin; ng/mL | 17.6 ± 1.51 | 16.3 ± 1.3 | 0.5 | – | – |
| Cholesterol; mg/dL | 138.6 ± 26.5 | 163.4 ± 38.9 | 0.006 | – | – |
| Triglycerides; mg/dL | 95.8 ± 36.4 | 128.9 ± 61.7 | 0.01 | – | – |
| Glucagon; pg/mL | 99.4 ± 51.2 | 85.8 ± 48.1 | 0.01 | – | – |
| TNF-R2; pg/mL | 16.8 ± 6.5 | 13.3 ± 5.8 | 0.01 | – | – |
| Child-Pugh Score | 7.04 ± 1.8 | 6.1 ± 1.4 | 0.002 | – | – |
| MELD score | 11.9 ± 5.7 | 8.1 ± 4.4 | 0.001 | – | – |
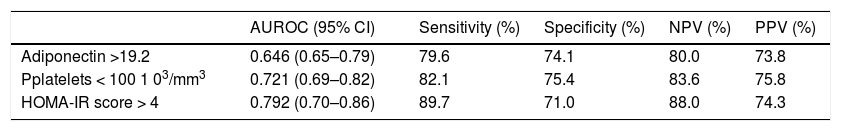
Multivariate analysis performed on the subset of patients with Child A cirrhosis again confirmed high HOMA-IR (OR: 1.4, 95% CI: 1.04–1.3; P = 0.007) and high adiponectin (OR: 1.1, 95%CI: 0.97–1.2; P = 0.03) as significant predictors of EV presence. ROC curve analysis identified:
- •
Adiponectin > 19.2 (AUC: 0.646, SE: 0.093, 95% CI: 0.65–0.79; sensitivity: 79.6%; specificity: 74.1%; PPV: 73.8%; NPV: 80.0%).
- •
Platelets < 100 103/mm3 (AUC: 0.721; SE: 0.007; 95%CI: 0.69–0.82; sensitivity: 82.1%; specificity: 75.4%; PPV: 75.8%; NPV: 83.6%).
- •
HOMA-IR score > 4 (AUC: 0.792; SE: 0.002; 95%CI: 0.70–0.86; sensitivity: 89.7%; specificity: 71.0%; PPV: 74.3%; NPV: 88.0%).
As the best cut-off points for predicting the presence of EV (Table 3).
Performance of variables in predicting the presence of esophageal varices.
| AUROC (95% CI) | Sensitivity (%) | Specificity (%) | NPV (%) | PPV (%) | |
|---|---|---|---|---|---|
| Adiponectin >19.2 | 0.646 (0.65–0.79) | 79.6 | 74.1 | 80.0 | 73.8 |
| Pplatelets < 100 1 03/mm3 | 0.721 (0.69–0.82) | 82.1 | 75.4 | 83.6 | 75.8 |
| HOMA-IR score > 4 | 0.792 (0.70–0.86) | 89.7 | 71.0 | 88.0 | 74.3 |
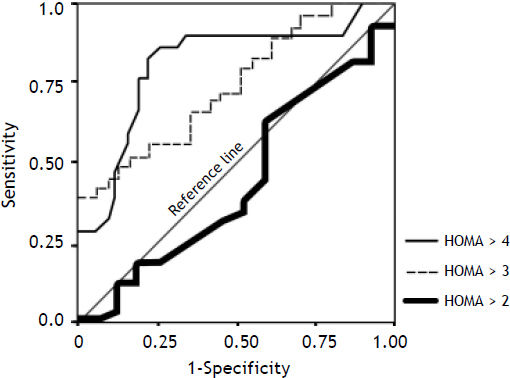
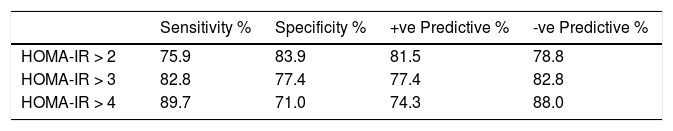
The ROC curve values for HOMA-IR > 2, 3, 4 as well as the sensitivity, specificity, and misclassification rates for different HOMA-IR cutoff values are summarized in (Figure 2 and table 4).
 curve for HOMA score at different cut-offs of HOMA > 2 (AUC: 0.444; SE: 0.517; 95%CI: 0.35–0.48), HOMA > 3 (AUC: 0.737; SE: 0.002; 95%CI: 0.69–0.82) and for HOMA > 4 (AUC: 0.792; SE: 0.002; 95%CI: 0.70–0.86) segregated with respect to esophageal varices.")
Receiver operating characteristic (ROC) curve for HOMA score at different cut-offs of HOMA > 2 (AUC: 0.444; SE: 0.517; 95%CI: 0.35–0.48), HOMA > 3 (AUC: 0.737; SE: 0.002; 95%CI: 0.69–0.82) and for HOMA > 4 (AUC: 0.792; SE: 0.002; 95%CI: 0.70–0.86) segregated with respect to esophageal varices.
Performance of homeostasis model for the assessment of IR (HOMA-IR) markers for prediction of the presence of EV for the estimation cohort at various cut-off points.
| Sensitivity % | Specificity % | +ve Predictive % | -ve Predictive % | |
|---|---|---|---|---|
| HOMA-IR > 2 | 75.9 | 83.9 | 81.5 | 78.8 |
| HOMA-IR > 3 | 82.8 | 77.4 | 77.4 | 82.8 |
| HOMA-IR > 4 | 89.7 | 71.0 | 74.3 | 88.0 |
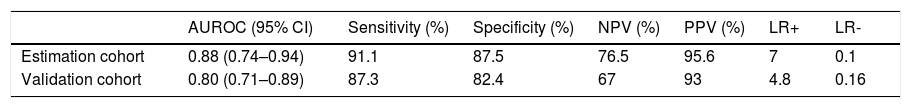
Based on the 105 patients in the estimation cohort, the discriminating ability of the rule generated by the model was high (AUC: 0.88 ± 0.03; SE: 0.042; 95%CI: 0.74–0.94; sensitivity: 91.1%; specificity: 87.5%; PPV: 95.6%; NPV: 76.5%, LR+ 7, LR-0.1) (Table 5).
Performance of the developed predictive index for the presence of esophageal varices in the initial and validation cohort.
| AUROC (95% CI) | Sensitivity (%) | Specificity (%) | NPV (%) | PPV (%) | LR+ | LR- | |
|---|---|---|---|---|---|---|---|
| Estimation cohort | 0.88 (0.74–0.94) | 91.1 | 87.5 | 76.5 | 95.6 | 7 | 0.1 |
| Validation cohort | 0.80 (0.71–0.89) | 87.3 | 82.4 | 67 | 93 | 4.8 | 0.16 |
The model for the prediction of EV was evaluated prospectively in a separate cohort of 175 patients (76% had EV). The ROC curve index in the validation cohort had AUC: 0.80 ± 0.06; SE: 0.034; 95%CI: 0.71–0.89; sensitivity: 87.3%; specificity: 82.4%; PPV: 93%; NPV: 67%, LR+ 4.8, LR- 0.16 (Table 5).
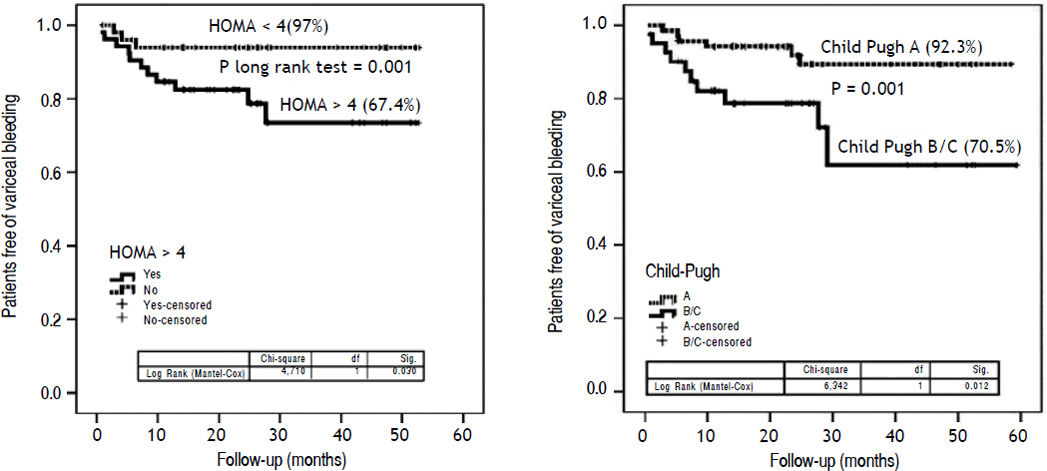
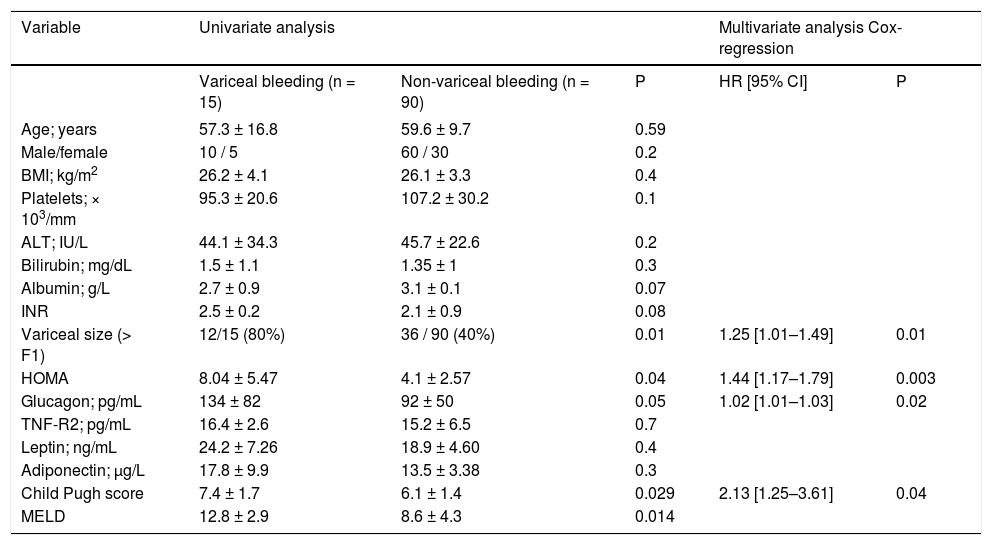
Metabolic markers: relationships with clinical outcomesDuring follow-up, 55 patients died, had liver transplantation or had a PHT -related event. The remaining 60 patients did not develop any adverse clinical event. Univariate analysis showed HOMA index, EV size, Child-Pugh class, glucagonemia and MELD scores as variables associated with the risk of VB. The Cox model analysis identified an independent association of HOMA (OR: 1.44, 95% CI: 1.17–1.79; P = 0.01), Child -Pugh class (OR: 2.13, 95%CI: 1.25 - 3.61; P = 0.04), variceal size (OR: 1.25, 95%CI: 1.01–1.49; P = 0.01) and glucagonemia (OR: 1.02, 95%CI: 1.01–1.03; P = 0.02) with risk of VB (Table 6). To explore further the existence of a potential cut-off of HOMA useful in discriminating patients with the risk of developing this combined endpoint, the cohort scores were dichotomized at a cut-off value of 4; identified as the Youden index value of HOMA that maximized the sum of sensitivity (84%) and specificity (61%). Patients with HOMA < 4 had a significantly higher probability of having free survival of risk of VB than patients with HOMA > 4 (97 vs. 67.4%; P = 0.001) (Kaplan-Meier: logrank: 3.7; P < 0.05) (Figure 3A). Patients with Child-Pugh class B and C had a significantly lower probability of having free survival of risk of VB than patients with Child-Pugh A (70.5% vs. 92.3%.; P = 0.001) (Figure 3B).
Univariate and multivariable analysis of factors related to survival free of variceal bleeding.
| Variable | Univariate analysis | Multivariate analysis Cox-regression | |||
|---|---|---|---|---|---|
| Variceal bleeding (n = 15) | Non-variceal bleeding (n = 90) | P | HR [95% CI] | P | |
| Age; years | 57.3 ± 16.8 | 59.6 ± 9.7 | 0.59 | ||
| Male/female | 10 / 5 | 60 / 30 | 0.2 | ||
| BMI; kg/m2 | 26.2 ± 4.1 | 26.1 ± 3.3 | 0.4 | ||
| Platelets; × 103/mm | 95.3 ± 20.6 | 107.2 ± 30.2 | 0.1 | ||
| ALT; IU/L | 44.1 ± 34.3 | 45.7 ± 22.6 | 0.2 | ||
| Bilirubin; mg/dL | 1.5 ± 1.1 | 1.35 ± 1 | 0.3 | ||
| Albumin; g/L | 2.7 ± 0.9 | 3.1 ± 0.1 | 0.07 | ||
| INR | 2.5 ± 0.2 | 2.1 ± 0.9 | 0.08 | ||
| Variceal size (> F1) | 12/15 (80%) | 36 / 90 (40%) | 0.01 | 1.25 [1.01–1.49] | 0.01 |
| HOMA | 8.04 ± 5.47 | 4.1 ± 2.57 | 0.04 | 1.44 [1.17–1.79] | 0.003 |
| Glucagon; pg/mL | 134 ± 82 | 92 ± 50 | 0.05 | 1.02 [1.01–1.03] | 0.02 |
| TNF-R2; pg/mL | 16.4 ± 2.6 | 15.2 ± 6.5 | 0.7 | ||
| Leptin; ng/mL | 24.2 ± 7.26 | 18.9 ± 4.60 | 0.4 | ||
| Adiponectin; μg/L | 17.8 ± 9.9 | 13.5 ± 3.38 | 0.3 | ||
| Child Pugh score | 7.4 ± 1.7 | 6.1 ± 1.4 | 0.029 | 2.13 [1.25–3.61] | 0.04 |
| MELD | 12.8 ± 2.9 | 8.6 ± 4.3 | 0.014 | ||

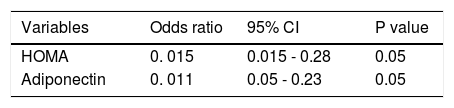
In the second retrospective group of the 48 patients with HVPG measurements, a positive correlation was found between HOMA-IR and HPVG (r = 0.30; P = 0.01). Similar results were observed for adiponectin (r = 0.68, P = 0.0001).
Independent factors associated with HVPG were: HOMA index (OR: 0.15, 95%CI: 0.015–0.28; P < 0.05), and adiponectin (OR: 0.11, 95%CI: 0.05–0.23; P < 0.05) (Table 7). The best-fitting multiple logistic regression model for the prediction of HPVG was: 11.5 + (0.11*adiponectin) + (0.146*HOMA). Notably, adiponectin levels were significantly increased Child-Pugh class. Adiponectin was 4.9 ± 5.7, 18.7 ± 16.4, 29.3 ± 20.1 in Child-Pugh class A, B and C, respectively (P = 0.001).
DiscussionTo the best of our knowledge, this is the first study exploring the association between changes in IR/ adipocytokines and systemic and hepatic haemody-namic disturbances, as well as their possible value in predicting the presence of EV. The results of this large-scale, multi-centered study identified platelet count, HOMA index and adiponectin levels as factors that independently predicted the presence of EV. This relationship extended to subset analysis in patients with Child-Pugh A. Secondly, we observed that, apart from Child-Pugh class, variceal size and glucagonemia, HOMA index were associated independently with higher risk of VB.
That IR is emerging as a risk factor for EV is consistent with data in a recent article by Camma, et al.10 reporting the potential usefulness of IR in predicting EV in patients with Child-Pugh A HCV -cirrhosis. However, the Camma, et al. study is limited by small sample size and lacked data on direct measurement of PHT by HVPG. Also, since 26% of the patients had DM at baseline, the measures of insulin sensitivity could easily have been affected by medications that are frequently prescribed in DM.11 Further, the study was cross-sectional (not a longitudinal follow-up study) and this limited its usefulness in dissecting the temporal relationship between IR and EV.
In recent years, some trials have tried to understand better the factors involved in the detrimental influence of obesity and metabolic syndrome on the clinical evolution of cirrhotic patients. Nkontchou, et al. showed that in patients with HCV-compensated cirrhosis, IR predicted the occurrence of HCC and liver-related death or transplantation.12 Similar findings were reported in patients with HBV carriers.13 Although these investigations provide important information, none of them report data on the related complication of PHT.
In the current study we report that IR (assessed with HOMA index) was associated with higher risk of VB. It is well established that the onset of EV marks a crucial turning-point in the clinical evolution of the liver disease.14 Hence, the recent guidelines recommendations2,15 indicated that all patients should undergo endoscopic screening for varices when cirrhosis was diagnosed with regular periodic evaluation.2 However, the endoscopic follow-up strategy recommended is invasive and expensive. Also, compliance may be limited since it requires patients who are asymptomatic to undergo repeatedly unpleasant procedure. Indeed, a low adherence to these guidelines by practicing gastroenterologists has been reported.16 Predicting the presence of EV by non-invasive means would provide a tool for selecting patients who would benefit from endoscopy and would reduce unnecessary endoscopy. This would improve the cost-effectiveness of patient management, especially in countries where endoscopy is not widely available but where liver cirrhosis is prevalent. Selective screening endoscopy would be more cost-effective compared to universal screening endoscopy if non-invasive tests used for first-line se- lection are sufficiently reliable to discriminate endoscopy requirement.
In this study, a probability model to non-invasively identify EV was constructed using three routinely assessed parameters in cirrhotic patients. The markers selected by multivariate regression were HOMA-IR, adiponectin and platelet count. This EV probability model was shown to have sufficiently sensitivity and specificity to aid clinical decision-making regarding the need for, and the timing of endoscopy. Of note was that there were no significant differences observed in the AUC-ROC curve values in our estimation cohort versus the validation cohorts.
Although the mechanisms underlying IR involvement in PHT complications are beyond the scope of this work, several hypotheses can considered. IR is closely associated with progression of hepatic fibrosis.17 Insulin can induce endothelial dysfunction which is an early key event in vascular disorders. Insulin is able to:
- •
Modulate the endothelial synthesis of nitric oxide and endothelin.18
- •
Induce the production of tumor necrosis factor alpha and connective growth factor; stimulate hepatic stellate cells (HSC)19 which are effectors in the pathogenesis of liver fibrosis and PHT.20
As such, insulin would contribute to the pathogenesis of PHT by disrupting mechanical as well as dynamic mechanisms leading to collagen deposition, vasoconstriction, and regulation of sinusoidal structure.
Another novel finding of our work, and which had not been specifically evaluated in other studies, is that adiponectin had a significant direct correlation with HVPG and independently correlated with presence of EV, but not with risk of VB. This appears to be not completely explainable and in contrast to its putative protective role and probably reflects the complex nature of negative metabolic derangements, and that endothelial dysfunction is not the only determinant of PHT. Adiponectin increased progressively and significantly with Child-Pugh classification, this in consistent with data from various liver diseases including acute hepatitis, chronic hepatitis, liver cirrhosis, HCC, and primary biliary cirrhosis.21,22 Adiponectin levels increase along with the severity of disease, and parallel to portal pressure.23 The observed hyperadiponectinemia could reflect an imbalance between its production by adipocytes and catabolism in the liver.24 Kaser, et al.25 suggested that hyperadiponectinemia in chronic liver disease might reflect one of the body’s anti-inflammatory mechanisms. Ding, et al.26 reported that quiescent HSC synthesize adiponectin which, in turn, can induce activated HSC apoptosis and inhibit their proliferation, and which can lead to increase in PHT. In subset analysis in our patients with Child-Pugh A cirrhosis; we confirmed that the independent association of hyperadiponectinemia with the presence of EV had remained significant. Thus, an adiponectin-resistant state could not be excluded. Further studies are required to clarify the role of adiponectin in the pathogenesis of PHT.
This study has some limitations. Principally, it was conducted in daily clinical practice. However, this large-scale study including homogeneous populations, and assessed by single operator in each center adhering to established criteria for the diagnosis and classification of EV in every center, allowed us to assess inter-center variability in the accuracy of the non-invasive markers and consistency. No statistically significant center-associated differences were found (data not shown). Also, blind evaluation of pertinent videos revealed interobserver agreement between the three endoscopists.
Furthermore, criteria for making endoscopy could be different of criteria for HVPG measurement, so a bias selection could not be definitely excluded.
In conclusion, we describe a predictive model for assessing the probability of the presence of EV which can be used as an initial screening tool for cirrhosis. Available data do not allow for the complete replacement of endoscopy in EV screening, but may help in reducing the number of endoscopic studies needed by excluding those who are at very low risk of having EV. Our findings indicate that IR, as measured by the HOMA index, independently predicts risk of VB. HOMA index should be taken into account in prognostic models in patients with cirrhosis and PHT. The characterization of the mechanisms related to the interaction between insulin signaling/ adipocytokine changes and systemic and hepatic hemodynamic disturbances and the clinical evolution of patients with compensated cirrhosis need to be studied further. Finally, the impact of insulin-sensitizing agents, in addition to weight reduction, should be tested in relation to adipocytokine metabolism.
Authors’ Contributions- •
Mohammed Eslam: acquisition of data, drafting of the manuscript, statistical analysis.
- •
Javier Ampuero: acqusition of data, discussion of drafts.
- •
Maria Jover: acquisition of data.
- •
Hesham Abd-Elhalim: administrative, technical and material support.
- •
Diego Rincon: acquisition of data.
- •
Mohammed Shatat. Endoscopic evaluation.
- •
Ines Camacho: Laboratory measurements.
- •
Amal Kamal: acquisition of data.
- •
Oreste Lo Iacono: acquisition of data, administrative, technical or material support.
- •
Zainb Nasr: acquisition of data, administrative, technical or material support.
- •
Lourdes Grande: administrative, technical or material support.
- •
Rafael Banares: acquisition of data, HPVG assessment, endoscopic evaluation.
- •
Mahmoud A. Khattab: study design, patient recruitment and management.
- •
Manuel Romero-Gomez: had full access to all of the data in the study and reviewed the accuracy of the data analysis, study concept and design and guarantor of the data.
None.
Potential Competing InterestsNone.


