


Background and rationale for the study. Ultrasound assessment of the severity of non-alcoholic fatty liver disease (NAFLD) shows substantial observer variability. The purpose of this retrospective study is to develop a more objective, quantitative, and applicable assessment method for all physicians. Main Results. Male gender, and increases in age, body mass index, alanine aminotransferase (ALT), triglycerides (TG), and total cholesterol (TC) were found to be significantly correlated to higher scores. The following algorithm, derived from a 3,275 member training group, for predicting the extent of fatty liver infiltration was then constructed using these parameters.
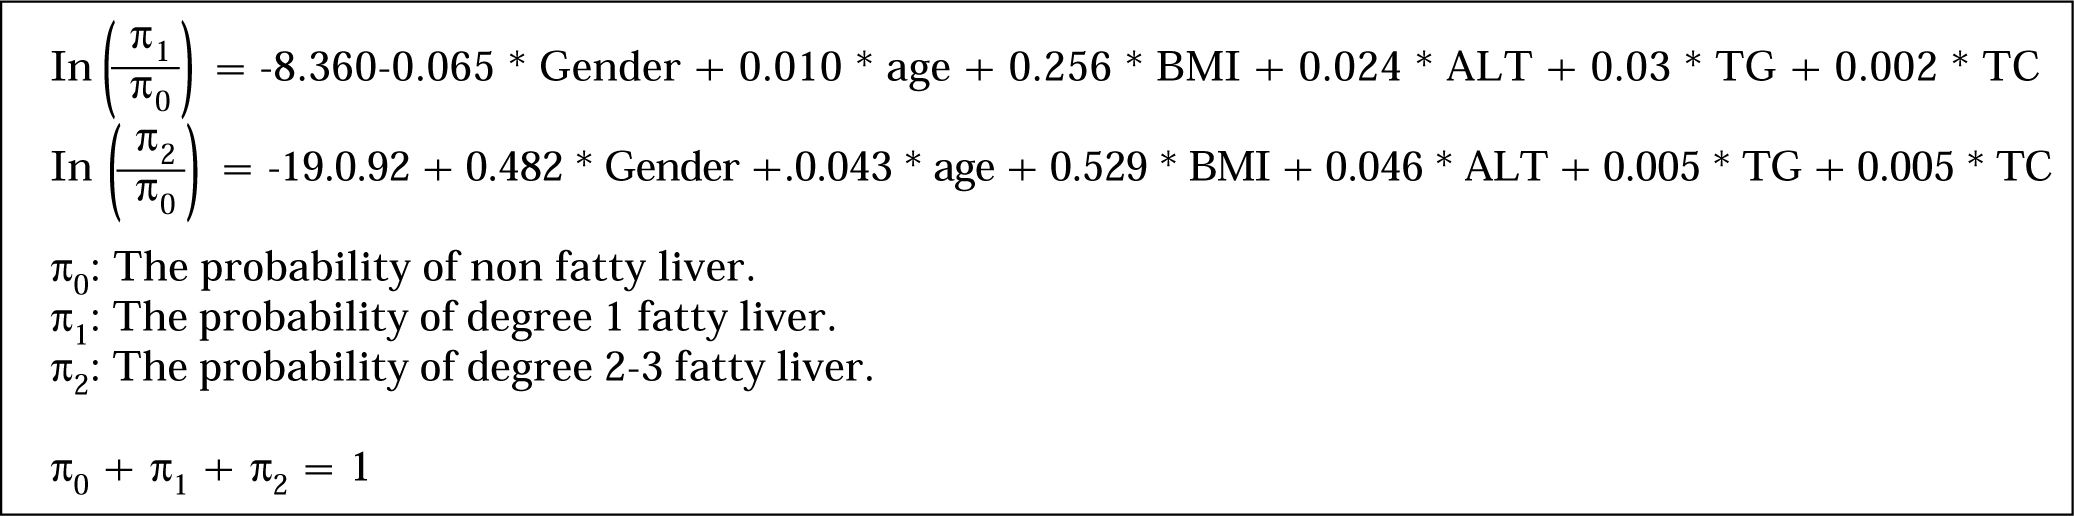
In (Π1/Π0) = -8.360-0.065*Gender+0.010*age+0.256*BMI+0.024*ALT+0.03*TG+0.002*TC
In (Π2/Π0)= -19.0.92+0.482*Gender+0.043*age+0.529*BMI+0.046*ALT+0.005*TG+0.005*TC
Π0: the probability of non fatty liver.
Π1: the probability of degree 1 fatty liver.
Π2: the probability of degree 2-3 fatty liver.
Π0 + Π1 + Π2 = 1
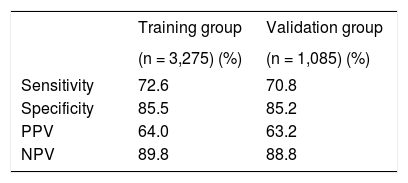
The resulting algorithm was tested for its predictive power a 1,065 member validation group. The algorithm predicted the actual ultrasound fatty liver score in the validation group with 87.9, 14.2, and 72.6% accuracy for those with no, grade 1, and grade 2-3 fatty liver, respectively. For prediction of grade 2-3 fatty liver, its sensitivity was 70.8%, its specificity 85.2%, its positive predictive power 63.2% and its negative predictive power 88.8%. Conclusions. The algorithm developed here is fast and has substantial predictive power for grade 2-3 fatty liver. No specialized equipment or expertise is needed, and it can be easily used by the general practitioner to predict the extent of fatty infiltration in cases of NAFLD.
Nonalcoholic fatty liver disease (NAFLD) is a global public health issue, and is the most common liver disease in the United States and worldwide. This disease syndrome encompasses a spectrum of liver pathology, including steatosis, steatohepatitis, fibrosis and cirrhosis, and its incidence is increasing as the numbers of overweight and obese individuals in many countries increase.1,2
The prevalence of NAFLD in the U.S. is estimated to be approximately 75-92% in the morbidly obese population, 20% in the general population, and approximately 13-14% in the pediatric population.3 The prevalence of the progressive form, nonalcoholic steatohepatitis, is estimated to be 3-5%, with 3-5% of those with the progressive form having advanced to cirrhosis.3
NAFLD is often first discovered when a patient has been brought to the hospital for another illness. In one study, when such hospitalized patients were evaluated using ultrasound, the prevalence of NA-FLD was found to be 20%. Patients with NAFLD were found to have higher body mass index (BMI) values and waist circumferences than those without this syndrome, and metabolic syndrome was present in 61%.4
The detailed underlying mechanism and pathogenesis of NAFLD remain elusive, although the general overview is that two “hits” to the liver need to occur for this condition to progress to steatohepatitis: first, an accumulation of fat associated with insulin resistance, and second, activation of proin-flammatory cytokines and stellate cells.5 Weight loss and increased exercise have been consistently associated with improvement in liver histology. Additional treatment is centered on attempts to manage the underlying metabolic risk factors.6
The health burden of NAFLD is expected to increase in future years due to an aging population and to improved control of other major causes of chronic liver disease, such as hepatitis B and C, and alcoholic cirrhosis.7 Thus, the number of individuals at risk for end-stage liver disease and development of primary liver cancer is large. And NAFLD itself is an independent risk factor for cardiovascular disease, leads to increased all-cause mortality, and also to increased liver-related mortality.3
A person is usually diagnosed with NAFLD after abnormal liver function tests prompt the use of either ultrasound or computed tomography to scan the liver for indications of fat infiltration.3 But while ultrasound is commonly used to detect NAFLD, even if a clinic has access to ultrasound for liver imaging, there is variability in the interpretation of those images. In one study, when experienced radiologists graded static abdominal images of steatosis and then assessed the same images one month later after being blinded to the initial reading, there was substantial observer variability in the assessment of mild steatosis, moderate steatosis and severe steatosis. This study makes it clear that there is a need for a more objective, quantitative method than sonography for grading fatty liver severity that would be easily available and applicable for use in routine practice.8
Using ultrasonography to diagnose NAFLD requires expertise and specific instrumentation that is generally not available to the general clinic. The aim of this study is develop an algorithm that will enable the general practitioner to gauge the degree of fat infiltration into the liver by calculating a “fatty liver score” using information obtained from a routine physical and biochemical examination. If the risk factors for and their correlation to non-alcoholic fatty liver disease can be correctly identified, they can be used in a noninvasive prognostic model to estimate the degree of fat accumulation in NAFLD.
Materials and MethodsStudy populationThe study population was a total of 4,360 subjects (comprised of employees from four independent companies who completed the health checkup service at Wan Fang Hospital). There were 2,852 men (65.4%) and 1,508 women (34.9%), ranging in age from 17 to 65 years, included in the study. All patients underwent a complete clinical and anthropo-metric evaluation, and an ultrasound scan of the liver. Four family medicine and experienced physicians performed the abdominal ultrasonography (there was consistency among the doctors participating in this study by thorough training and extensive practice). To minimize variation in interpretation of the scans, all scans were graded by the same expert gastroenterologist. The presence of fatty liver was defined as increased echogenicity of the hepatic parenchyma and posterior attenuation. The diagnosis of NAFLD was established by ultrasonography followed by the exclusion of other causes of hepatic steatosis:
- 1.
Alcohol intake of 30 g/day or more for males and 20 g/day or more for females.
- 2.
Wilson’s disease, intestinal bypass surgery, or gluten enteropathy.
- 3.
Ingestion of drugs known to produce hepatic steatosis, including methotrexate, tamoxifen, amiodarone, and nucleoside analogues.
- 4.
Positive serology for hepatitis B or C virus.
- 5.
A history of another known liver disease. Each patient was submitted to an abdominal ultrasound examination with an ALOKA SSD-900 device, using a 3.5 MHz convex probe.
Fatty liver was classified using ultrasound into mild, moderate and severe forms. The ultrasound, performed by an expert gastroenterologist, was graded on a scale of 0 to 3 (0 = none, 1 = mild, 2 = moderate, 3 = severe) at baseline and also at the study end. Mild was defined as a slight increase in liver echogenicity and the relative preservation of echoes from the walls of the portal vein. Moderate was defined as moderate loss of echoes from the walls of the portal vein, particularly from the peripheral branches, and moderate diffuse abnormally bright echoes. Severe was defined as a greater reduction in beam penetration, loss of echoes from most of the portal vein wall, and extensive, abnormally bright, echoes.
Statistical analysisTo establish a predictive algorithm for steatosis, subjects from the 4,360 member study population were randomly assigned to either a training or a validation group (3:1 ratio). The data in training group was used for construct a multivariate model for the prediction of fatty liver, and the data in validation group was used to validate the model constructed from the training group data. Using a training group and validation group from the same population avoids the statistical problem of “overfitting” which occurs when the entire study group is used to obtain the predictive model, and the resulting model, although it fits the study group well, is found not to be a good predictor for similar patients from the general population.
Using training group data, multinomial logistic regression for univariate analysis was performed to determine factors correlating with the extent of steatosis in the liver, and multiple stepwise multinomial logistic regression analysis was then undertaken on the basis of the univariate analysis results. An algorithm for predicting the score for steatosis severity was constructed, using findings from training group data. The accuracy of the algorithm was then tested using the data from the validation group. The results for univariate and multivariate multinomial logistic regression models were summarized by odds ratio (OR) and the corresponding 95% confidence interval (CI). Continuous variables are presented as mean ± standard deviation (SD), while categorical variables are expressed as number (percentage). The comparisons between training and testing groups were performed by independent two sample t-test for continuous variables and by Chi-square test for categorical variables. A P value less than 0.05 was considered to be statistically significant. All assessments were two-sided and performed using SPSS version 15.0 software (Statistical Package for the Social Sciences Inc., Chicago, IL).
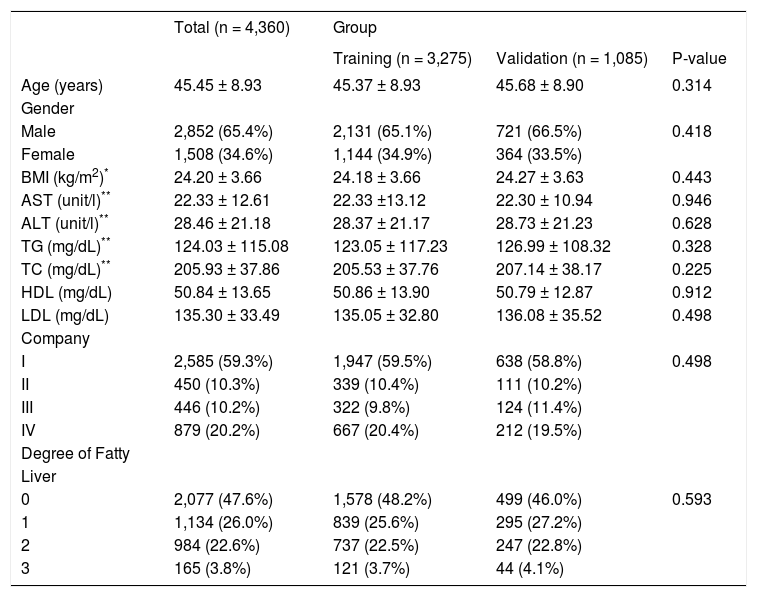
ResultsThe demographic and laboratory characteristics of the 4,360 study subjects are summarized in Table 1. Their average age was 45.5±8.9 years (range 17 to 65); and their average BMI was 24.2 kg/m2 ± 3.7 kg/m2. Forty-eight % (2,077) subjects had no ultrasound evidence of steatosis, and 26% (1,134) had mild, 22.6% (984) moderate, and 3.8% (165) severe steatosis. No significant difference in demographic and laboratory characteristics was found between training and validation groups (all P > 0.05).
Characteristics of 4,360 subjects who underwent the physical examination.
| Total (n = 4,360) | Group | |||
|---|---|---|---|---|
| Training (n = 3,275) | Validation (n = 1,085) | P-value | ||
| Age (years) | 45.45 ± 8.93 | 45.37 ± 8.93 | 45.68 ± 8.90 | 0.314 |
| Gender | ||||
| Male | 2,852 (65.4%) | 2,131 (65.1%) | 721 (66.5%) | 0.418 |
| Female | 1,508 (34.6%) | 1,144 (34.9%) | 364 (33.5%) | |
| BMI (kg/m2)* | 24.20 ± 3.66 | 24.18 ± 3.66 | 24.27 ± 3.63 | 0.443 |
| AST (unit/l)** | 22.33 ± 12.61 | 22.33 ±13.12 | 22.30 ± 10.94 | 0.946 |
| ALT (unit/l)** | 28.46 ± 21.18 | 28.37 ± 21.17 | 28.73 ± 21.23 | 0.628 |
| TG (mg/dL)** | 124.03 ± 115.08 | 123.05 ± 117.23 | 126.99 ± 108.32 | 0.328 |
| TC (mg/dL)** | 205.93 ± 37.86 | 205.53 ± 37.76 | 207.14 ± 38.17 | 0.225 |
| HDL (mg/dL) | 50.84 ± 13.65 | 50.86 ± 13.90 | 50.79 ± 12.87 | 0.912 |
| LDL (mg/dL) | 135.30 ± 33.49 | 135.05 ± 32.80 | 136.08 ± 35.52 | 0.498 |
| Company | ||||
| I | 2,585 (59.3%) | 1,947 (59.5%) | 638 (58.8%) | 0.498 |
| II | 450 (10.3%) | 339 (10.4%) | 111 (10.2%) | |
| III | 446 (10.2%) | 322 (9.8%) | 124 (11.4%) | |
| IV | 879 (20.2%) | 667 (20.4%) | 212 (19.5%) | |
| Degree of Fatty | ||||
| Liver | ||||
| 0 | 2,077 (47.6%) | 1,578 (48.2%) | 499 (46.0%) | 0.593 |
| 1 | 1,134 (26.0%) | 839 (25.6%) | 295 (27.2%) | |
| 2 | 984 (22.6%) | 737 (22.5%) | 247 (22.8%) | |
| 3 | 165 (3.8%) | 121 (3.7%) | 44 (4.1%) | |
BMI: Body mass index. AST: Aspartate aminotransferase. ALT: Alanine aminotransferase. TG: Triglycerides. TC: Total cholesterol. HDL: High density lipoprotein. LDL: Low density lipoprotein. Company: I Post office; II Taxi driver; III Environmental Protection Bureau; IV a private company. Continuous variables are presented as the mean ± standard deviation, and categorical variables are presented as numbers (percentage). * Four missing values in training group. ** Six missing values in training group.
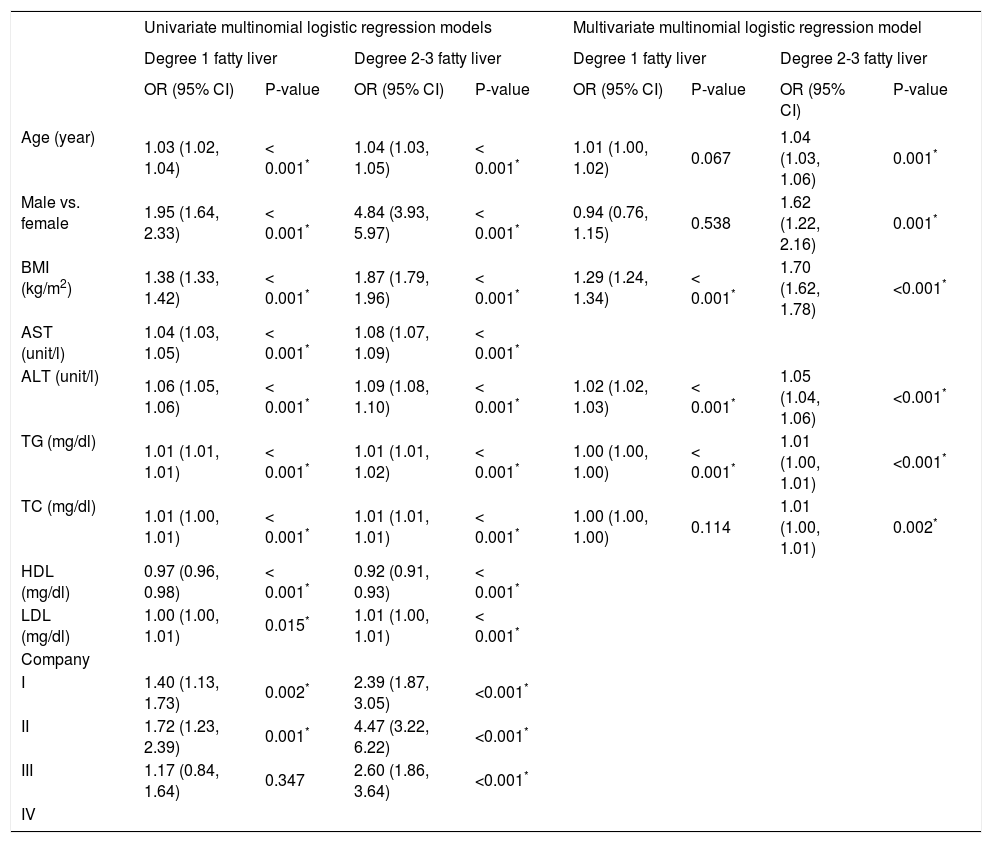
Table 2 summarizes the results of the univariate and multivariate analyses of multinomial logistic regression models in the training group. In the univariate analysis, all variables obtained statistical significance, due to the large sample size. In the stepwise multivariate analysis, age, gender, body mass index (BMI), alanine aminotransferase (ALT), triglyceride (TG), and total cholesterol (TC) had significant impacts on the risk of fatty liver (all P < 0.05). The effect of age and male gender was only found in degree 2-3 fatty liver, and the effects of BMI and ALT were found in both degree 1 and degree 2-3 fatty liver. In addition, TG and TC had minor effects on the risks of degree 1 and degree 2-3 fatty liver. The algorithm developed using training group data is shown in figure 1.
Summary of the univariate and multivariate multinomial logistic regression analysis findings regarding fatty liver level for the training group of subjects (n = 3,275) who underwent the physical examination.1
| Univariate multinomial logistic regression models | Multivariate multinomial logistic regression model | |||||||
|---|---|---|---|---|---|---|---|---|
| Degree 1 fatty liver | Degree 2-3 fatty liver | Degree 1 fatty liver | Degree 2-3 fatty liver | |||||
| OR (95% CI) | P-value | OR (95% CI) | P-value | OR (95% CI) | P-value | OR (95% CI) | P-value | |
| Age (year) | 1.03 (1.02, 1.04) | < 0.001* | 1.04 (1.03, 1.05) | < 0.001* | 1.01 (1.00, 1.02) | 0.067 | 1.04 (1.03, 1.06) | 0.001* |
| Male vs. female | 1.95 (1.64, 2.33) | < 0.001* | 4.84 (3.93, 5.97) | < 0.001* | 0.94 (0.76, 1.15) | 0.538 | 1.62 (1.22, 2.16) | 0.001* |
| BMI (kg/m2) | 1.38 (1.33, 1.42) | < 0.001* | 1.87 (1.79, 1.96) | < 0.001* | 1.29 (1.24, 1.34) | < 0.001* | 1.70 (1.62, 1.78) | <0.001* |
| AST (unit/l) | 1.04 (1.03, 1.05) | < 0.001* | 1.08 (1.07, 1.09) | < 0.001* | ||||
| ALT (unit/l) | 1.06 (1.05, 1.06) | < 0.001* | 1.09 (1.08, 1.10) | < 0.001* | 1.02 (1.02, 1.03) | < 0.001* | 1.05 (1.04, 1.06) | <0.001* |
| TG (mg/dl) | 1.01 (1.01, 1.01) | < 0.001* | 1.01 (1.01, 1.02) | < 0.001* | 1.00 (1.00, 1.00) | < 0.001* | 1.01 (1.00, 1.01) | <0.001* |
| TC (mg/dl) | 1.01 (1.00, 1.01) | < 0.001* | 1.01 (1.01, 1.01) | < 0.001* | 1.00 (1.00, 1.00) | 0.114 | 1.01 (1.00, 1.01) | 0.002* |
| HDL (mg/dl) | 0.97 (0.96, 0.98) | < 0.001* | 0.92 (0.91, 0.93) | < 0.001* | ||||
| LDL (mg/dl) | 1.00 (1.00, 1.01) | 0.015* | 1.01 (1.00, 1.01) | < 0.001* | ||||
| Company | ||||||||
| I | 1.40 (1.13, 1.73) | 0.002* | 2.39 (1.87, 3.05) | <0.001* | ||||
| II | 1.72 (1.23, 2.39) | 0.001* | 4.47 (3.22, 6.22) | <0.001* | ||||
| III | 1.17 (0.84, 1.64) | 0.347 | 2.60 (1.86, 3.64) | <0.001* | ||||
| IV | ||||||||
BMI: Body mass index. AST: Aspartate aminotransferase. ALT: Alanine aminotransferase. TG: Triglycerides. TC: Total cholesterol. HDL: High density lipoprotein. LDL: Low density lipoprotein. Company: I. Post office. II. Taxi driver. III. Environmental Protection Bureau. IV. A private company. * P< 0.05 indicated that the corresponding variable had significant impact on the risk of fatty liver

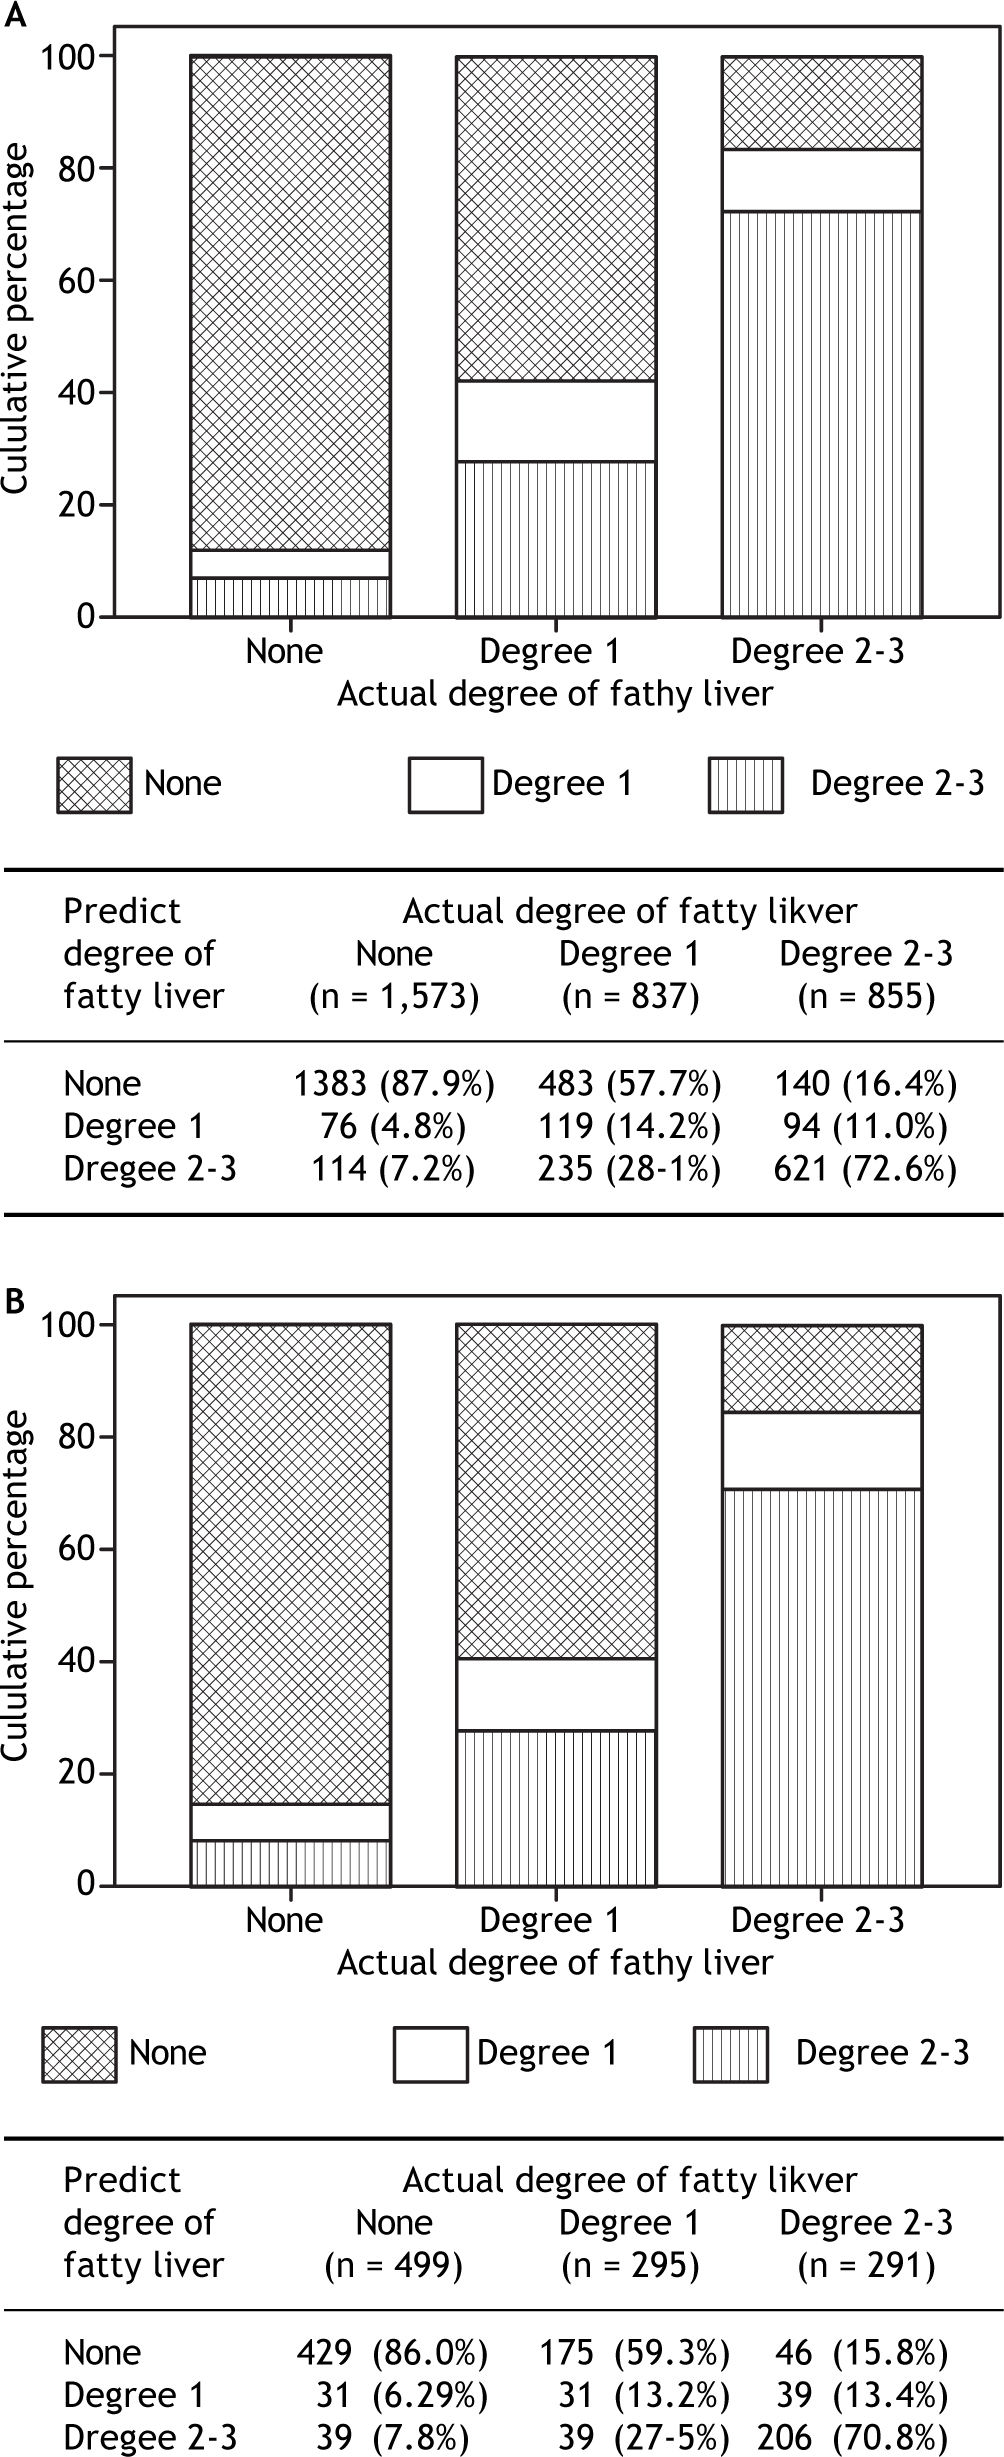
The algorithms are different for the prediction of degree 1 and degree 2-3 fatty liver because the impact of individual risk factors on these two conditions differs. For example, as mentioned above, age and gender have an impact on degree 2-3, but not degree 1, fatty liver. The comparisons of predicted and actual ultrasound scores for training and validation groups are shown in Figure 2 and Table 3. In the training dataset, the accuracy obtained was 87.9% in patients without fatty liver, only 14.2% in those with degree 1 fatty liver, and 72.6% for those with degree 2-3 fatty liver. Similar results are found in the validation dataset. Accuracy in this dataset was 86.0% in patients without fatty liver, only 13.2% in those with degree 1 fatty liver, and 70.8% for those with degree 2-3 fatty liver. For predicting degree 2-3 fatty liver, the algorithm had a sensitivity of 70.8%, a specificity of 85.2%, a positive predictive power of 63.2%, and a negative predictive power of 88.8%.
 and validation group (B).")
In this study, we have developed an algorithm to assess fatty liver severity, from anthropometric, biochemical, and ultrasound data from 3,275 Taiwanese health checkup subjects that, in our validation group, had a sensitivity of 70.8% and a specificity of 85.2% for identifying grade 2/3 fatty liver as assessed by ultrasound. Liver biopsy, the ultimate standard for detection of fatty liver disease is, of course, not possible in a large cohort of healthy subjects. Ultrasound is a widely used clinical method for assessing fatty liver but is operator-dependent; therefore, by using a large study sample and a single expert gastroenterologist to evaluate the liver scans, we strove to minimize the effect of inter- and intraobserver variability on the results. Although we developed our algorithm using this surrogate marker for steatosis, a recent direct comparison of ultrasound and biopsy data reported that ultrasound had a sensitivity of 100% and a specificity of 90% in identifying biopsy samples with ≥ 20% fat and a considerably lower sensitivity (43%) and specificity (70%) in identifying specimens with < 20% fat.9
Two other algorithms using biochemical and demographic parameters to assess liver steatosis are the SteatoTest and the Fatty Liver Index.10,11 The SteatoTest uses age, sex, BMI and 10 blood components to calculate a numerical value to use to predict steatosis in chronic liver disease. It was developed on patients with biopsy-proven liver disease, and was designed to be used to predict steatosis in alcohol and virus-caused liver disease as well as NAFLD. In addition to the parameters used in our algorithm, it includes concentrations of glucose and four plasma proteins (α-2 macroglobulin, apolipoprotein A-1, haptoglobin, and bilirubin).10,12 The Fatty Liver Index was developed using 13 variables from data from the general population, and was intended as a predictor of the presence of steatosis in this population.11 In contrast to the SteatoTest and Fatty Liver Index, our algorithm was developed with data from NAFLD subjects and was intended, instead of predicting the presence of steatosis, to provide an estimate of the severity of the steatosis. Although poor at predicting mild steatosis, it had reasonable predictive power for the presence of moderate/severe steatosis.
The prevalence of NAFLD in the Eastern population is only 10%, as compared to 20-30% for the Western population. However, it is increasing in Japan, China and Korea because of the westernization of dietary habits, decreased physical activity and increasing obesity.5,13
NAFLD is called a hepatic manifestation of metabolic syndrome, but it also occurs in the absence of this syndrome. Recent studies indicate that non-whites comprise the majority of individuals receiving a new diagnosis of NAFLD.1 In a previous study that examined the prevalence of nonalcoholic fatty liver disease in Taiwan, 11.5% (372/3245) of 3245 adults in a rural village were found to have NAFLD via ultrasonography. In the general population, NAFLD was found to be closely associated with elevated ALT, obesity, diabetes mellitus, hypercholesterolemia, hypertriglyceridemia, and hyperuricemia.5 In non-obese subjects from the same study population, only elevated ALT and hypertriglyceridemia were associated with NAFLD.5
In a cross-sectional survey for prevalence of fatty liver disease in urban and rural areas of Guangdong Province, China, 15% were diagnosed with nonalcoholic fatty liver disease. There was a significantly higher prevalence in urban areas than rural areas, and men < 50 years of age had a significantly higher prevalence than women. However, women over the age of 50 had a higher prevalence than men of the same age range. Factors that correlated with fatty liver disease in this survey were: male gender, urban residency, low educational level, high blood pressure, body mass index, waist circumference, waist to hip ratio, serum triglyceride and glucose levels.14
In a Japanese study of 182 patients with biopsy-confirmed NAFLD, the variables that were significantly associated with severe steatosis were: male gender, younger age, absence of type 2 diabetes. The variables associated with severe fibrosis were female gender, older age, type 2 diabetes and hypertension. The prevalence of high serum triglyceride levels was similar in the two groups.13
Obesity, insulin resistance, and high-sensitivity C-reactive protein levels denoting inflammation are strong predictors of increased ALT activity in NAFLD. Central obesity, raised triglycerides, reduced HDL-C, and raised fasting glucose are metabolic syndrome components that contribute to increased ALT activity.15 In an obese study population, elevated aminotransferases were highest in Hispanics (39%), followed by Caucasians (28%), and African-Americans (12%).16 Nonalcoholic steatohepatitis progresses to liver fibrosis or cirrhosis in 43% of patients. This condition is more common in Hispanics, although more studies on this disorder have been conducted on Caucasians. In a retrospective study focusing on Hispanic patients with biopsy-proven non-alcoholic steatohepatitis to identify independent predictors of cirrhosis, the (aspartate aminotransferase)/ALT ratio was found to be an independent predictor of cirrhosis in Hispanics, while diabetes mellitus was not.17
In a cross-sectional study of a racially diverse representative population in southern California, USA, it was found that the majority of persons with newly diagnosed chronic liver disease were nonwhite. Those with definite or probable NAFLD were Hispanic (28%), Asians (18%), African Americans (3%) and other races (6%). The African-Americans with NAFLD were significantly older than other racial or ethnic groups, and Asians with NAFLD were 3.5 times more likely to be male than female. Also, the Asians with NAFLD had body mass indices that were lower compared with other groups. These racial and gender variations may reflect differences in genetic susceptibility to visceral adiposity and hepatic involvement.18
In biopsy-proven NAFLD patients from India, the clinicopathological profile may be different from that of Western patients. The factors that were found associated with NAFLD were male gender, obesity and central obesity, abnormal HDL and triglycerides. Reduced insulin sensitivity was associated with NAFLD, but abnormal cholesterol, metabolic syndrome, diabetes mellitus and cirrhosis were not.19 Ethnic differences in NAFLD remain poorly understood. A simple test to diagnose NAFLD would help increase our understanding of genetic differences and their effect on NAFLD and other liver diseases.
NAFLD is considered a hepatic manifestation of the metabolic syndrome, a condition which has greatly increased in past decades.20 NAFLD is associated with cirrhosis and end-stage liver disease, including primary liver cancer, and has become a common cause of liver transplant.3 If an effective method could be developed to diagnose this condition early in its course, it could prevent more serious liver diseases from occurring.
Even though a precise diagnosis of NAFLD requires a liver biopsy, it can be invasive and can cause complications. Ultrasound is widely available and relatively accurate.8,9 As far as clinical indicators are concerned, the situation is complicated by the fact that up to 70% of NAFLD patients have normal liver enzymes, yet non-alcoholic steatohepatitis and significant fibrosis are present (6). Obesity, metabolic syndrome or type 2 diabetes do not necessarily accompany NAFLD.3
The use of serum aminotransferase has not been universally accepted to diagnose NAFLD, and if used, it still has not been established whether it should be used alone or with other liver tests. Furthermore, the degree of elevation that denotes abnormal function varies widely and has recently been brought into question. Debate also exists as to whether cutoffs should be different for men and women.21 With all these ambiguities, it is clear that a noninvasive, reliable method is urgently needed for diagnosing and staging NAFLD. The method described herein utilizes an algorithm that can quickly and easily place a patient in a category that accurately defines the degree of fatty liver. It would be particularly useful as a fast, inexpensive primary screening tool for moderate severe fatty liver in clinics where ultrasound is not available.
The limitations of this study are that the patient population only included those from Taiwan who were employed, and that all subjects were adults, with no adolescents or children, and that the algorithm was developed against a surrogate marker, instead of histological data. Additional studies are needed with larger patient sets, different ethnic populations, and adolescents and children to see if similar accuracy can be obtained using our algorithm.
ConclusionA model has been created that can be used to predict the degree of fatty infiltration in NAFLD based on physical and biochemical examination data. It will help clinicians to diagnose this disease easily and without the need for any specialized equipment or expertise.


