


Acute liver failure (ALF) is a dramatic disorder requiring intensive care. MicroRNAs (miRNAs) have been identified to play important roles in ALF. This study was performed to identify miRNA-mRNA co-expression network after ALF to investigate the molecule mechanism underlying the pathogenesis of ALF.
Materials and methodsThe microarray dataset GSE62030 and GSE62029 were downloaded from Gene Expression Omnibus database. Overlapping differentially expressed miRNAs (DEmiRNAs) and genes (DEGs) were identified in liver tissues from patients with hepatitis B virus (HBV)-associated ALF in comparison with normal tissues from donors. Gene enrichment analysis was performed. Key pathways associated with the DEGs were identified. The miRNA-mRNA regulatory network was constructed.
ResultsTotal 42 DEmiRNAs and 523 DEGs were identified in liver tissues from patients with HBV-associated ALF. Gene ontology and pathways enrichment analysis showed upregulated DEGs were related to immune responses, inflammation, and infection, and downregulated DEGs were associated with amino acids, secondary metabolites and xenobiotics metabolism. In miRNA-mRNA co-expression network, DEGs were regulated by at least one DEmiRNA and transcription factor. Further analysis showed DEmiRNAs, including has-miR-55-5p, has-miR-193b-5p, has-miR-200b-3p, and has-miR-3175 were associated with amino acid metabolism, drug metabolism and detoxication, and signaling pathways including mitogen-activated protein kinase (MAPK), phosphatidylinositol 3-kinase (PI3K)/AKT, Ras, and Rap1.
ConclusionsThese miRNA-mRNA pairs and changed profiles were associated with and might be responsible for the impairment of detoxification and metabolism induced by HBV-associated ALF.
Acute liver failure (ALF) is a rare, dramatic and life-threatening disorder often with a fatal outcome and requires intensive care. ALF is a multiorgan clinical syndrome with various clinical features, including hepatic dysfunction, coagulopathy, severe cardiovascular dysfunction, hypoglycemia, hepatic encephalopathy, and multiorgan failure [1–3]. The overall 21-day survival rate of patients with ALF was approximately 75%, and the 21-day transplant-free survival rate was approximately 50% [4]. Up until now it has not effective disease-specific or general treatment for ALF. The lack of broad-spectrum or disease-specific anti-ALF therapeutic agents, which are badly in need, might contribute to ALF-related mortality.
ALF is widely known to be caused by various and uncertainly reasons, the most common reason includes viral hepatitis or drug toxicity [1,3]. MicroRNAs (miRNAs) play important roles, protective or harmful, in the onset, development, and recovery of ALF [5–7]. It has been reported that ALF is associated with the overexpression of miR-125b-5p, which was downregulated in ALF patients, in mouse liver could prevent ALF development [5]. John et al. showed that the upregulations of miR-221 and miR-21 were beneficial for the spontaneous recovery from ALF [7].
MiRNAs are short non-coding RNAs with 18–26nt in length which regulate biological processes via its target genes via, often, negatively regulating the transcription and translation. It has been reported that the pathogenesis and development of ALF might be associated with the dysregulation of miRNAs, such as miR-1224 and miR-106a [6,8]. Tomar et al. showed that the administration of diindolylmethane protected mice from ALF partially by inhibiting the expression of miR-106a and miR-20b in liver mononuclear cells and decreasing its target interleukin (IL)-1 receptor-associated kinase 4 [8]. Roy et al. showed that miR-1224 was upregulated in ALF patients by hydrogen peroxide stimulation in vivo and in vitro in hepatocytes, accompanying by elevated hepatocytes apoptosis [6]. These studies suggested that miRNAs and their targets play important roles in ALF.
The predication or identification of co-expression/regulatory network of miRNA-mRNA at transcriptional level promotes the understanding of miRNA-related disease pathogenesis, development, treatment and recovery [9–11]. This study was performed to identify the differentially expressed miRNA-mRNA co-expression profiles at the transcriptional level in patients with ALF. The miRNA-mRNA co-expression network in ALF was identified and bioinformatics analyses were performed to understand the molecule mechanism underlying the pathogenesis of ALF.
2Materials and methods2.1Microarray dataThe miRNA microarray dataset GSE62030 (platform: GPL14613 [miRNA-2] Affymetrix Multispecies miRNA-2 Array) and gene microarray dataset GSE62029 (platform: GPL570 [HG-U133_Plus_2] Affymetrix Human Genome U133 Plus 2.0 Array) were available from NCBI Gene Expression Omnibus (GEO, https://www.ncbi.nlm.nih.gov/geo/) database. There were 13 liver tissues from 4 patients with HBV-associated ALF and 10 normal healthy liver tissues from volunteers. Diaz et al. got written informed consents from all patients or the next of kins and the approval of ethics committee before their study [9].
2.2Data processing and analysis of differential expressionThe raw data (GEL files) were extracted from GEO database and was processed using R package Oligo (v1.34.0, http://bioconductor.org/help/search/index.html?q=oligo/) [12]. Raw data were dealt with conventional processing, including data format conversion, missing values estimation, MAS background correction and data quantile normalization. For multiple probes mapped to the same one gene or miRNA, the averaged values were calculated and used for further analysis. Probes mapped to no gene and/or miRNA were removed. Accordingly, the gene and miRNA expression matrixes were obtained and differentially expressed miRNAs (DEmiRNAs) and genes (DEGs) between ALF and normal liver tissues were identified using limma (v3.10.3, http://www.bioconductor.org/packages/2.9/bioc/html/limma.html) with Bayesian methods [13]. The thresholds of DEmiRNAs and DEGs were set at adjusted p-value <0.05 and |log2 (fold change, FC)|>1. The expression heatmap of DEmiRNAs and DEGs in all samples were analyzed using pheatmap (v1.0.10, https://cran.r-project.org/web/packages/pheatmap/index.html) [14].
2.3Enrichment analysis for DEGsThe Gene Ontology (GO, http://www.geneontology.org) [15] biological processes and Kyoto Encyclopedia of Genes and Genomes database (KEGG, http://www.genome.ad.jp/kegg) [16] pathways associated with DEGs were predicated using database for annotation, visualization, and integrated discovery (DAVID) online tool (v6.8, https://david-d.ncifcrf.gov/) with the criteria of gene count ≥2 and adjusted p value <0.05. The R package clusterprofiler (v2.4.3, http://bioconductor.org/packages/3.2/bioc/html/clusterProfiler.html) was used for the KEGG pathway annotation with the same criteria.
2.4MiRNA target prediction and annotationThe targets of DEmiRNAs were predicted using miRWalk2.0 (http://zmf.umm.uni-heidelberg.de/apps/zmf/mirwalk2/) [17]. The common mRNA targets in 5 of 8 databases, including miRWalk, miRanda, miRDB, miRMap, miRNAMap, RNA22, Targetscan and mirbridge, were identified and selected as candidate miRNA targets. In addition, the overlaps between candidate targets of DEmiRNAs and identified DEGs (DEmiRNA-targeted DEGs) in microarray data were checked and used for further analysis. The GO biological processes and KEGG pathways associated with DEmiRNA-targeted DEGs were predicated as previously reported. The R package clusterprofiler (v2.4.3, http://bioconductor.org/packages/3.2/bioc/html/clusterProfiler.html) was used for the KEGG pathway annotation with the same criteria.
2.5Network analysisThe construction of miRNA-gene regulatory network was performed using Cytoscape (v3.2.0, http://www.cytoscape.org/) [18]. The interactions among the DEmiRNAs and DEGs were predicted using Search Tool for the Retrieval of Interacting Genes/Proteins (STRING; version 10.0, http://string-db.org/) [19]. The protein–protein interaction (PPI) network was constructed and visualized using Cytoscape. The significant modules in the PPI network were identified using the Cytoscape MCODE plugin, with the criteria of score >10.
2.6Transcription factors (TFs) identification and regulatory network analysisTFs among DEmiRNAs-targeted DEGs were predicted using webgestal (http://www.webgestalt.org/option.php) using the Overrepresentation Enrichment Analysis methods with the threshold of p value <0.05 [20]. The TF-DEGs pairs and networks were visualized using Cytoscape.
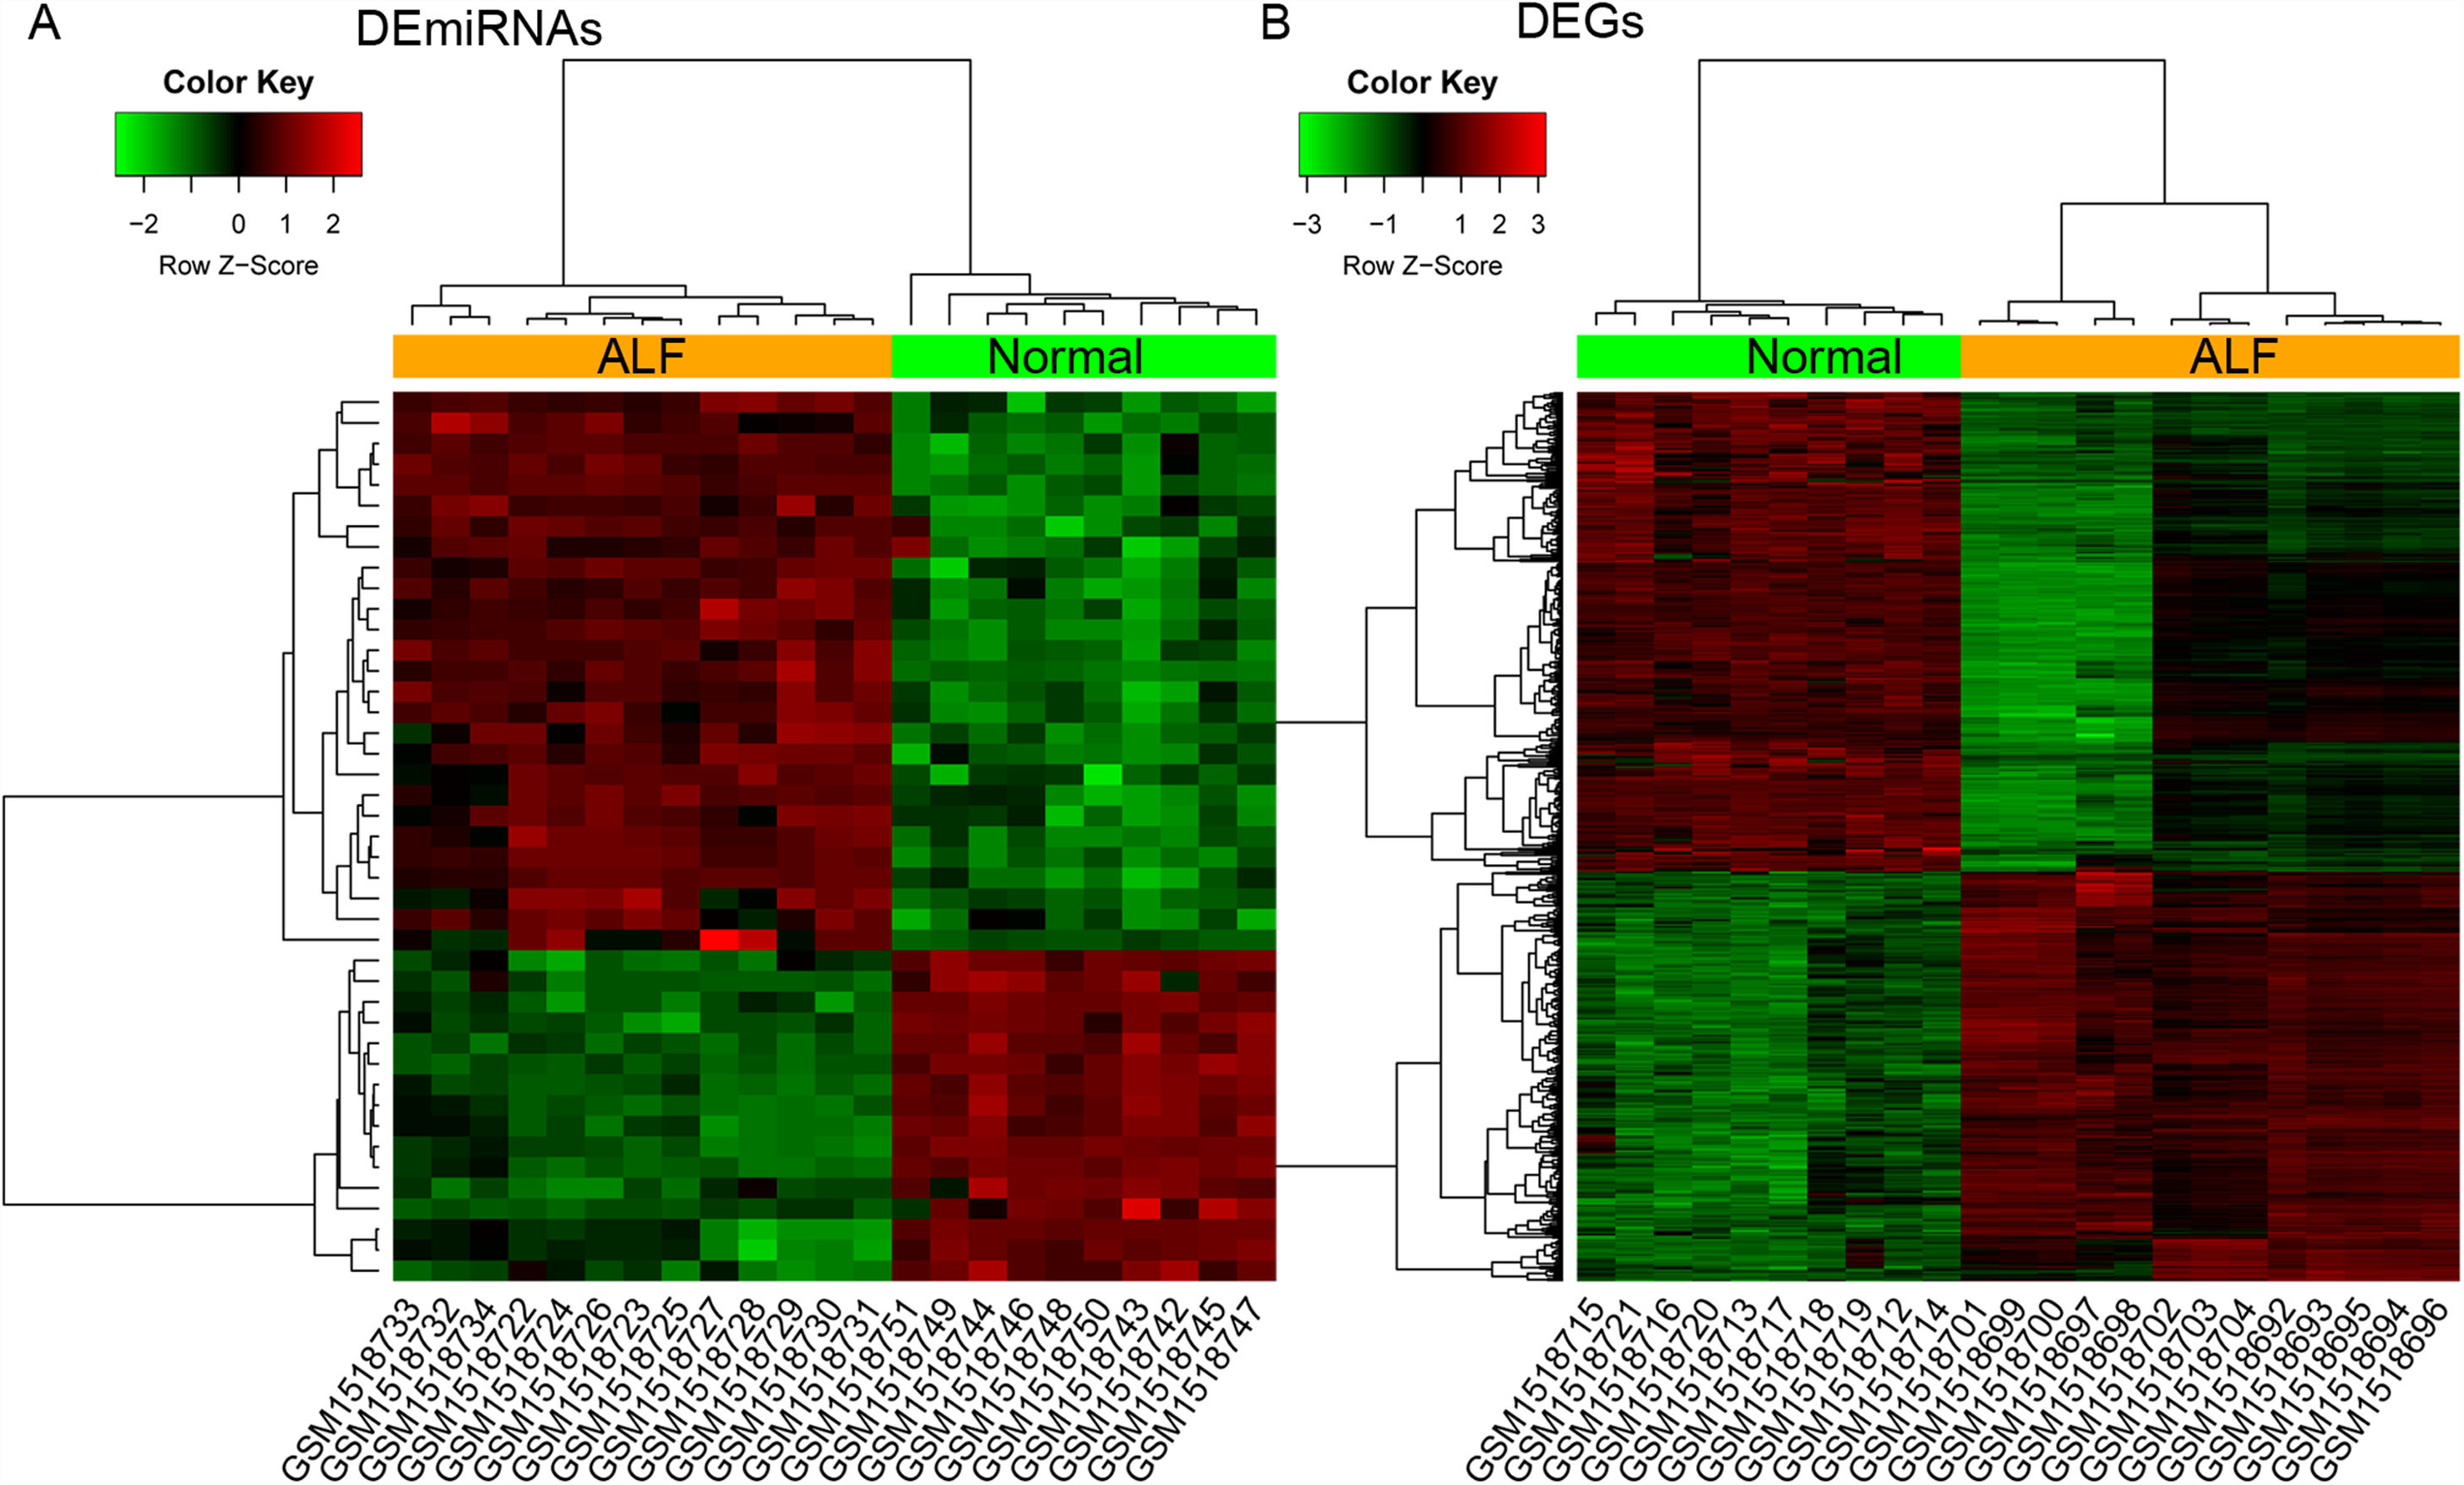
3Results3.1Identification of DEmiRNAs and DEGsA total of 43 DEmiRNAs (including 27 upregulated and 16 downregulated DEmiRNAs) and 523 DEGs (including 241 upregulated and 282 downregulated DEGs) were identified from GSE62030 and GSE62029 dataset, with the threshold of adjusted p-value <0.05 and |log2FC|>1, respectively (Fig. 1). The DEmiRNAs and DEGs are listed in Table S1.
 The heatmap of differentially expressed miRNAs (DEmiRNAs) and genes (DEGs) between 13 ALF liver samples and 10 normal liver tissues from donors, respectively. Red and green notes up and down regulated expression level, respectively.")
The heatmap of differentially expressed items. (A and B) The heatmap of differentially expressed miRNAs (DEmiRNAs) and genes (DEGs) between 13 ALF liver samples and 10 normal liver tissues from donors, respectively. Red and green notes up and down regulated expression level, respectively.
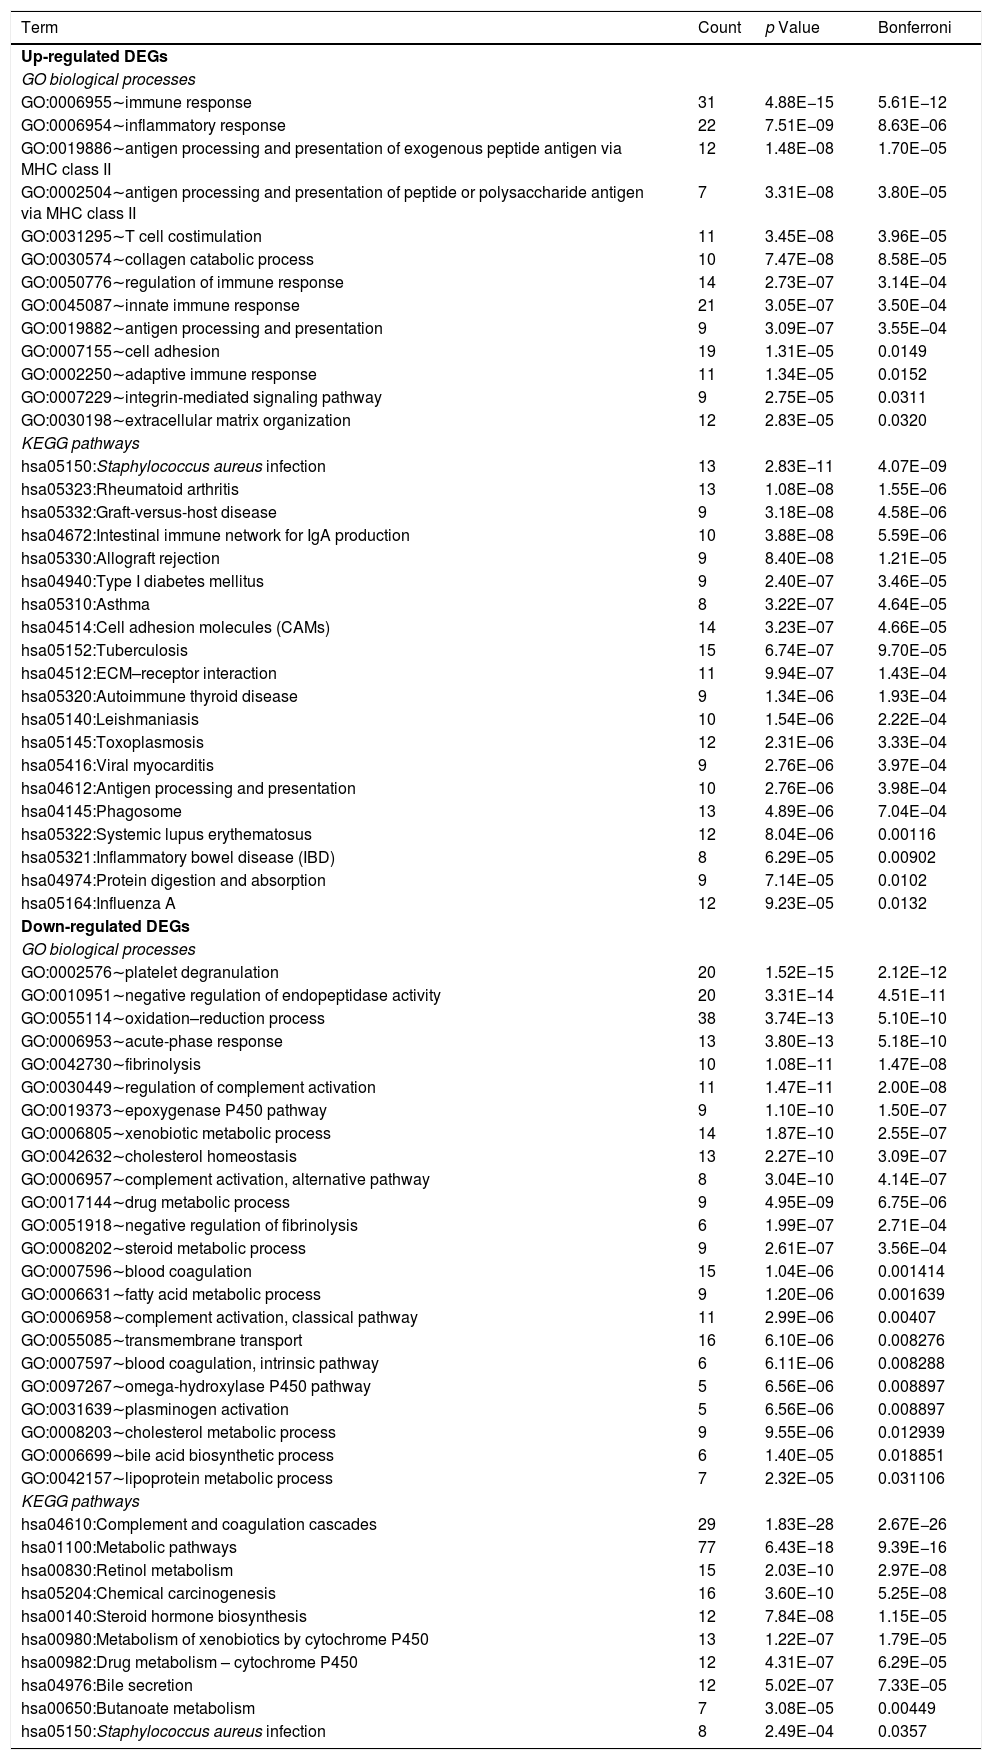
Table 1 shows the GO biological processes and KEGG pathways significantly related to the up- and down-regulated DEGs. We found the upregulated DEGs were associated with biological processes of immune and inflammatory systems, including inflammatory response (GO:0006954) and immune response (GO:0006955). The upregulated DEGs were enriched into KEGG pathways including Staphylococcus aureus infection (hsa05150), rheumatoid arthritis (hsa05323), and intestinal immune network for IgA production (hsa04672). The downregulated DEGs were associated with biological processes including platelet degranulation (GO:0002576), epoxygenase P450 pathway (GO:0019373), oxidation–reduction process (GO:0055114), fibrinolysis (GO:0042730), and acute-phase response (GO:0006953); and were related to pathways including Retinol metabolism (hsa00830), metabolism of xenobiotics by cytochrome P450 (hsa00980), metabolic pathways (hsa01100), and Staphylococcus aureus infection (hsa05150).
GO biological processes and KEGG pathways related to the up- and down-regulated DEGs.
| Term | Count | p Value | Bonferroni |
|---|---|---|---|
| Up-regulated DEGs | |||
| GO biological processes | |||
| GO:0006955∼immune response | 31 | 4.88E−15 | 5.61E−12 |
| GO:0006954∼inflammatory response | 22 | 7.51E−09 | 8.63E−06 |
| GO:0019886∼antigen processing and presentation of exogenous peptide antigen via MHC class II | 12 | 1.48E−08 | 1.70E−05 |
| GO:0002504∼antigen processing and presentation of peptide or polysaccharide antigen via MHC class II | 7 | 3.31E−08 | 3.80E−05 |
| GO:0031295∼T cell costimulation | 11 | 3.45E−08 | 3.96E−05 |
| GO:0030574∼collagen catabolic process | 10 | 7.47E−08 | 8.58E−05 |
| GO:0050776∼regulation of immune response | 14 | 2.73E−07 | 3.14E−04 |
| GO:0045087∼innate immune response | 21 | 3.05E−07 | 3.50E−04 |
| GO:0019882∼antigen processing and presentation | 9 | 3.09E−07 | 3.55E−04 |
| GO:0007155∼cell adhesion | 19 | 1.31E−05 | 0.0149 |
| GO:0002250∼adaptive immune response | 11 | 1.34E−05 | 0.0152 |
| GO:0007229∼integrin-mediated signaling pathway | 9 | 2.75E−05 | 0.0311 |
| GO:0030198∼extracellular matrix organization | 12 | 2.83E−05 | 0.0320 |
| KEGG pathways | |||
| hsa05150:Staphylococcus aureus infection | 13 | 2.83E−11 | 4.07E−09 |
| hsa05323:Rheumatoid arthritis | 13 | 1.08E−08 | 1.55E−06 |
| hsa05332:Graft-versus-host disease | 9 | 3.18E−08 | 4.58E−06 |
| hsa04672:Intestinal immune network for IgA production | 10 | 3.88E−08 | 5.59E−06 |
| hsa05330:Allograft rejection | 9 | 8.40E−08 | 1.21E−05 |
| hsa04940:Type I diabetes mellitus | 9 | 2.40E−07 | 3.46E−05 |
| hsa05310:Asthma | 8 | 3.22E−07 | 4.64E−05 |
| hsa04514:Cell adhesion molecules (CAMs) | 14 | 3.23E−07 | 4.66E−05 |
| hsa05152:Tuberculosis | 15 | 6.74E−07 | 9.70E−05 |
| hsa04512:ECM–receptor interaction | 11 | 9.94E−07 | 1.43E−04 |
| hsa05320:Autoimmune thyroid disease | 9 | 1.34E−06 | 1.93E−04 |
| hsa05140:Leishmaniasis | 10 | 1.54E−06 | 2.22E−04 |
| hsa05145:Toxoplasmosis | 12 | 2.31E−06 | 3.33E−04 |
| hsa05416:Viral myocarditis | 9 | 2.76E−06 | 3.97E−04 |
| hsa04612:Antigen processing and presentation | 10 | 2.76E−06 | 3.98E−04 |
| hsa04145:Phagosome | 13 | 4.89E−06 | 7.04E−04 |
| hsa05322:Systemic lupus erythematosus | 12 | 8.04E−06 | 0.00116 |
| hsa05321:Inflammatory bowel disease (IBD) | 8 | 6.29E−05 | 0.00902 |
| hsa04974:Protein digestion and absorption | 9 | 7.14E−05 | 0.0102 |
| hsa05164:Influenza A | 12 | 9.23E−05 | 0.0132 |
| Down-regulated DEGs | |||
| GO biological processes | |||
| GO:0002576∼platelet degranulation | 20 | 1.52E−15 | 2.12E−12 |
| GO:0010951∼negative regulation of endopeptidase activity | 20 | 3.31E−14 | 4.51E−11 |
| GO:0055114∼oxidation–reduction process | 38 | 3.74E−13 | 5.10E−10 |
| GO:0006953∼acute-phase response | 13 | 3.80E−13 | 5.18E−10 |
| GO:0042730∼fibrinolysis | 10 | 1.08E−11 | 1.47E−08 |
| GO:0030449∼regulation of complement activation | 11 | 1.47E−11 | 2.00E−08 |
| GO:0019373∼epoxygenase P450 pathway | 9 | 1.10E−10 | 1.50E−07 |
| GO:0006805∼xenobiotic metabolic process | 14 | 1.87E−10 | 2.55E−07 |
| GO:0042632∼cholesterol homeostasis | 13 | 2.27E−10 | 3.09E−07 |
| GO:0006957∼complement activation, alternative pathway | 8 | 3.04E−10 | 4.14E−07 |
| GO:0017144∼drug metabolic process | 9 | 4.95E−09 | 6.75E−06 |
| GO:0051918∼negative regulation of fibrinolysis | 6 | 1.99E−07 | 2.71E−04 |
| GO:0008202∼steroid metabolic process | 9 | 2.61E−07 | 3.56E−04 |
| GO:0007596∼blood coagulation | 15 | 1.04E−06 | 0.001414 |
| GO:0006631∼fatty acid metabolic process | 9 | 1.20E−06 | 0.001639 |
| GO:0006958∼complement activation, classical pathway | 11 | 2.99E−06 | 0.00407 |
| GO:0055085∼transmembrane transport | 16 | 6.10E−06 | 0.008276 |
| GO:0007597∼blood coagulation, intrinsic pathway | 6 | 6.11E−06 | 0.008288 |
| GO:0097267∼omega-hydroxylase P450 pathway | 5 | 6.56E−06 | 0.008897 |
| GO:0031639∼plasminogen activation | 5 | 6.56E−06 | 0.008897 |
| GO:0008203∼cholesterol metabolic process | 9 | 9.55E−06 | 0.012939 |
| GO:0006699∼bile acid biosynthetic process | 6 | 1.40E−05 | 0.018851 |
| GO:0042157∼lipoprotein metabolic process | 7 | 2.32E−05 | 0.031106 |
| KEGG pathways | |||
| hsa04610:Complement and coagulation cascades | 29 | 1.83E−28 | 2.67E−26 |
| hsa01100:Metabolic pathways | 77 | 6.43E−18 | 9.39E−16 |
| hsa00830:Retinol metabolism | 15 | 2.03E−10 | 2.97E−08 |
| hsa05204:Chemical carcinogenesis | 16 | 3.60E−10 | 5.25E−08 |
| hsa00140:Steroid hormone biosynthesis | 12 | 7.84E−08 | 1.15E−05 |
| hsa00980:Metabolism of xenobiotics by cytochrome P450 | 13 | 1.22E−07 | 1.79E−05 |
| hsa00982:Drug metabolism – cytochrome P450 | 12 | 4.31E−07 | 6.29E−05 |
| hsa04976:Bile secretion | 12 | 5.02E−07 | 7.33E−05 |
| hsa00650:Butanoate metabolism | 7 | 3.08E−05 | 0.00449 |
| hsa05150:Staphylococcus aureus infection | 8 | 2.49E−04 | 0.0357 |
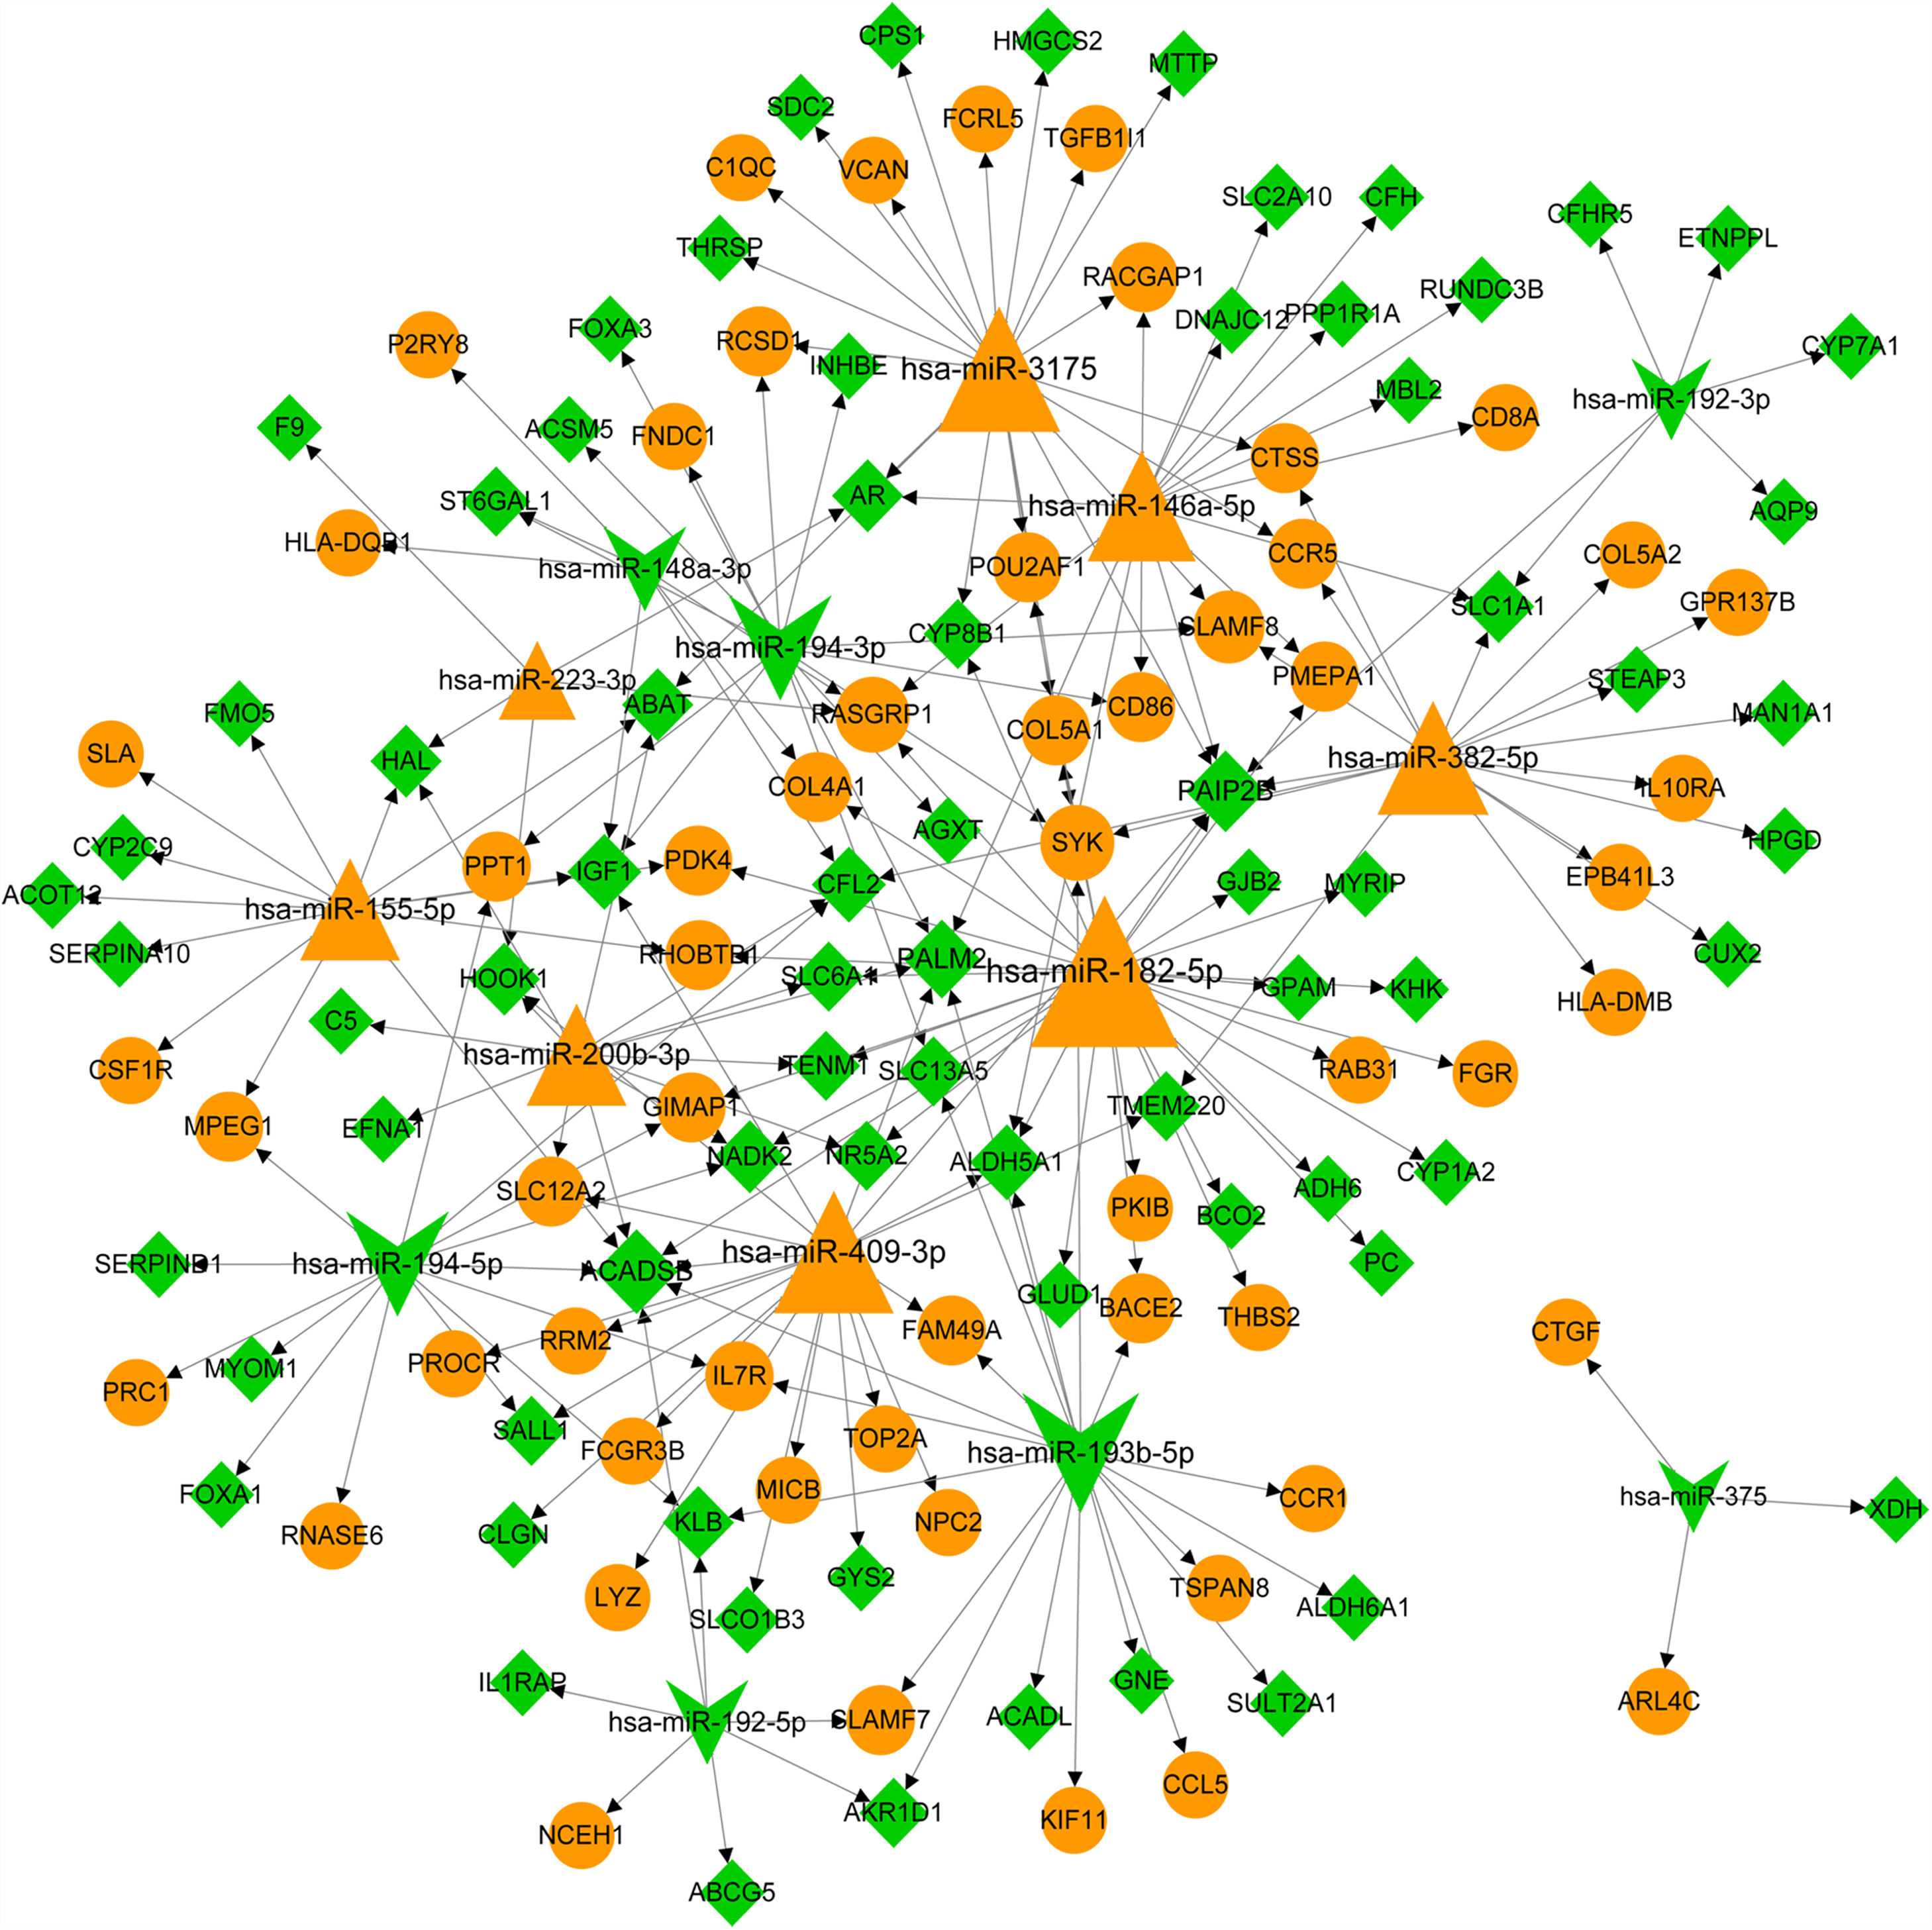
The predicative targets of top 10 up- and down-regulated DEmiRNAs were identified using miRWalk2.0 database. A total of 11,543 targets, including 131 DEGs, were predicted. The DEmiRNA-DEG regulatory network was comprised of 15 DEmiRNAs (including 8 up- and 7 down-regulated DEmiRNAs) and 131 DEGs (including 57 up- and 74 down-regulated DEGs) and 205 miRNA-target pairs (Fig. 2). We noted that some DEGs were regulated by more than one miRNA. For instance, insulin-like growth factor 1 (IGF1, down) was co-regulated by has-miR-155-5p (up), hsa-miR-148a-3p (down), hsa-miR-194-3p (down) and hsa-miR-409-3p (up); cathepsin S (CTSS, up) and β-chemokine receptor 5 (CCR5) were co-regulated by hsa-miR-382-5p (up) and hsa-miR-3175 (up); colony stimulating factor 1 receptor (CSF1R, up) and forkhead box A1 (FOXA1) gene was only regulated by upregulated hsa-miR-155-5p and has-miR-194-5p, respectively. The interaction degree of the miRNA-target pairs in Fig. 2 is listed in Table S2.
. Yellow triangle notes upregulated miRNA. Green yellow indicates downregulated miRNA. Yellow circle represents upregulated DEG. Green rhombus note downregulated DEG. Arrows represent the regulatory direction. The larger the node, the higher the interaction degree.")
The miRNA-target network of top 10 miRNAs and differentially expressed genes (DEGs). Yellow triangle notes upregulated miRNA. Green yellow indicates downregulated miRNA. Yellow circle represents upregulated DEG. Green rhombus note downregulated DEG. Arrows represent the regulatory direction. The larger the node, the higher the interaction degree.
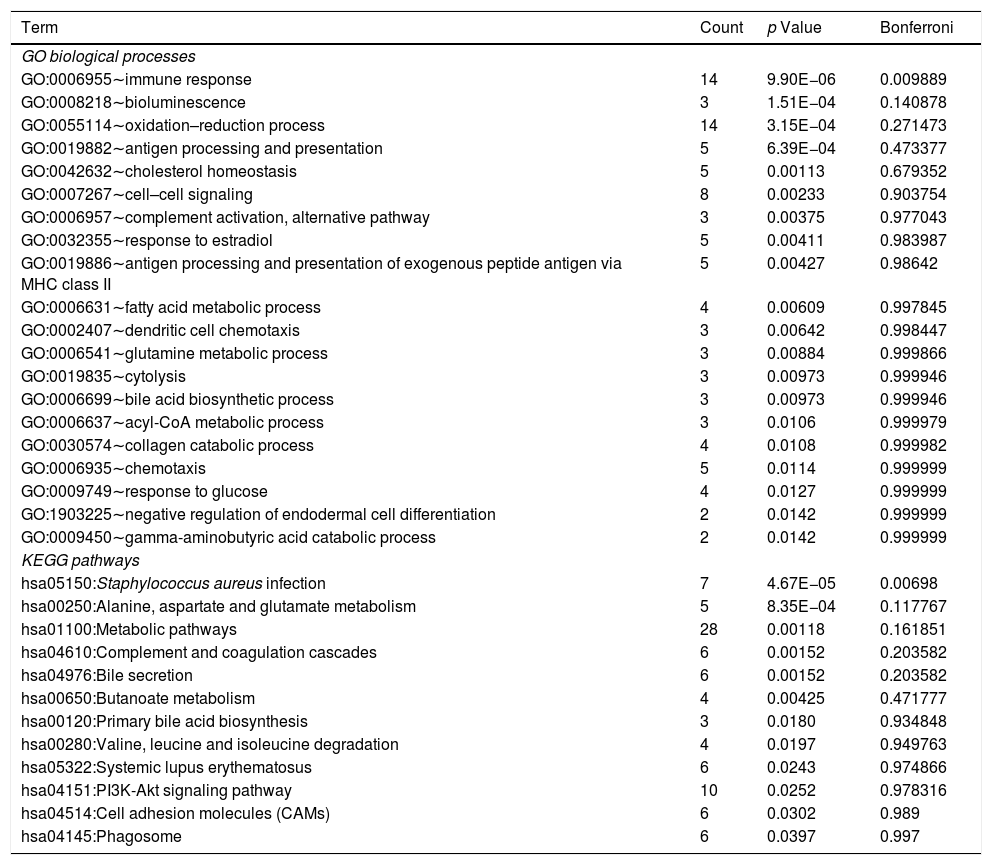
Using DAVID tool, we identified that DEmiRNA-targeted DEGs were significantly enriched into one biological process of immune response (GO:0006955; Table 2). The top 20 biological processes associated with DEmiRNA-targeted DEGs included bioluminescence (GO:0008218), antigen processing and presentation (GO:0019882), cholesterol homeostasis (GO:0042632), and antigen processing and presentation of exogenous peptide antigen via MHC class II (GO:0019886, Table 2). The DEmiRNA-targeted DEGs were significantly enriched in one KEGG pathway S. aureus infection [hsa05150, including leukocyte antigen (HLA) class II genes HLA-DQB1, HLA-DMB, Fcγ-receptor-IIIB gene, and mannose-binding lectin gene]. Other 11 KEGG pathways associated with DEmiRNA-targeted DEGs included alanine, aspartate and glutamate metabolism [hsa00250, including succinate semialdehyde dehydrogenase gene (ALDH5A1) and glyoxylate aminotransferase gene (AGXT)], and bile secretion [hsa04976, organic anion transporting polypeptide 8 encoding gene, ATP-cassette binding proteins G5 and hydroxysteroid sulfotransferase (SULT2A1)]. The detail information of biological processes and KEGG pathways related to DEmiRNA-targeted DEGs is shown in Table S3.
The list of GO biological processes and KEGG pathways related to DEmiRNA-targeted DEGs.
| Term | Count | p Value | Bonferroni |
|---|---|---|---|
| GO biological processes | |||
| GO:0006955∼immune response | 14 | 9.90E−06 | 0.009889 |
| GO:0008218∼bioluminescence | 3 | 1.51E−04 | 0.140878 |
| GO:0055114∼oxidation–reduction process | 14 | 3.15E−04 | 0.271473 |
| GO:0019882∼antigen processing and presentation | 5 | 6.39E−04 | 0.473377 |
| GO:0042632∼cholesterol homeostasis | 5 | 0.00113 | 0.679352 |
| GO:0007267∼cell–cell signaling | 8 | 0.00233 | 0.903754 |
| GO:0006957∼complement activation, alternative pathway | 3 | 0.00375 | 0.977043 |
| GO:0032355∼response to estradiol | 5 | 0.00411 | 0.983987 |
| GO:0019886∼antigen processing and presentation of exogenous peptide antigen via MHC class II | 5 | 0.00427 | 0.98642 |
| GO:0006631∼fatty acid metabolic process | 4 | 0.00609 | 0.997845 |
| GO:0002407∼dendritic cell chemotaxis | 3 | 0.00642 | 0.998447 |
| GO:0006541∼glutamine metabolic process | 3 | 0.00884 | 0.999866 |
| GO:0019835∼cytolysis | 3 | 0.00973 | 0.999946 |
| GO:0006699∼bile acid biosynthetic process | 3 | 0.00973 | 0.999946 |
| GO:0006637∼acyl-CoA metabolic process | 3 | 0.0106 | 0.999979 |
| GO:0030574∼collagen catabolic process | 4 | 0.0108 | 0.999982 |
| GO:0006935∼chemotaxis | 5 | 0.0114 | 0.999999 |
| GO:0009749∼response to glucose | 4 | 0.0127 | 0.999999 |
| GO:1903225∼negative regulation of endodermal cell differentiation | 2 | 0.0142 | 0.999999 |
| GO:0009450∼gamma-aminobutyric acid catabolic process | 2 | 0.0142 | 0.999999 |
| KEGG pathways | |||
| hsa05150:Staphylococcus aureus infection | 7 | 4.67E−05 | 0.00698 |
| hsa00250:Alanine, aspartate and glutamate metabolism | 5 | 8.35E−04 | 0.117767 |
| hsa01100:Metabolic pathways | 28 | 0.00118 | 0.161851 |
| hsa04610:Complement and coagulation cascades | 6 | 0.00152 | 0.203582 |
| hsa04976:Bile secretion | 6 | 0.00152 | 0.203582 |
| hsa00650:Butanoate metabolism | 4 | 0.00425 | 0.471777 |
| hsa00120:Primary bile acid biosynthesis | 3 | 0.0180 | 0.934848 |
| hsa00280:Valine, leucine and isoleucine degradation | 4 | 0.0197 | 0.949763 |
| hsa05322:Systemic lupus erythematosus | 6 | 0.0243 | 0.974866 |
| hsa04151:PI3K-Akt signaling pathway | 10 | 0.0252 | 0.978316 |
| hsa04514:Cell adhesion molecules (CAMs) | 6 | 0.0302 | 0.989 |
| hsa04145:Phagosome | 6 | 0.0397 | 0.997 |
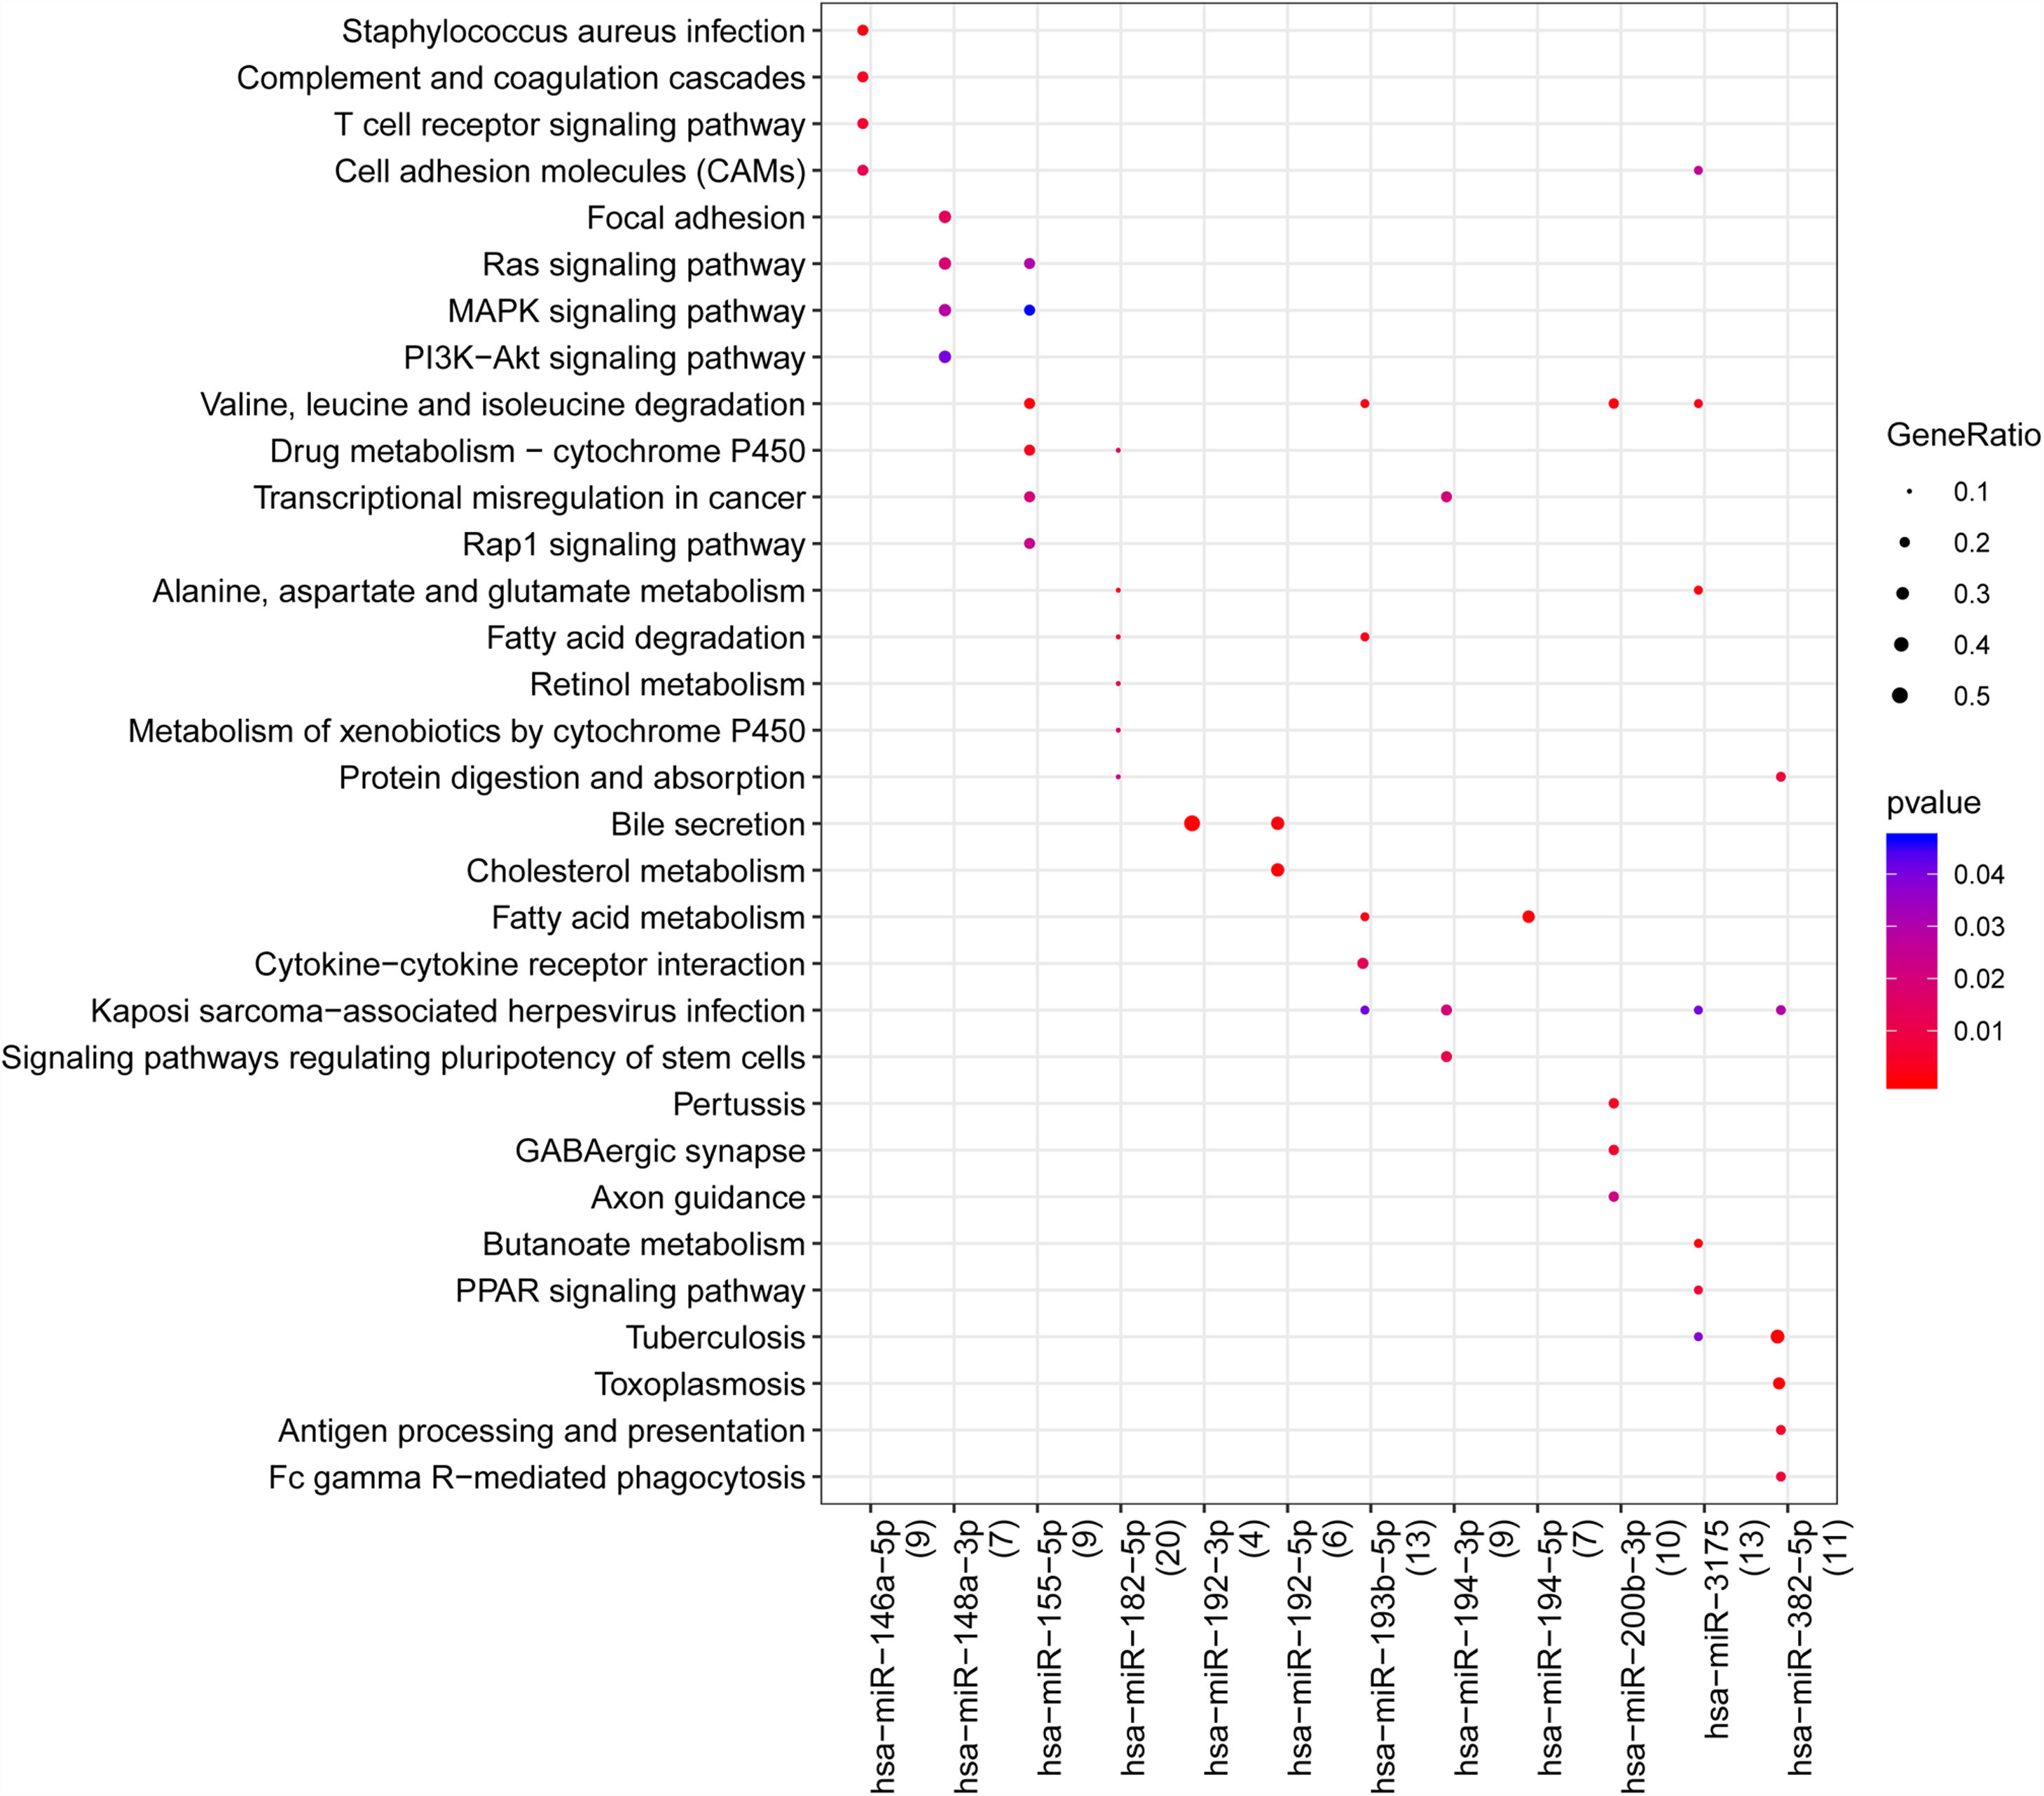
With the enrichment analysis using R package clusterprofiler, we found hsa-miR-146a-5p was associated with S. aureus infection, T cell receptor signaling pathway, cell adhesion molecules (CAMs), and complement and coagulation cascades; hsa-miR-148a-3p was related to mitogen-activated protein kinase (MAPK) signaling pathway, Ras signaling pathway, MAPK signaling pathway and phosphatidylinositol-3-kinase (PI3K)/AKT signaling pathway; hsa-miR-155-5p was associated with valine, leucine and isoleucine degradation, drug metabolism-cytochrome P450, Rap1, Ras and MAPK signaling pathways; hsa-miR-192-5p was associated with bile secretion and cholesterol metabolism; hsa-miR-382-5p and hsa-miR-3175 were related to tuberculosis, kaposi sarcoma-associated herpes virus infection and viral carcinogenesis. In addition, we found hsa-miR-192-5p and hsa-miR-192-3p was related to the secretion of bile (Fig. 3).
3.5PPI network analysis
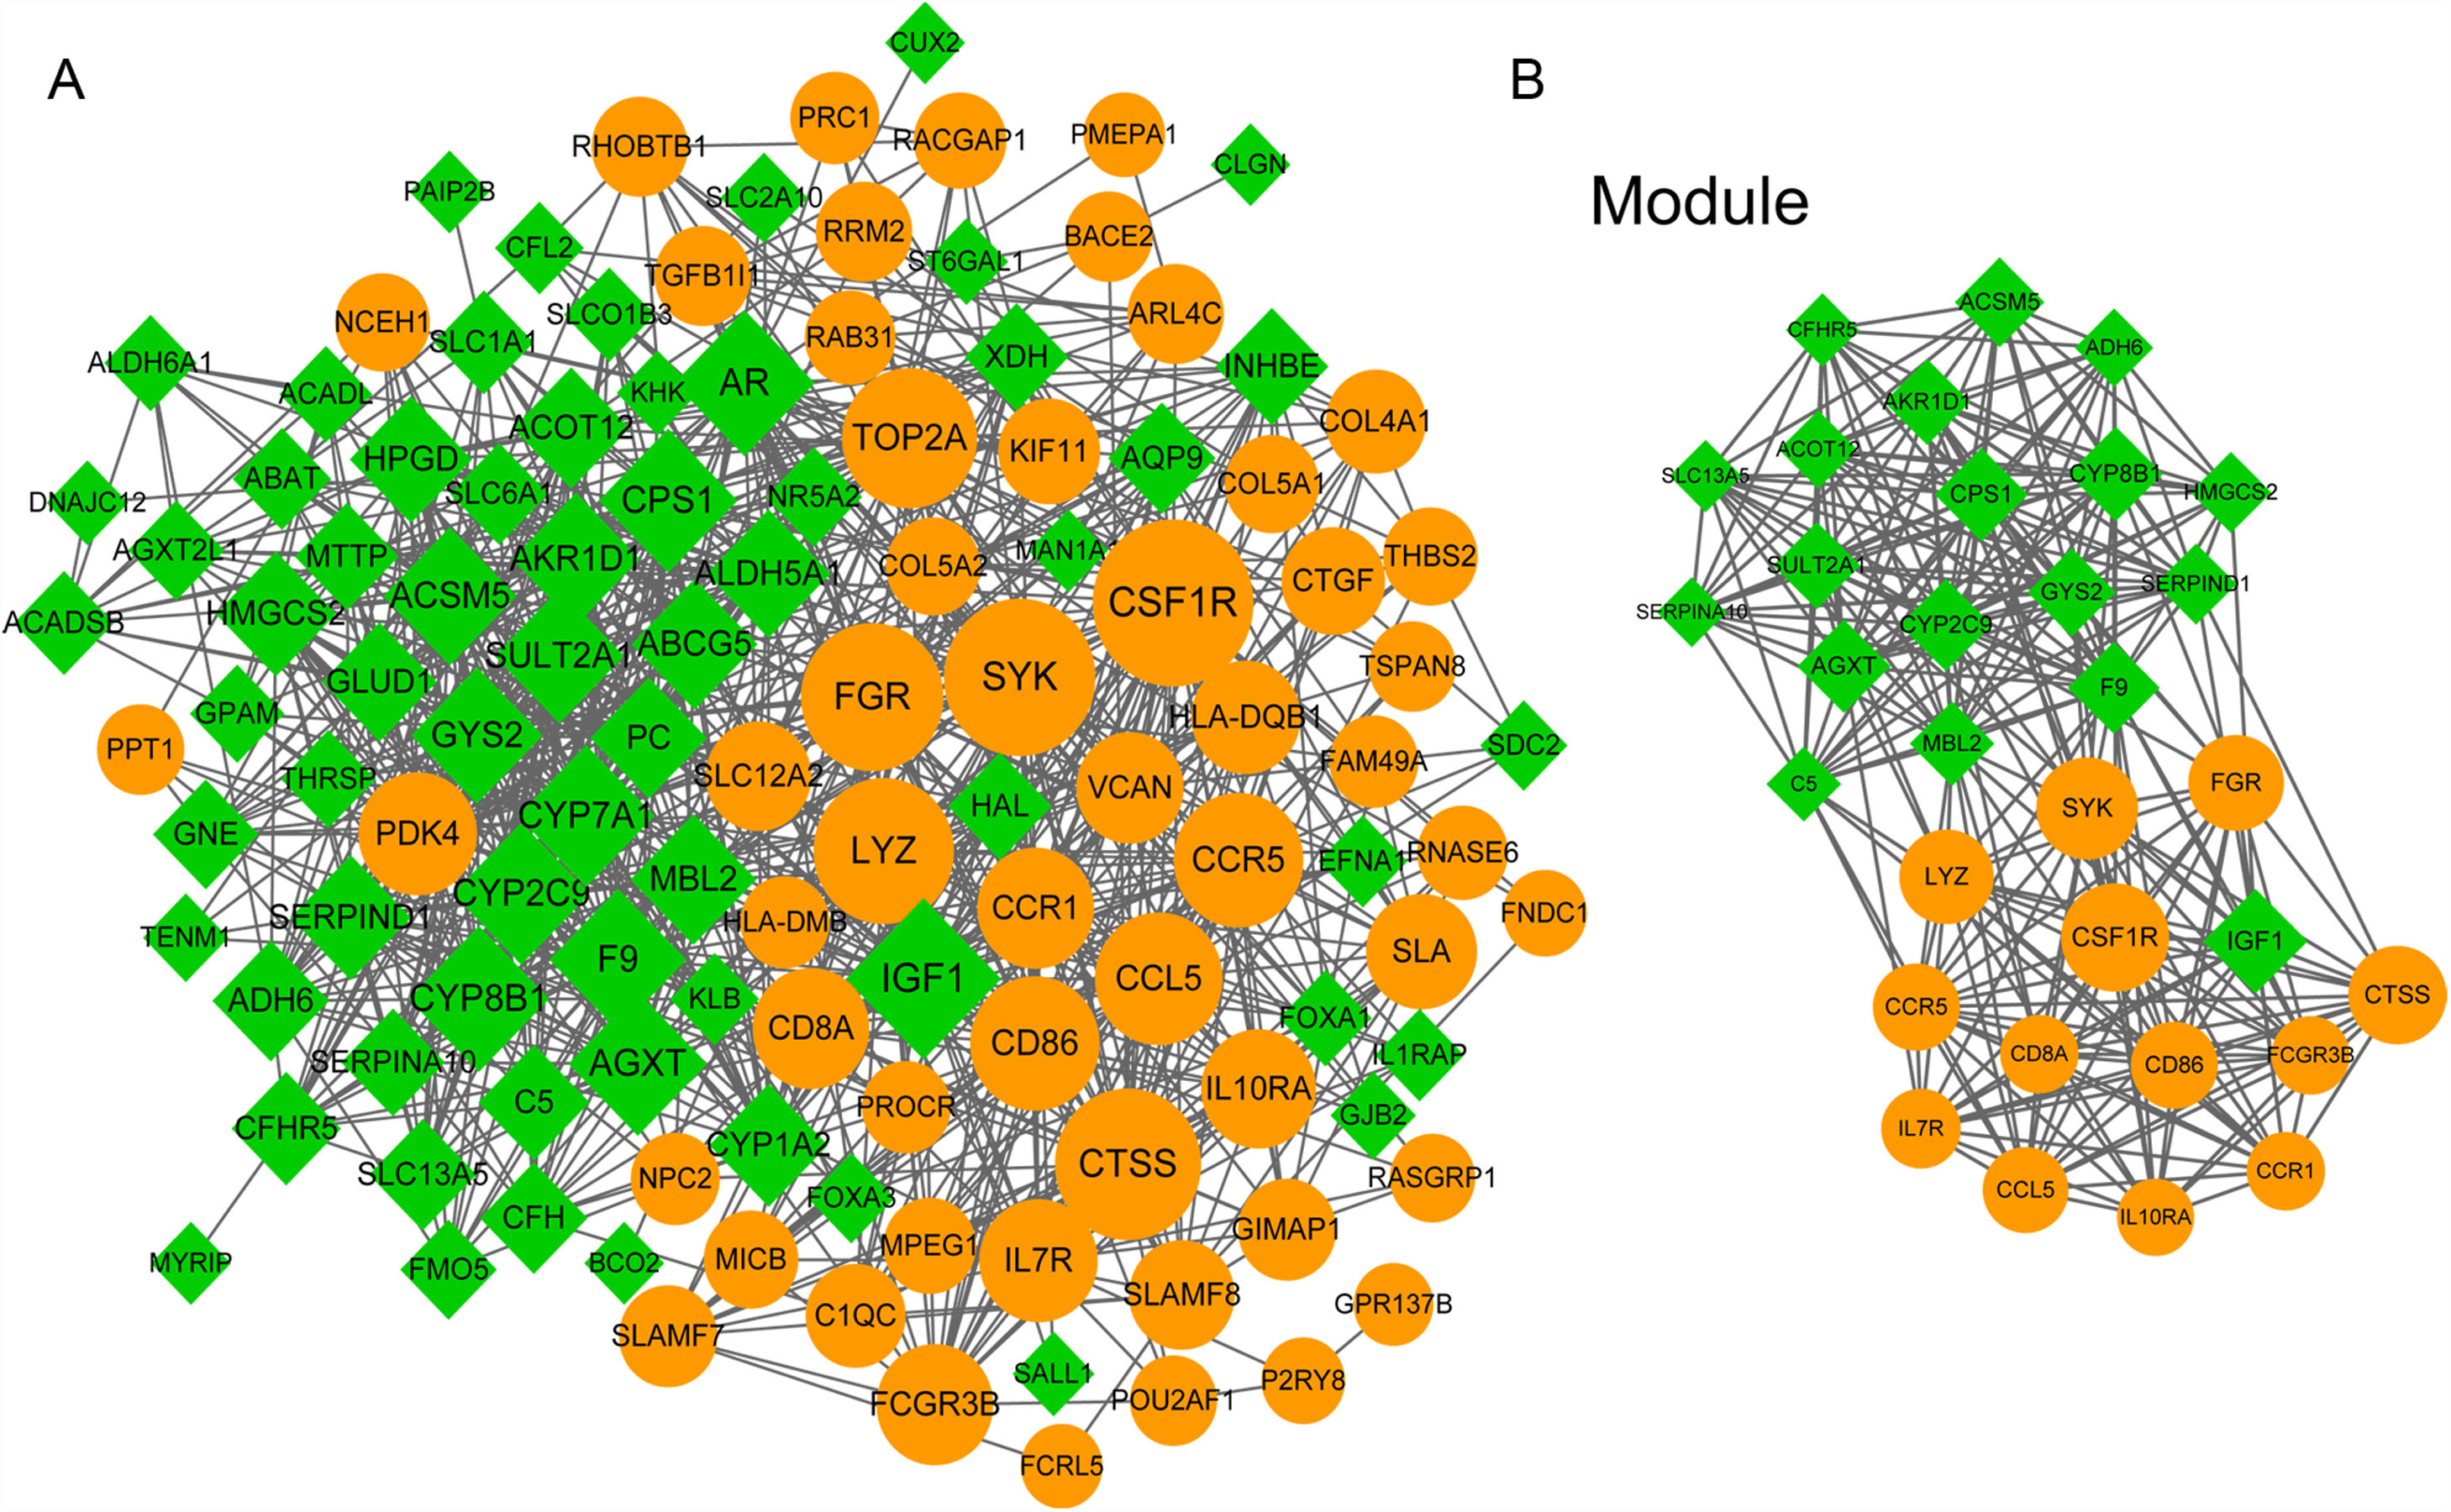
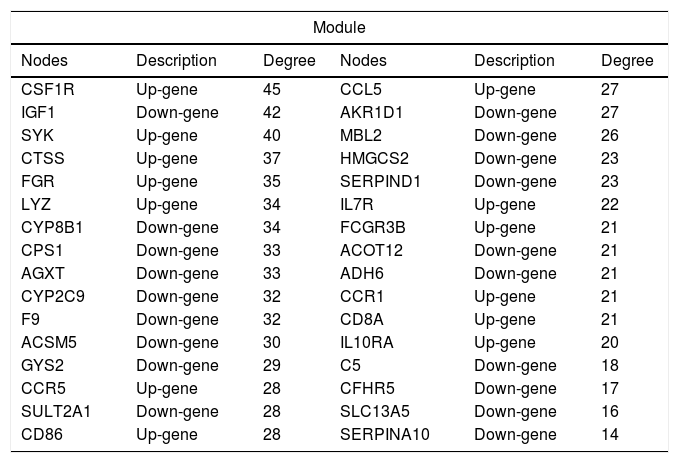
We further constructed the PPI network of the DEGs targeted by the top 10 up- and down-regulated DEmiRNAs. The PPI network was consisted of 882 miRNA-gene pairs (lines) and 120 nodes (gene products, including 54 up- and 66 down-regulated DEGs, Fig. 4A). Using MCODE plugin, we identified a significant module (score=17.032) that was consisted of 264 miRNA-gene pairs and 32 nodes, including CSF1R (degree=45), IGF1 (degree=42), CTSS (degree=37), and SULT2A1 (degree=28, Fig. 4B). The degree of the 32 nodes in the module is listed in Table 3.
 network of differentially expressed genes (DEGs) targeted by the top 10 up- and down-regulated differentially expressed miRNAs (DEmiRNAs). (A) The whole PPI network of top 10 up- and down-regulated DEmiRNAs-targeted DEGs. (B) The significant module (score=17.032) in PPI network. Yellow and green nodes indicate up- and down-regulated DEGs, respectively. The larger the node, the higher the interaction degree.")
The protein–protein interaction (PPI) network of differentially expressed genes (DEGs) targeted by the top 10 up- and down-regulated differentially expressed miRNAs (DEmiRNAs). (A) The whole PPI network of top 10 up- and down-regulated DEmiRNAs-targeted DEGs. (B) The significant module (score=17.032) in PPI network. Yellow and green nodes indicate up- and down-regulated DEGs, respectively. The larger the node, the higher the interaction degree.
The list of 32 nodes’ degree in the module of protein–protein interaction network.
| Module | |||||
|---|---|---|---|---|---|
| Nodes | Description | Degree | Nodes | Description | Degree |
| CSF1R | Up-gene | 45 | CCL5 | Up-gene | 27 |
| IGF1 | Down-gene | 42 | AKR1D1 | Down-gene | 27 |
| SYK | Up-gene | 40 | MBL2 | Down-gene | 26 |
| CTSS | Up-gene | 37 | HMGCS2 | Down-gene | 23 |
| FGR | Up-gene | 35 | SERPIND1 | Down-gene | 23 |
| LYZ | Up-gene | 34 | IL7R | Up-gene | 22 |
| CYP8B1 | Down-gene | 34 | FCGR3B | Up-gene | 21 |
| CPS1 | Down-gene | 33 | ACOT12 | Down-gene | 21 |
| AGXT | Down-gene | 33 | ADH6 | Down-gene | 21 |
| CYP2C9 | Down-gene | 32 | CCR1 | Up-gene | 21 |
| F9 | Down-gene | 32 | CD8A | Up-gene | 21 |
| ACSM5 | Down-gene | 30 | IL10RA | Up-gene | 20 |
| GYS2 | Down-gene | 29 | C5 | Down-gene | 18 |
| CCR5 | Up-gene | 28 | CFHR5 | Down-gene | 17 |
| SULT2A1 | Down-gene | 28 | SLC13A5 | Down-gene | 16 |
| CD86 | Up-gene | 28 | SERPINA10 | Down-gene | 14 |
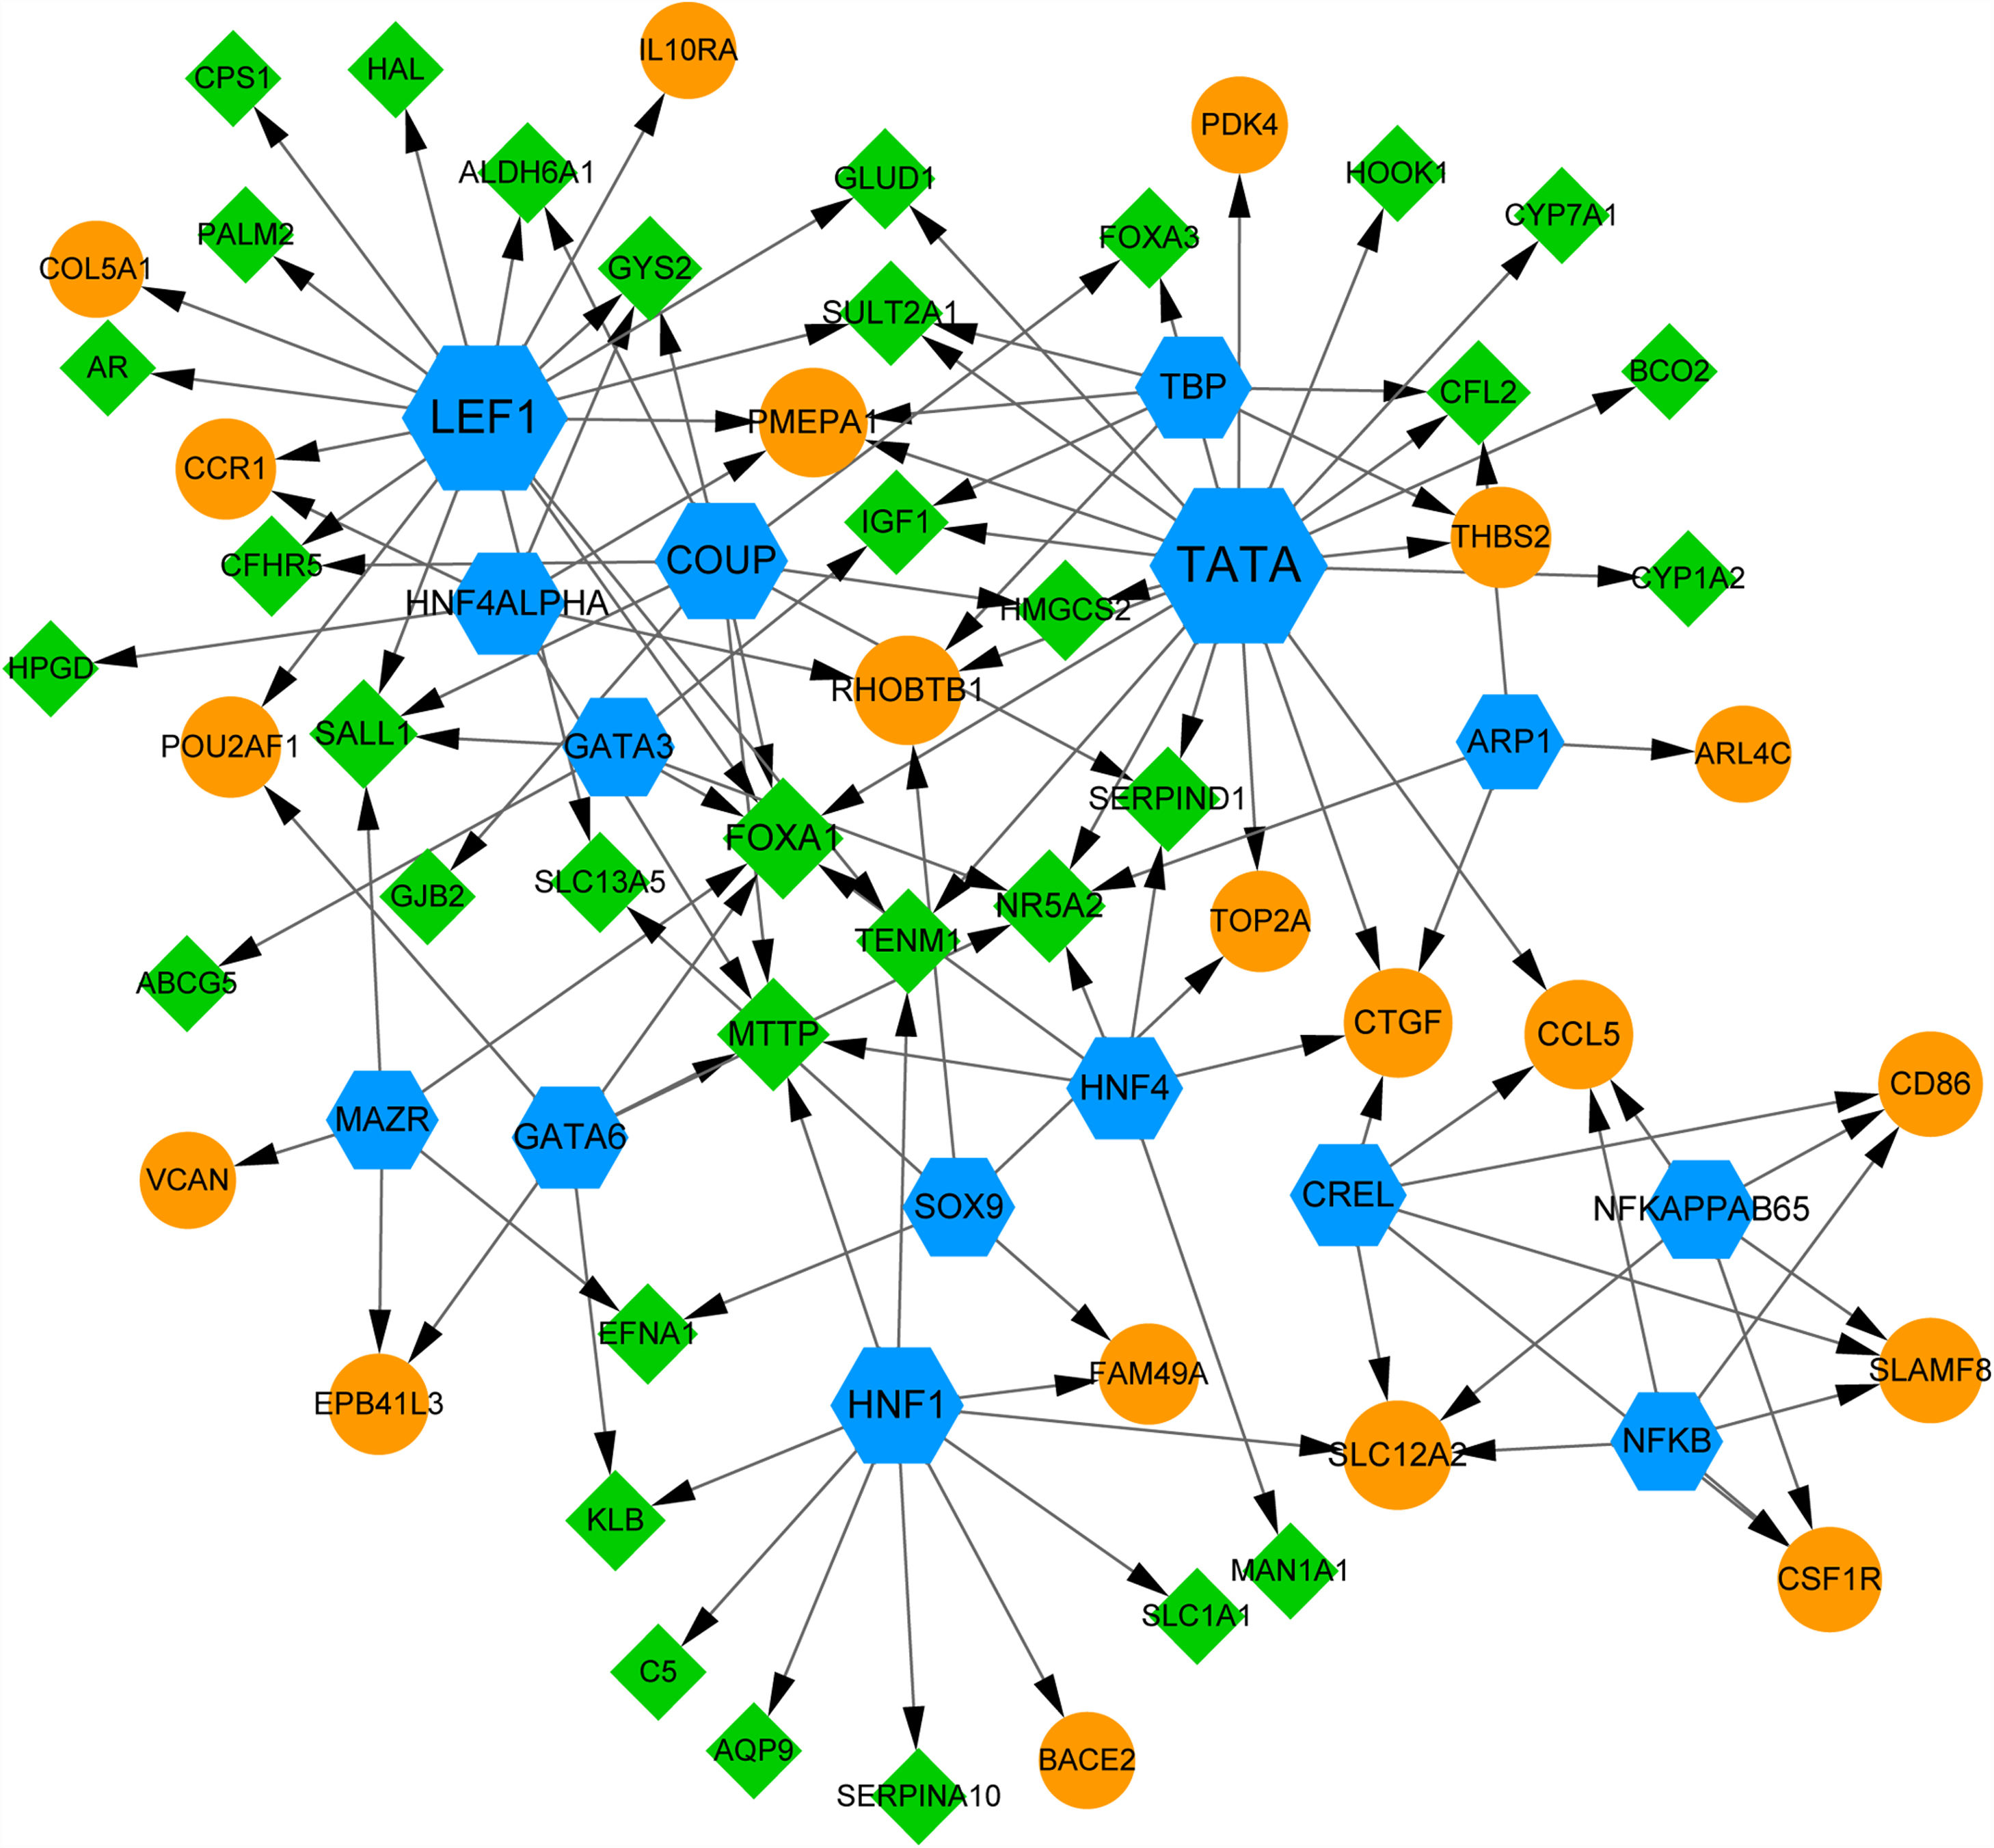
Using webgestal, we identified there were 15 TFs among the top 10 up- and down-regulated DEmiRNAs-targeted DEGs (Fig. 5). A total of 54 DEGs (including 20 up- and 30 down-regulated DEGs) were regulated by these 15 TFs. Fig. 5 shows TFs including TATA, lymphoid enhancer factor 1 (LEF1) and chicken ovalbumin upstream promoter (COUP) regulate more than 10 DEGs; We found the expression of IGF1 was regulated by TFs like TATA, TATA-binding protein (TBP), and GATA binding protein 3 (GATA3); FOXA1 gene was co-regulated by 7 TFs including LEF1, TATA, COUP, GATA3, and HNF4. These results suggested the complex mechanism related to these DEGs.
4Discussion-target regulatory network. Blue hexagons are TFs. Yellow circles and green rhombuses are up- and down-regulated differentially expressed genes (DEGs), respectively. The larger the node, the higher the interaction degree.")
ALF is a rare and life-threatening disorder requiring intensive care and heavy spending [2]. MiRNAs play crucial roles in the pathogenesis of HBV-induced hepatocellular injury and viral persistence [21]. In current study, we identified the co-expression network of miRNA-mRNA in liver tissues from patients with HBV-associated ALF. We identified these HBV-infection-induced DEmiRNAs and DEGs in liver tissues from patients with ALF were related to immune responses, inflammation, herpesvirus infection, amino acid metabolism and metabolism of xenobiotics by cytochrome P450. These results suggested that these miRNAs and genes might be associated with ALF via regulating immune, infection and metabolism system.
It has been reported that the causes of ALF-related deaths include infection, hemorrhage and multiorgan failure [1]. Hepatitis A, B and E virus infections are rare but important common reasons of ALF in many countries, especially hepatitis E virus (HEV) infection in Europe and developing countries [2,4,22,23]. HEV infection is related to various hepatic diseases including acute hepatitis, hepatic dysfunction and ALF [24,25]. HEV infection rate among adults has increased in central Europe [23]. It has been reported that the HEV infection-related ALF is approximate 20–40% in developing countries [26]. Our current study identified that the DEmiRNA miR-382-5p and hsa-miR-3175 were related to KEGG pathways of herpes virus, Epstein–Barr virus (EBV), human immunodeficiency virus 1 (HIV-1) and human cytomegalovirus (HCMV) infections and viral carcinogenesis. We identified that both miR-382-5p and hsa-miR-3175 were upregulated in liver tissues from patients with HBV-associated ALF comparing with normal liver tissues. In addition, the expression of the common target of miR-382-5p and hsa-miR-3175, CTSS, was upregulated. CTSS plays important roles in vacuolar cross-presentation of TAP-Independent MHC Class I molecules and formation of mature epitope [27]. The lack of CTSS in antigen-presenting cells reduced cell-associated antigens, and thus lacking crosspriming to virus [27]. By contrast, the administration of CTSS peptides rescued these above changes [27]. Another cytokine CCR5 was related to the infection by HIV-1 and HBV [28,29]. Choe et al. showed that the expression of CCR5, along with the expression of HIV-1 receptor CD4, eliminated the resistance to HIV-1 in [28]. Stevens et al. showed that the CCR5 loss or deficiency enhanced early NK cell, hepatic innate immune cell and neutrophil recruitment and increased hepatic inflammation [29,30]. We identified that both CTSS and CCR5 were upregulated by over 4 times fold changes in liver tissues from patients with HBV-associated ALF comparing with normal liver tissues. One study has reported that the miRNA profiles could be influenced by HBV infection for permitting the replication of HBV virus and the onset and progression of hepatocellular injury [21]. In addition, we also identified that the upregulated CD86, which is related to immune surveillance and virus infection including HBV [31–33], was co-regulated by upregulated has-miR-146a-5p (associated with T cell receptor signaling pathway) and downregulated has-miR-194-3p. However, there was no direct evidence showing the association of these genes with HBV-infection related ALF up till now. These results in our present study suggested that CTSS, CCR5 and CD86 expression were HBV-associated and the related miRNA-mRNA regulatory networks might be responsible for the immune responses, spontaneous recovery from or deteriorate of ALF.
Our study showed that the two DEmiRNAs (including upregulated hsa-miR-148a-3p, downregulated hsa-miR-155-5p) were associated with the KEGG pathways including MAPK, PI3K-Akt, Ras and Rap1 signaling pathways. These pathways were essential for the proliferation, differentiation and apoptosis of various cells, including hepatocytes [34,35]. The activation of Ras promoted Rap1-mediated activation of cyclic adenosine monophosphate (cAMP)/extracellular signal-regulated kinase (ERK) [36]. The cAMP-ERK axis was crucial for activation of MAPK signaling pathway [37,38]. Previous study had shown that hsa-miR-155-5p was inducible by hypoxia and hypoxia-inducible factor (HIF)-1α [39,40]. hsa-miR-155-5p targets to TF ELK3 [40]. The IGF1 pathway is related to various conditions, including cancer, aging and diabetes via regulating cell growth, survival and differentiation [41,42]. Carotti et al. showed that the impairment of growth hormone-induced IGF-1 axis, reduction or inhibition exactly, was negatively associated with chronic hepatitis and liver damage level [43]. IGF1 is also essential for hepatocyte proliferation [44]. In addition, we identified that IGF1 (downregulated) was a common target of hsa-miR-155-5p (upregulated), hsa-miR-148a-3p (downregulated), hsa-miR-194-3p (downregulated) and hsa-miR-409-3p (upregulated). IGF1 was predicated to be regulated by three TFs including TATA, TBP and GATA3. These results showed that the dysregulation of these miRNAs and their target mRNAs were associated with the ALF via modulating cell growth and apoptosis through a variety of signaling pathways or axises. These might also be responsible for the multiorgan dysfunction after ALF.
We also found a DEG related to neurons and degradation of γ-aminobutyric acid (GABA), ALDH5A1, was downregulated. The deficiency or mutations of ALDH5A1 is found in neurometabolic disease by impairing the GABA degradation [45]. We predicted that ALDH5A1 is a common target of hsa-miR-146a-5p, hsa-miR-182-5p, hsa-miR-409-3p and hsa-miR-193b-5p, and is regulated by two TFs including COUP and LEF1. These results were consistent with the reported fact that ALF induced hepatic encephalopathy.
In addition to the impairment in immune and infection response and multiorgan function, the body's metabolic systems were impaired by ALF. We demonstrated that most of the downregulated DEGs were associated with biological processes and pathways including amino acids and secondary metabolite metabolism, biosynthesis and degradation. For instance, hsa-miR-155-5p, hsa-miR-182-5p, has-miR-193-5p, hsa-miR-200b-3p and hsa-miR-3175 were associated with ‘valine, leucine and isoleucine degradation’, ‘fatty acid degradation’ and/or ‘drug metabolism-cytochrome P450’. Most of the degradation of amino acids were conducted in liver. AGXT is a gene widely reported to be associated with primary hyperoxaluria type 1 (PH1) in children and accumulation of kidney stones [46]. Both PH1 and kidney stone are resulted from the excessive accumulation of oxalate which is induced by abnormal amino acid metabolism in liver. Mutation or reduced expression of AGXT in liver blocks the conversion from glyoxylic acid to glycine and enhances its transfer to oxalic acids, and the accumulation of oxalate in plasma and urine [46,47]. SULT2A1 is an enzyme for many drugs and xenobiotic detoxification and homeostasis of hydroxysteroid [48,49]. SULT2A1 catalyzes degradation of drugs and xenobiotics, including xenobiotic alcohols, phenols, and amines [49,50]. In our present study, we found SULT2A1 and AGXT were downregulated in liver tissues from patients with HBV-associated ALF comparing with normal tissues. In addition, we identified that AGXT was targeted by downregulated has-miR-194-3p, and SULT2A1 was targeted by downregulated has-miR-193-5p, respectively. These facts revealed these miRNA-mRNA pairs played important roles in detoxification and metabolism in liver. The dysregulations of these miRNA-mRNA pairs were associated and might be responsible for the ALF-related multisystem failure.
5ConclusionsIn summary, we concluded these DEmiRNAs and DEGs in liver tissues from patients with HBV-associated ALF comparing with normal tissues were associated with the pathogenesis of ALF. These genetic factors and regulatory networks might be responsible for the HBV-induced impairment in detoxification and metabolism in liver as well as in HBV-induced multiorgan dysfunction. This study provided new insights of miRNA-mRNA co-expression network into the molecular mechanism underlying HBV-associated ALF.AbbreviationsAGXT glyoxylate aminotransferase gene succinate semialdehyde dehydrogenase cell adhesion molecules cyclic adenosine monophosphate β-chemokine receptor 5 chicken ovalbumin upstream promoter colony stimulating factor 1 receptor cathepsin S database for annotation; visualization; and integrated discovery differentially expressed genes differentially expressed miRNAs fold change forkhead box A1 γ-aminobutyric acid gene ontology human cytomegalovirus hypoxia-inducible factor human immunodeficiency virus 1 insulin-like growth factor 1 interleukin Kyoto Encyclopedia of Genes and Genomes database lymphoid enhancer factor 1 mitogen-activated protein kinase microRNAs primary hyperoxaluria type 1 phosphatidylinositol-3-kinase protein–protein interaction Search Tool for the Retrieval of Interacting Genes/Proteins hydroxysteroid sulfotransferase TATA-binding protein transcription factors
Pan K.D., Pan P., and Wu C.N.: study design, data interpretation. Wang Y.C., Xu G.H., and Mo L.J.: data analysis. Pan K.D. and Cao L.J.: manuscript drafting. Wu C.N. Pan P., and Wang Y.C.: revision for important intellectual content. All authors have read and approved the final version of manuscript.
FundingNone.
Conflict of interestThe authors have no conflicts of interest to declare.
The following are the supplementary data to this article:


