


To evaluate the accuracy of magnetic resonance imaging measurements of cartilage tissue-mimicking phantoms and to determine a combination of magnetic resonance imaging parameters to optimize accuracy while minimizing scan time.
METHOD:Edge dimensions from 4 rectangular agar phantoms ranging from 10.5 to 14.5 mm in length and 1.25 to 5.5 mm in width were independently measured by two readers using a steel ruler. Coronal T1 spin echo (T1 SE), fast spoiled gradient-recalled echo (FSPGR) and multiplanar gradient-recalled echo (GRE MPGR) sequences were used to obtain phantom images on a 1.5-T scanner.
RESULTS:Inter- and intra-reader reliability were high for both direct measurements and for magnetic resonance imaging measurements of phantoms. Statistically significant differences were noted between the mean direct measurements and the mean magnetic resonance imaging measurements for phantom 1 when using a GRE MPGR sequence (512x512 pixels, 1.5-mm slice thickness, 5:49 min scan time), while borderline differences were noted for T1 SE sequences with the following parameters: 320x320 pixels, 1.5-mm slice thickness, 6:11 min scan time; 320x320 pixels, 4-mm slice thickness, 6:11 min scan time; and 512x512 pixels, 1.5-mm slice thickness, 9:48 min scan time. Borderline differences were also noted when using a FSPGR sequence with 512x512 pixels, a 1.5-mm slice thickness and a 3:36 min scan time.
CONCLUSIONS:FSPGR sequences, regardless of the magnetic resonance imaging parameter combination used, provided accurate measurements. The GRE MPGR sequence using 512x512 pixels, a 1.5-mm slice thickness and a 5:49 min scan time and, to a lesser degree, all tested T1 SE sequences produced suboptimal accuracy when measuring the widest phantom.
Magnetic resonance imaging (MRI) is a non-invasive, multiplanar imaging modality that enables three-dimensional assessments of joints and their surrounding soft tissue structures. MRI is the method of choice for the direct, non-invasive visualization of cartilage 1. MRI-derived cartilage measurements are useful for exploring the effects of modifiable risk factors on articular cartilage prior to clinical disease and for identifying potential preventive strategies. Thus, these measurements are of great value for monitoring treatment responses in childhood arthritis 2-4. However, the small dimensions of pediatric articular cartilage make the measurement of this tissue using conventional MRI scanners challenging, as such, it is difficult to obtain accuracy in such measurements. While past studies have established that MRI-derived cartilage measurements produce high face validity when using cadaveric and surgical specimens from adults 5-12, to our knowledge, few if any prior studies have determined the criterion validity of MRI-based measurements of maturing cartilage using cadaveric or surgical specimens or phantoms as reference standards. Currently, most of the available information in the literature relates to observational studies the effects of sex, age, growth, Tanner stage and physical activity on articular cartilage volume 12,13.
Determining the accuracies of different MRI sequences currently being used in clinical practice to assess maturing cartilage in children and adolescents is crucial given that articular cartilage thickness tends to reduce during physiologic growth. Therefore, accurate measurements are required to discriminate minimal arthropathy (which requires treatment) from normal physiologic growth. The goals of the current study were to assess the inter- and intra-reader reliabilities of direct and MRI-acquired measurements of phantoms, to evaluate the accuracies of MRI-derived measurements of pediatric articular cartilage using four different-sized agar phantoms designed to mimic the average dimensions of pediatric cartilage tissue and to determine the combination of MRI sequences and parameters that optimizes accuracy while minimizing scan time.
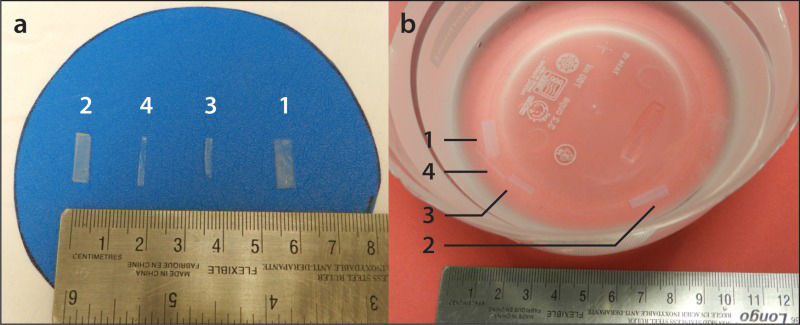
MATERIALS AND METHODSPhantom Preparation and MeasurementsFour rectangular tissue-mimicking phantoms composed of distilled water and 3% by mass agar (high-strength A-6924 Sigma Chemical, St Louis, MO) were prepared as described elsewhere 14 and served as pediatric cartilage samples (Figure 1a). The phantoms consisted of four variably sized agar-based prototypes that were customized to encompass orthogonally intersecting walls with top-view edge dimensions in length x width of 14.4 x 5.5 mm (phantom 1), 13.6 x 3.8 mm (phantom 2), 10.6 x 2.1 mm (phantom 3) and 14.6 x 1.3 mm (phantom 4). The phantoms' edge dimensions were independently measured by two readers, a pediatric radiologist (A.S.D.) and a clinical research assistant (J.R.M.), using a 15-cm calibrated steel ruler. The dimensions were measured twice by the readers, who were blinded to each other's results. All dimensions were recorded in mm. These direct measurements served as the reference standards for this study.
MRI Protocol and Interpretation on a planar surface in ambient air (a) and embedded in a saline-Magnevist® bath (b).")
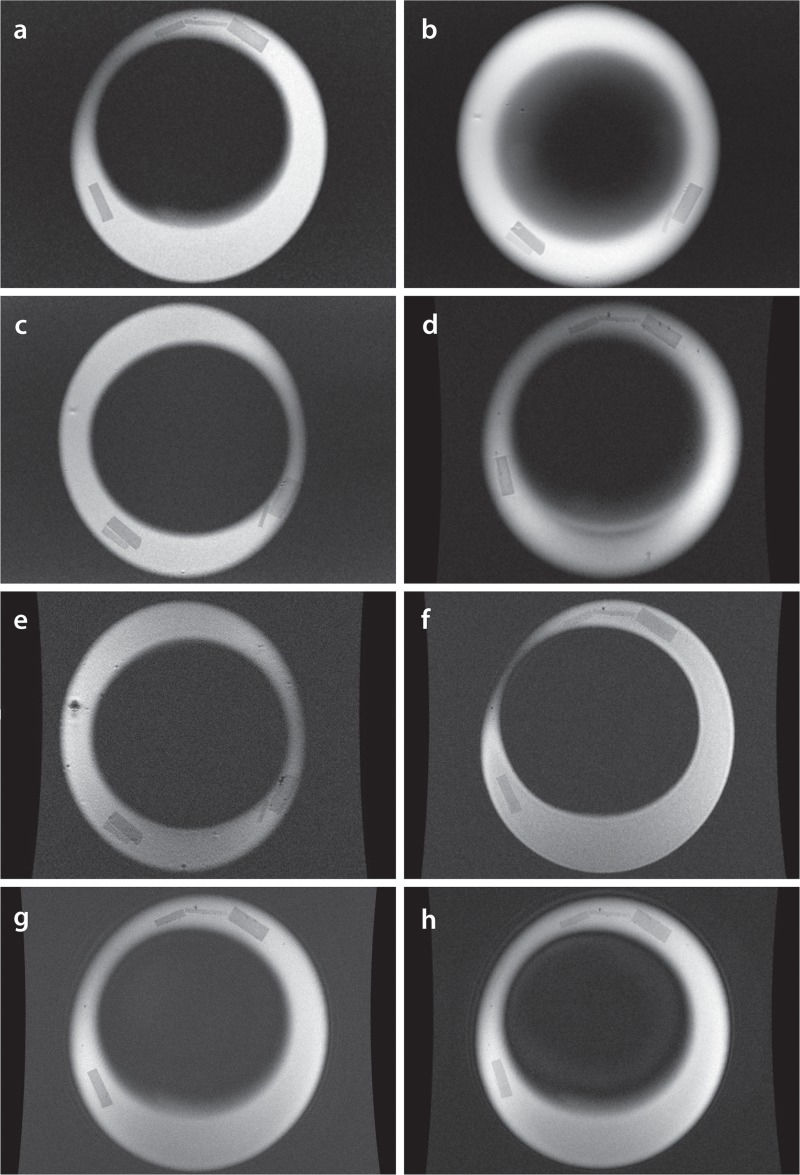
Imaging was conducted on a 1.5 Tesla Twin Speed MRI scanner (General [GE] Electric Medical Systems, Milwaukee, WI, USA) using an 8-channel volumetric knee coil. Coronal T1-weighted spin-echo (T1 SE) [3 sequences with different parameters], fast spoiled gradient-recalled echo (FSPGR) [3 sequences with different parameters] and multiplanar gradient-recalled echo (GRE MPGR) [2 sequences with different parameters] images of the phantoms were obtained while they were embedded in a saline-Magnevist® bath at a concentration of 469 mg/mL [0.5 mmol/mL]) (Figure 1b). Details on the MRI sequences are available in Table 1. The MR images (Figure 2) were independently viewed and measured on a General Electric (GE) Advantage Workstation (software version 4.2, General Electric Medical Systems) by the readers. The MRI data were read twice by each reader in a random order. A two-week interval was used between baseline and repeat measurements to reduce any potential recall effect. The readers were blinded to each other's measurements as well as to their own baseline sets of measurements.
Magnetic resonance imaging sequence parameters and statistically significant differences (p-values) between the mean direct measurements and the mean MRI measurements (shown in bold).
| Pulse sequence | T1 SE | GRE MPGR | FSPGR | ||||||
|---|---|---|---|---|---|---|---|---|---|
| MRI parameters | Matrix (pixels) | 320x320 | 320x320 | 512x512 | 320x320 | 512x512 | 512x512 | 512x512 | 1024x1024 |
| Slice thickness (mm) | 1.5 | 4 | 1.5 | 4 | 1.5 | 1.5 | 0.5 | 1.5 | |
| NEX | 2 | 2 | 2 | 2 | 2 | 1 | 1 | 1 | |
| Scan time (min) | 6:11 | 6:11 | 9:48 | 3:40 | 5:49 | 3:36 | 3:38 | 10:33 | |
| TE (ms) | 12 | 12 | 12 | 15 | 15 | Min full | Min full | Min full | |
| TR (ms) | 568 | 568 | 568 | 450 | 450 | N/A | N/A | N/A | |
| Bandwidth (kHz) | 31.2 | 31.2 | 31.2 | 15.6 | 15.6 | 31.2 | 31.2 | 31.3 | |
| FOV (mm) | 150 | 150 | 150 | 150 | 150 | 160 | 160 | 160 | |
| Dimension | 2D | 2D | 2D | 2D | 2D | 3D | 3D | 3D | |
| Differences (p-values) in the mean values between the direct measurements and the MRI measurements (mm) | Phantom 1(Min width = 3.0 mm, m.d.e.m. = 9.94 mm) | 0.45 (p=0.05) | 0.48 (p=0.02) | 0.48 (p=0.03) | 0.35 (p=0.11) | 0.61 (p=0.007) | 0.40 (p=0.05) | 0.39 (p=0.10) | 0.41 (p=0.05) |
| Phantom 2(Min width = 2.5 mm, m.d.e.m. = 8.69 mm) | 0.25(p=0.22) | 0.25(p=0.56) | 0.31(p=0.29) | 0.05(p=0.47) | 0.42(p=0.35) | 0.19 (p=0.35) | 0.32(p=0.14) | 0.23(p=0.12) | |
| Phantom 3(Min width = 1.5 mm, m.d.e.m. = 6.38 mm) | 0.042 (p=0.83) | 0.33(p=0.27) | 0.06(p=0.20) | -0.017(p=0.40) | 0.008(p=0.76) | 0.09 (p=0.74) | -0.050 (p=0.71) | 0.07 (p=0.69) | |
| Phantom 4(Min width = 0.5 mm, m.d.e.m. = 7.94 mm) | 0.20 (p=0.51) | 3.12(p=0.22) | 3.17(p=0.21) | 0.11(p=0.45) | 3.19(p=0.20) | 0.16 (p=0.63) | 0.41 (p=0.20) | 0.26(p=0.34) | |
FOV field of view, FSPGR fast spoiled gradient-recalled echo, GRE MPGR multiplanar gradient-recalled echo, Min full minimum achievable TE with full echo acquisition, m.d.e.m. mean direct edge measurement, Min width minimum width, N/A not applicable, NEX number of excitations, T1 SE T1-weighted spin-echo, TE echo time, TR repetition time.
 T1-weighted spin-echo (SE), 320 x 320 pixels, 1.5-mm slice thickness; (b) T1 SE, 320 x 320 pixels, 4-mm slice thickness; (c) T1 SE, 512 x 512 pixels, 1.5-mm slice thickness; (d) Multiplanar gradient-recalled echo (GRE MPGR), 320 x 320 pixels, 1.5-mm slice thickness; (e) GRE MPGR, 512 x 512 pixels, 1.5-mm slice thickness; (f) Fast spoiled gradient-recalled echo (FSPGR), 512 x 512 pixels, 0.5-mm slice thickness; (g) FSPGR, 1024 x 1024 pixels, 1.5-mm slice thickness; (h) FSPGR, 512 x 512 pixels, 1.5-mm slice thickness.")
Coronal MR images generated by various sequences and parameters.(a) T1-weighted spin-echo (SE), 320 x 320 pixels, 1.5-mm slice thickness; (b) T1 SE, 320 x 320 pixels, 4-mm slice thickness; (c) T1 SE, 512 x 512 pixels, 1.5-mm slice thickness; (d) Multiplanar gradient-recalled echo (GRE MPGR), 320 x 320 pixels, 1.5-mm slice thickness; (e) GRE MPGR, 512 x 512 pixels, 1.5-mm slice thickness; (f) Fast spoiled gradient-recalled echo (FSPGR), 512 x 512 pixels, 0.5-mm slice thickness; (g) FSPGR, 1024 x 1024 pixels, 1.5-mm slice thickness; (h) FSPGR, 512 x 512 pixels, 1.5-mm slice thickness.
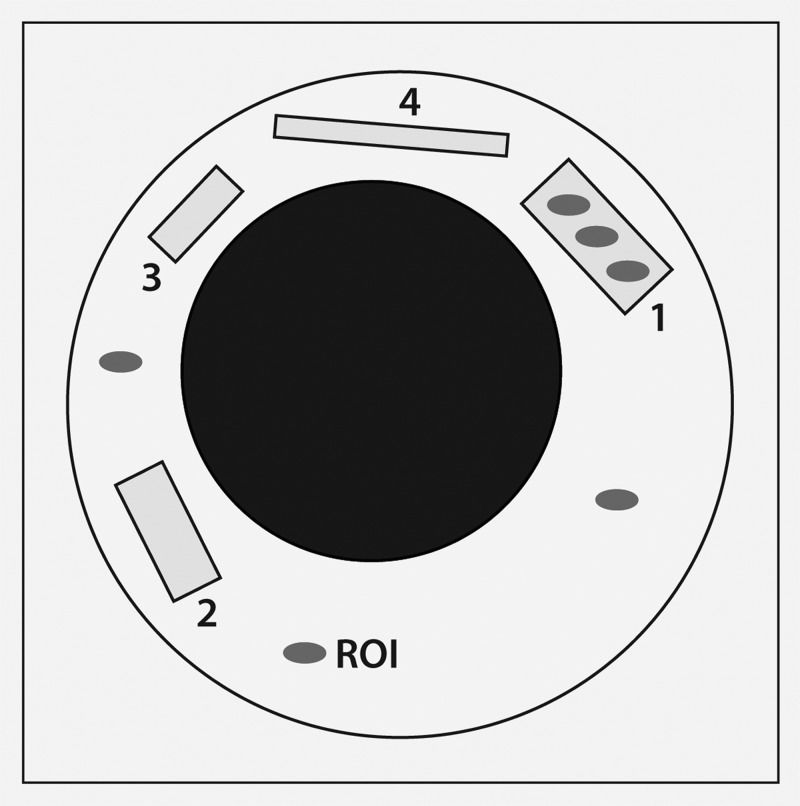
Signal-to-noise ratios (SNRs) were obtained for the MR images of the phantoms using each sequence, as outlined in Table 1. Using the GE Advantage Workstation, three small circular regions of interest (ROIs) (area = 1 mm2) were positioned within each phantom (Figure 3). Due to the small size and shape variations of the phantoms, one large ROI could not be used. The signal intensity (SI, defined as the mean pixel intensity value in a ROI) was recorded for each ROI (three ROIs per phantom) and averaged to yield the mean SI for each phantom. The noise was defined as the standard deviation (SD) in pixel intensity from three small circular ROIs placed in background air (homogeneous area, free from ghosting artifacts) 15. The SNR was calculated as SNR=0.65*(SI/SD), employing a correction factor of 0.65 for background noise (Rician distribution) 16.
 calculation using MR images of phantoms 1-4 embedded in a saline bath. SNR was calculated as SNR=0.65*(signal intensity/standard deviation), employing a correction factor of 0.65 for background noise. The grey ovals represent 1-mm2 regions of interest (ROIs).")
Signal-to-noise ratio (SNR) calculation using MR images of phantoms 1-4 embedded in a saline bath. SNR was calculated as SNR=0.65*(signal intensity/standard deviation), employing a correction factor of 0.65 for background noise. The grey ovals represent 1-mm2 regions of interest (ROIs).
Spatial resolution served as a factor in determining the accuracy of an MRI sequence for measuring maturing cartilage and was calculated as spatial resolution (gross assessment) = field of view/matrix 17.
Statistical AnalysisIntra- and inter-reader reliabilities were examined by calculating differences between the repeated phantom edge measurements within and between readers. The mean and SD of these differences were used to address the issues of variability for the intra- and inter-reader phantom measurements. The intra- and inter-reader reliability for the measurements were assessed using coefficients of variations (CVs). The CVs were calculated as CV = (SD/mean) x 100% and expressed as a percentage to further assess the dispersion of data within and between the readers 18-20. CVs ≤10 indicated an acceptable agreement between the readers in this study, based on previously published CVs from MRI-based measurements of knee cartilage volumes 21-26.
To determine whether the MRI-derived phantom measurements differed significantly from the direct phantom measurements (for different matrices and slice thicknesses), paired t-tests were performed. Bonferroni correction was used to adjust for multiple comparisons, with statistical significance set as alpha ≤.007 for all calculations. Borderline statistically significant differences were considered for p-values >.007 and <.05. All statistical analyses were performed using SAS, version 9.3 (SAS Institute, Cary, NC).
RESULTSDirect Measurements vs. MRI-Derived MeasurementsHigh inter-reader reliability was observed for both the direct phantom measurements, with CVs ranging from 2.50 to 6.40% (average, 4.40%) and for the MRI measurements, with CVs ranging from 0.61 to 7.75% (average, 3.15%). The intra-reader reliability was also high for both the direct and the MRI-derived measurements, with CVs ranging from 0.00 to 6.40% (average, 3.47%) and 0.00 to 6.49% (average, 1.64%), respectively.
Definite differences were noted between the mean direct measurements and the mean MRI-derived measurements for phantom 1 for the GRE MPGR sequence (512 x 512 pixels, 1.5-mm slice thickness, 5:49 min scan time; difference=0.61 mm, p=.007). Borderline statistically significant differences were noted for the TI SE sequences with the following parameters: 320 x 320 pixels, 1.5-mm slice thickness, 6:11 min scan time (difference=0.45 mm, p=.049); 320 x 320 pixels, 4-mm slice thickness, 6:11 min scan time (difference=0.48 mm, p=.02); and 512 x 512 pixels, 1.5-mm slice thickness, 9:48 min scan time (difference=0.48 mm, p=.03). Borderline significant differences were also noted for the FSPGR sequence with 512 x 512 pixels, a 1.5-mm slice thickness, and a 3:36 min scan time (difference=0.40 mm, p=.048). No differences were noted between the mean direct measurements and the mean MRI-derived measurements (p-values>.05 for the different MRI sequences) for phantoms 2, 3 or 4 (Table 1).
Signal-to-Noise Ratio & Spatial ResolutionSNR values were calculated for all the MRI sequences under investigation (Table 2). The SNR values were sufficient and ranged from 8.60 to 90.7, with an average of 32.9. The spatial resolutions (gross assessment) of the MRI sequences were appropriate and ranged from 0.16 to 0.47 (Table 3).
Signal-to-noise ratios for the magnetic resonance imaging sequences employed in this study.
| T1 SE | GRE MPGR | FSPGR | |||||||
|---|---|---|---|---|---|---|---|---|---|
| Matrix (pixels) | 320x320 | 320x320 | 512x512 | 320x320 | 512x512 | 512x512 | 512x512 | 1024x1024 | |
| Slice thickness (mm) | 1.5 | 4 | 1.5 | 4 | 1.5 | 1.5 | 0.5 | 1.5 | |
| SNR | Phantom 1 | 44.4 | 66.5 | 25.8 | 35.0 | 11.7 | 39.2 | 21.7 | 15.4 |
| Phantom 2 | 38.2 | 79.8 | 31.0 | 44.9 | 8.6 | 47.6 | 22.4 | 18.0 | |
| Phantom 3 | 27.0 | 90.7 | 34.1 | 19.2 | 10.0 | 31.9 | 21.1 | 12.3 | |
| Phantom 4 | 33.6 | 84.9 | 33.5 | 23.7 | 9.7 | 36.8 | 20.7 | 14.5 | |
FSPGR fast spoiled gradient-recalled echo, GRE MPGR multiplanar gradient-recalled echo, SNR signal-to-noise ratio, T1 SE T1-weighted spin-echo.
Summary of factors influencing the appropriateness of different MRI sequences for measuring maturing cartilage using phantom 1.
| Pulse sequence | T1 SE | GRE MPGR | FSPGR | |||||
|---|---|---|---|---|---|---|---|---|
| Matrix (pixels) | 320x320 | 320x320 | 512x512 | 320x320 | 512x512 | 512x512 | 512x512 | 1024x1024 |
| Slice thickness (mm) | 1.5 | 4 | 1.5 | 4 | 1.5 | 1.5 | 0.5 | 1.5 |
| FOV (mm) | 150 | 150 | 150 | 150 | 150 | 160 | 160 | 160 |
| Scan time (min) | 6:11 | 6:11 | 9:48 | 3:40 | 5:49 | 3:36 | 3:38 | 10:33 |
| Spatial resolution (mm) | 0.47 | 0.47 | 0.29 | 0.47 | 0.29 | 0.31 | 0.31 | 0.16 |
| p-value | 0.049 | 0.020 | 0.030 | 0.111 | 0.007 | 0.048 | 0.10 | 0.051 |
| SNR | 44.4 | 66.5 | 25.8 | 35.0 | 11.7 | 39.2 | 21.7 | 15.4 |
FOV field of view, FSPGR fast spoiled gradient-recalled echo, GRE MPGR multiplanar gradient-recalled echo, SNR signal-to-noise ratio, T1 SE T1-weighted spin-echo.
The results of the current study show that FSPGR sequences, regardless of the combination of MRI parameters used and the thickness of the cartilage-mimicking structure under assessment, provide accurate measurements. Therefore, when considering feasibility from the perspective of scanning time, the 0.5-mm slice thickness, 512 x 512 pixel, 3:38 min scan appears to be the most appropriate sequence for imaging maturing cartilage. The 512 x 512 pixel, 1.5-mm slice thickness, 5:49 min GRE MPGR sequence and, to a lesser degree, all the T1 SE sequences (regardless of the combination of parameters used) appeared suboptimal for producing accurate measurements of the phantom with the largest width.
To determine the accuracy of an MRI sequence in measuring pediatric articular cartilage, the paradigm of no statistically significant differences (and to a lesser extent no borderline differences) between the mean direct measurements and the mean MRI-derived measurements was taken into consideration, in addition to the SNRs, spatial resolutions and scan times for each given set of parameters.
Finally, it should be noted that the cartilage layers of a maturing skeleton have a similar thickness to the diameters of the phantoms used in this study 27.
Phantom 1Differences between the mean direct measurements and the mean MRI-derived measurements were only observed for phantom 1, the phantom with the largest width. This was the case for all MRI sequences (T1 SE, GRE MPGR and FSPGR) employed in this study, regardless of parameter variations. A possible explanation for this is the limitation imposed by the ruler used, which is only precise to 1 mm (±0.5 mm). Therefore, any direct phantom edge measurement that fell between the 1-mm ruler increments was subjective. Given this fact, all the recorded measurements were rounded to the nearest 1-mm increment, resulting in a measurement error of ±0.5 mm. Thus, we hypothesized that the widths of phantoms 2, 3 and 4 (3.8 mm, 2.1 mm and 1.3 mm, respectively) were too close to the measurement error of ±0.5 mm to allow the readers to obtain accurate direct measurements. Therefore, because phantom 1 (largest width) was the only sample to provide accurate direct measurements of width, only this phantom was used to evaluate the accuracies of the MRI sequences in quantitatively maturing cartilage. The p-values, SNRs, spatial resolutions and scan times associated with phantom 1 are summarized in Table 3.
T1 SEDespite adequate SNR and spatial resolution, the relatively long scan time (compared to the GRE MPGR and FSPGR sequences) and the borderline differences between the MRI-derived measurements and the reference standard measurements observed in this study led us to conclude that using a T1 SE sequence is inappropriate for accurately measuring pediatric articular cartilage in a clinical setting.
GRE MPGROne of the two GRE MPGR sequences tested in this study (512 x 512 pixels, 1.5-mm slice thickness, 5:49 min scan time) appeared to be inappropriate for accurately measuring thin structures due to the significant differences observed between the MRI-derived measurements and the reference standard measurements. The SNR for this sequence was low (for all four phantoms) compared to all other sequences, with values ranging from 8.6 to 11.7 (average, 10). Therefore, noise may have contributed to poor image quality and thus less accurate MRI-derived measurements. Measurements from the other GRE MPGR sequence tested in this study (320 x 320 pixels, 4.0-mm slice thickness, 3:40 min scan time) demonstrated higher CVs and an overall better SNR than the above-referenced GRE MPGR sequence and could be performed faster (Table 3). However, this sequence had poorer spatial resolution (0.47 mm). GRE MPGR sequences are routinely used in clinical practice 28-30.
FSPGRNo significant differences were observed between the direct and MRI-derived measurements for any of the tested FSPGR sequences. Despite its good spatial resolution (0.16 mm), the FSPGR sequence using a 1024 x 1024 pixel resolution, 1.5-mm slice thickness and 10:33 min scan time appeared to be inappropriate for accurately measuring maturing cartilage given its low SNRs (range, 12.3-18.0; average, 15.1) and lengthy scan time. The other two FSPGR sequences, both using 512 x 512 pixel matrices, had comparable scan times and spatial resolutions (Table 3). However, the FSPGR sequence using a 512 x 512 pixel resolution, 0.5-mm slice thickness, and 3:36 min scan time had MRI measurements that were borderline statistically significantly different (p=.048) from the reference standard measurement for phantom 1.
Overall, according to this study, the FSPGR sequence using a 512 x 512 pixel matrix, 0.5-mm slice thickness and 3:38 min scan time appeared to be the most appropriate sequence for accurately measuring the dimensions of pediatric articular cartilage. This sequence had the second shortest scan time compared to the other sequences with similar parameters, making it desirable in a clinical setting. It also had an appropriate SNR and spatial resolution.
Almost two decades ago, a study was published showing that non-fat-suppressed and fat-suppressed fast low angle shot MRI (FLASH) sequences provided the most accurate determinations of the volume and thickness of adult cartilage 10. More recent studies have confirmed this conclusion, stating that the use of FLASH at 1.5 T or 3 T remains the standard for quantifying articular cartilage 31-33. In recent years, double-echo steady-state imaging (DESS) with water excitation has gained interest as an alternate imaging modality for assessing cartilage due to its faster acquisition time and lower achievable slice thickness 34-38. However, it should be noted that DESS is still undergoing validation with regard to its ability to accurately measure cartilage dimensions 39. Other promising sequences for the assessment of cartilage include driven equilibrium Fourier transform (DEFT), which displays greater cartilage-to-fluid contrast than FLASH 40, balanced steady-state free precession (bSSFP) or true fast imaging with steady state (FISP) and its variant, fluctuating equilibrium magnetic resonance (FEMR) 41. Lastly, iterative decomposition of water and fat with echo asymmetry and least squares estimation (IDEAL) in combination with bSSFP demonstrates superior SNR, faster acquisition times and better contrast than FLASH 40. Again, it should be emphasized that quantitative cartilage data have not yet been presented with respect to any of the aforementioned sequences (DESS, DEFT, bSSFP/FISP, and IDEAL) 40. At the time of this writing, FLASH remains the MRI sequence of choice for accurately measuring the thickness and volume of maturing cartilage. This is concordant with the findings from the current study showing that FSPGR was the most appropriate sequence for accurately measuring pediatric cartilage-mimicking phantoms.
Study LimitationsOne limitation of this study was the use of a steel ruler to obtain reference measurements. By using a “regression to the mean” approach 42, we expected to reduce human measurement error in this regard. We preferred to use “human eye” measurements as opposed to a contact-sensing dimension gage such as a micrometer because the mechanical perturbations associated with the use of a micrometer could have damaged the delicate phantoms used in this study. In addition, we preferred to use paired t-test tests with Bonferroni corrections for multi-testing to compare the test and reference standard measurements rather than other methods that account for unequal variances such as Welch's method 43. The rationale for this was the fact that Welch's method is not suitable for paired comparisons and could over-correct the results in a pilot study with a restricted sample size. A limitation inherent in the use of paired t-tests was the assumption that the variances in the distributions of the test measurements and reference standard measurements were equal. As a consequence, one could argue that the results of this study could be unreliable if the variances between the underlying samples varied 43. Another limitation of the study was the fact that the same readers performed measurements of MR images and phantom specimens, which could have prompted recall bias. To avoid such bias, a time interval between reading sessions was established a priori. Finally, although the agar phantoms used in this study may not fully simulate the signal intensity or SNR of maturing cartilage on MRI, it would be extremely challenging to assess the signal intensities of layers of cartilage collected from cadavers of children for ethical reasons and results from animal cadavers would not represent the thickness of maturing cartilage in children.
In conclusion, based on scan time, reference standard comparability and accuracy, FSPGR proved to be the most optimal MRI sequence for measuring maturing cartilage-mimicking phantoms. Further translation of these results into the clinic should be performed to validate them and thus optimize the use of MRI sequences for the assessment of maturing cartilage in the pediatric population.
AUTHOR CONTRIBUTIONSMcKinney JR, Sussman MS, Amirabadi A, Rayner T and Doria AS conceived and designed the study. McKinney JR and Doria AS acquired, analyzed and interpreted the data. Moineddin R performed all statistical analyses of the data. McKinney JR drafted the manuscript. All authors critically reviewed the manuscript for important intellectual content and approved the final version for publication.
This work was presented as a scientific poster at the 2014 Society of Pediatric Radiology Scientific Assembly in Washington, D.C. All funding was derived from internal departmental funds and no external grants were used.
No potential conflict of interest was reported.