


Several studies have confirmed the high potential of the forced oscillation technique for the assessment of respiratory modifications related to chronic obstructive pulmonary disease. However, most of these studies did not employ within-breath analyses of the respiratory system. The aim of this study is to analyze respiratory impedance alterations in different phases of the respiratory cycle of chronic obstructive pulmonary disease patients and to evaluate their clinical use.
METHODS:39 individuals were evaluated, including 20 controls and 19 individuals with chronic obstructive pulmonary disease who experienced severe airway obstruction. We evaluated the mean respiratory impedance (Zm) as well as values for inspiration (Zi) and expiration cycles (Ze), at the beginning of inspiration (Zbi) and expiration (Zbe). The peak-to-peak impedance (Zpp), and the impedance change (ΔZrs) were also analyzed. The clinical usefulness was evaluated by investigating the sensibility, specificity and the area under the receiver operating characteristic curve.
RESULTS:The respiratory impedance increased in individuals with chronic obstructive pulmonary disease in all of the studied parameters (Zm, Zi, Ze, Zbi, Zbe, ΔZrs and Zpp). These changes were inversely associated with spirometric parameters. Higher impedances were observed in the expiratory phase of individuals with chronic obstructive pulmonary disease. All of the studied parameters, except for ΔZrs (area under the receiver operating characteristic <0.8), exhibited high accuracy for clinical use (area under the receiver operating characteristic >0.90; Sensibility ≥ 0.85; Sp ≥ 0.85).
CONCLUSIONS:The respiratory alterations in severe chronic obstructive pulmonary disease may be identified by the increase in respiratory system impedance, which is more evident in the expiratory phase. These results confirm the potential of within-breath analysis of respiratory impedance for the assessment of respiratory modifications related to chronic obstructive pulmonary disease.
Chronic obstructive pulmonary disease (COPD) is a major cause of morbidity and mortality worldwide.1 According to World Health Organization estimates, 80 million people have moderate to severe COPD, and more than 3 million people died of COPD in 2005, which corresponds to 5% of all deaths globally.2
The airway obstruction resulting from COPD is associated with a progressive increase in airflow limitation,1 which is usually evaluated by spirometric tests. However, these tests require good cooperation and maximal effort by the subject. Thus, these tests may be unreliable and variable if sub-optimal maneuvers are performed.3
Forced oscillation technique (FOT) offers a simple, detailed approach for investigating the mechanical properties of the respiratory system. In practice, sinusoidal excitations are superimposed on the subject's spontaneous breathing at the airway opening by a loudspeaker, requiring little patient cooperation.4–6 The resulting oscillations in air flow and pressure are recorded and used to estimate the mechanical impedance of the respiratory system. These features make this technique potentially suitable for the routine evaluation of respiratory function in COPD.7–9
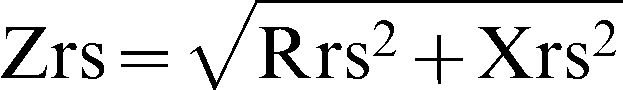
Studies using the FOT often use several excitation frequencies (multifrequency FOT) to obtain an average result from several breathing cycles.5–9 This approach does not allow a detailed, individual analysis of the inspiratory and expiratory phases of the respiratory cycle. Recently, a version of the FOT that uses a single excitation frequency (monofrequency FOT) was developed, and this technique allows within-breath analysis of respiratory mechanics.10 For within-breath analysis, the system evaluates, in real time, the module of the respiratory impedance (Zrs), which is associated with respiratory system resistance (Rrs) and reactance (Xrs) as described in equation 1:

These measurements are related to the total mechanical load provided by the respiratory system. This method has been successfully used to study the fast events associated with sleep apnea10,11 and swallowing.12 Other research groups have obtained promising results using the monofrequency forced oscillation technique (MnFOT) for the detection of expiratory flow limitations in patients with COPD,13,14 investigating physiological recovery from an exacerbation of COPD15 and analyzing responses to deep inhalation in asthmatic children16 and adults.17 A detailed evaluation of the short-term variability of airway caliber in asthma was also recently accomplished using this technique.18,19 Dellacá et al.20 recently used MnFOT to assess response to salbutamol in COPD patients, and Veiga et al.21 obtained promising results using this technique to investigate the pathophysiology of asthmatic patients in the diagnosis of this disease. However, there are limited data reported on the use of respiratory impedance in the analysis of different phases of the breathing cycle22–24 and its use in the diagnosis of COPD. The cited studies were based on an impulse oscillation system, which has some differences from classical FOT, including the data processing and the parameters used to interpret raw data.
The objectives of the present study were the following: (1) to compare the respiratory mechanics of normal individuals and those with COPD, with an emphasis on the differences between phases of the respiratory cycle and (2) using spirometry as a reference technique, to evaluate the ability of MnFOT in the clinical diagnosis of increased airway obstruction in patients with severe COPD.
MATERIALS AND METHODSStudy design and ethical considerationsThe present work is a controlled cross-sectional study that was developed at the State University of Rio de Janeiro. The examinations included spirometry and FOT measurements. These measurements were performed at the Biomedical Instrumentation Laboratory in the Institute of Biology in conjunction with the Pulmonary Function Laboratory at Pedro Ernesto University Hospital. The Research Ethics Committee of this institution approved this study. The objectives of the study were explained to all individuals, and their written consent was obtained before their inclusion in the study.
SubjectsThis study involved volunteers with normal spirometric evaluations who never smoked and patients with COPD from our outpatient clinic. Inclusion criteria for COPD individuals were the following: older than 50 years, being of either sex, having a diagnosis of COPD according to the criteria of GOLD1 and the Brazilian Society of Pneumology and Tisiology,25 and being classified as having accentuated obstructive lung disease according to Jansen.7,26–28 The exclusion criteria were the following: COPD exacerbation occurring less than 90 days previously, the presence of other chronic lung diseases, tuberculosis or pneumonia, the presence of thoracic trauma or surgery, respiratory infections occurring less than 30 days previously and the inability to perform examinations.
The control group consisted of healthy volunteers of both sexes who were older than 50 years with no history of pulmonary disease, cardiovascular disease or smoking. The individuals selected for the control group had normal spirometry results7,26–28 and underwent a clinical examination to observe their general health and the absence of respiratory infections. Baseline data, including age, sex, and height, were obtained from each patient at the time of the test procedures.
Study protocolThe exams were previously scheduled by phone, and the subjects were informed of the need to suspend the use of bronchodilators during the 12 hours that preceded the tests. On the scheduled date, the examination sequence was carried out as follows: the evaluation of clinical history, the collection of anthropometric measurements (age, body weight and height) and risk factors associated with the disease, testing FOT impedance, and, finally, gathering spirometric measurements.
Within-breath respiratory impedance measurementsThe system used for respiratory impedance analysis was developed in our laboratory. It is based on equipment described previously by our group for the study of respiratory disorders during sleep.10,11 Briefly, the instrument applies a single frequency (5 Hz), low pressure (2.0 cmH2O) sinusoidal signal to the subject's respiratory system, which remains under spontaneous ventilation. Pressure (P) and flow (V´') transducers placed near the subject's mouth are used in the measurement of these variables. The resulting signals are recorded by an analog signal processing circuit to perform calculations to obtain the Zrs (Zrs = P/V´') in real time. This variable is known as the impedance module and describes the total mechanical load of the respiratory system, including the effects of resistance and reactance.11,21 The instrument was calibrated by means of a reference mechanical load and, after this, measurement errors were <0.5%.10,11 The system program was developed in the LabView 8.2 environment and permits the control of the beginning and end of the exam as well as the visualization of respiratory impedance alterations that occur during the phases of the breathing cycle.10,11 This allows an easy evaluation of the reproducibility of a patient's impedance values during the tests. We discarded distortions during the recording that were due to artifacts such as coughs or sneezes. Whenever the impedance time series was not considered adequate, the maneuver was not considered valid and was repeated. When correct maneuvers could not be obtained, the volunteers were excluded from the study.
The mechanical alterations during different phases of the respiratory cycle were characterized using the following secondary parameters:
- •
The mean respiratory impedance (Zm), calculated for the complete exam;
- •
The mean impedance during the inspiration cycles (Zi);
- •
The mean impedance during the expiration cycles (Ze);
- •
The mean impedance at the beginning of inspiration (Zbi);
- •
The mean impedance at the beginning of expiration (Zbe);
- •
The peak-to-peak impedance (Zpp), the difference between Zbe and Zbi;
- •
The mean change in the impedance (ΔZrs), the difference between Ze and Zi.
Spirometry tests were performed using a flow spirometer (Micro Medical, model MicroLoop, SP, Brazil). The tests followed procedures recommended by the Brazilian Consensus on Spirometry29 and were performed by a trained technician, as described by the Brazilian Thoracic Society.25 The following parameters were considered:
- •
Forced expiratory volume in one second (FEV1);
- •
Forced vital capacity (FVC);
- •
FEV1/FVC ratio;
- •
Forced expiratory flow between 25-75% of FVC (FEF25-75);
- •
The FEF/FVC.
All parameters were assessed as absolute and percentage values relative to the value predicted for gender, age and height according to Pereira et al.30 and following the criteria established by the American Thoracic Society and European Respiratory Society.31,32 FOT exams were carried out first, and the delay between FOT and spirometric exams was less than thirty minutes.
Sample size and statistical analysisTo estimate the sample size, a pilot study in a group of 20 subjects (10 subjects with COPD and 10 controls) was conducted using a protocol identical to that described above. Based on these preliminary results, the software MedCalc® 8.2 (Medicalc Software Mariakerke, Belgium) was used to calculate the sample size based on the difference between means, assuming type I and type II errors of 1%. The minimum calculated value for this study consisted of 12 individuals for each group.
Data are presented as means±SD. Initially, the characteristics of the samples were evaluated using the Shapiro-Wilk test. Next, depending on the characteristic, we used the independent Student's t test or Mann-Whitney U test to assess differences between-groups and the paired t test and one-way ANOVA analysis for intra-group differences. These analyses were performed using STATISTICA® 5.0 for Windows (StatSoft Inc., Tulsa, USA). Differences were considered statistically significant when p<0.05.
The associations between variables related to spirometry and within-breath respiratory impedance tests were investigated using Pearson's correlation coefficient for the entire group of studied subjects. These tests were carried out using Origin® 6.0 (Microcal Software, MA, USA).
The clinical potential of using FOT indices for the detection of respiratory alterations in patients with COPD was evaluated with receiver operating characteristic (ROC) analyses, which were conducted using MedCalc® 8.2 (Medicalc Software Mariakerke, Belgium).
RESULTSA total of 48 subjects completed the evaluation protocol; of these subjects, 39 had technically satisfactory measurements. Four patients with COPD (17% of the original COPD group) and five controls (20% of the total control group) produced unsatisfactory measurements due to irregular breathing changes during FOT measurements. The anthropometric and spirometric characteristics of the studied subjects are summarized in Table 1. Body weight and BMI values were significantly smaller in the COPD group as compared to the control group (p<0.001) while age and height were similar between these groups. As shown in Table 1, patients with COPD exhibited significant reductions in all of the studied spirometric parameters (p<0.03).
Biometric and spirometric characteristics of the studied subjects.
| COPD (n = 19) | Control (n = 20) | p-value | |
|---|---|---|---|
| M/F | 14/05 | 07/13 | - |
| Age (years) | 71.3±8.1 | 68.3±8.3 | ns |
| Weight (kg) | 56.8±10.4 | 73.5±12.3 | 0.001 |
| Height (m) | 1.60±0.10 | 1.63±0.08 | ns |
| BMI (kg/m2) | 21.90±3.50 | 27.79±4.4 | 0.001 |
| FVC (L) | 2.38±0.8 | 2.89±0.61 | 0.03 |
| FVC (%) | 76.6±21.8 | 94.4±15.42 | 0.005 |
| FEV1 (L) | 0.84±0.28 | 2.33±0.59 | 0.0001 |
| FEV1 (%) | 36.5±11.0 | 97.4±14.64 | 0.0001 |
| FEV1/FVC | 37.3±9.0 | 80.25±6.23 | 0.0001 |
| FEF/FVC | 12.7±6.7 | 78.09±22.23 | 0.0001 |
| FEF25-75 (L) | 0.28±0.1 | 2.31±0.94 | 0.0001 |
| FEF25-75 (%) | 12.2±5.2 | 97.25±28.1 | 0.0001 |
COPD: Chronic Obstructive Pulmonary Disease; n: number of subjects; ns: non-significant;
BMI: body mass index; FEV1: forced expiratory volume in one second; FVC: forced vital capacity; FEF: forced expiratory flow; %: percentage of the predicted value.
Table 2 shows the results obtained from evaluation of respiratory system impedance during the respiratory cycle of patients with COPD as compared to controls. The respiratory impedances were always significantly higher in COPD patients than in the control group (Zm, Zbi, Zi, Zbe and Ze; p<0.001). Similar comparisons revealed that Zpp (p<0.001) and ΔZrs (p<0.005) were significantly increased in patients with COPD.
Comparative analysis between COPD and control subjects considering the impedance in different phases of the ventilatory cycle.
| COPD | Control | p-value | |
|---|---|---|---|
| Zm (cmH2O\L\s) | 10.0±2.8 | 4.6±1.2 | 0.001 |
| Zi (cmH2O\L\s) | 9.0±2.5 | 4.4±1.2 | 0.001 |
| Ze (cmH2O\L\s) | 10.5±3.1 | 4.7±1.3 | 0.001 |
| Zbi (cmH2O\L\s) | 8.1±2.0 | 4.3±1.3 | 0.001 |
| Zbe (cmH2O\L\s) | 11.0±3.1 | 4.8±1.3 | 0.001 |
| Zpp (cmH2O\L\s) | 2.93±2.02 | 0.50±0.74 | 0.001 |
| ΔZrs (cmH2O\L\s) | 1.49±1.65 | 0.27±0.57 | 0.005 |
Zm – Mean impedance of the respiratory system; Zi – inspiratory impedance; Ze – expiratory impedance; Zbi – impedance at the beginning of inspiration; Zbe – impedance at the beginning of expiration. Zpp – peak-to-peak variation of the impedance; ΔZrs – variation of the mean impedance.
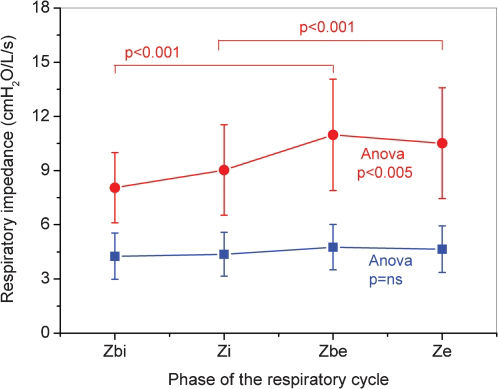
Comparisons of the different respiratory cycle phases in COPD and healthy subjects are shown in Figure 1. The respiratory impedance did not change significantly during the respiratory cycle in the control group (ANOVA, p = ns). Conversely, the Zrs were significantly increased in the COPD group when the cycle from the beginning of the inspiratory phase to the end of the expiratory phase was considered (ANOVA, p<0.005). Figure 1 also shows that Ze was significantly higher than Zi (p<0.001) and Zbe was significantly higher than Zbi (p<0.001) in patients with COPD.
 and healthy subjects (blue lines).")
The associations between FOT and spirometric parameters are described in Table 3. Zm, Zi, Ze, Zbi and Zbe values presented statistically significant inverse correlations with all spirometric parameters. Similar behavior was observed for Zpp and ΔZrs, but Zpp was not associated with FVC (L) and ΔZrs was not associated with FVC (%). When the correlation coefficients are compared, Zm, Zi, Ze, Zbe and Zpp were observed to have a higher association with FEV1 (%),Zbi was more associated with FEF25-75% and ΔZrs was more closely associated with FEV1 (L).
Area under the curve (AUC), sensitivity (Se), specificity (Sp) and cut-off point of the Forced Oscillation parameters.
| AUC | Se (%) | Sp (%) | Cut-off | |
|---|---|---|---|---|
| Zm (cmH2O/L/s) | 0.974(0.86-1.00) | 94.7(73.9-99.1) | 95.0(75.1-99.2) | 6.2 |
| Zi (cmH2O/L/s) | 0.963(0.85-0.99) | 94.7(73.9-99.1) | 90.0(68.3-98.5) | 5.6 |
| Ze (cmH2O/L/s) | 0.976(0.87-1.00) | 100.0(82.2-100.0) | 90.0(68.3-98.5) | 5.7 |
| Zbi (cmH2O/L/s) | 0.958(0.84-0.99) | 94.7(73.9-99.1) | 90.0(68.3-98.5) | 5.4 |
| Zbe (cmH2O/L/s) | 0.971(0.86-1.00) | 94.7(73.9-99.1) | 95(75.1-99.2) | 6.2 |
| Zpp (cmH2O/L/s) | 0.903(0.76-0.97) | 89,5(66.8-98.4) | 85(62.1-96.6) | 1.3 |
| ΔZrs (cmH2O/L/s) | 0.766(0.60-0.89) | 78.9(45.7-88.0) | 78.9(54.4-93.8) | 0.37 |
Values are presented as mean and confidence interval (95%); Zm – mean impedance of the respiratory system; Zi – inspiratory impedance; Ze – expiratory impedance; Zbi – impedance at the beginning of inspiration; Zbe – impedance at the beginning of expiration. Zpp – peak-to-peak variation of the impedance; ΔZrs – variation of the mean impedance.
Table 4 summarizes the results for the evaluation of the clinical potential of the studied indices. Six of the seven studied parameters presented AUC ≥ 0.9.
Pearson correlation coefficient (r), and p-value (p) between FOT and spirometry.
| Zm(cmH2O/L/s) | Zi(cmH2O/L/s) | Ze(cmH2O/L/s) | Zbi(cmH2O/L/s) | Zbe(cmH2O/L/s) | Zpp(cmH2O/L/s) | ΔZrs(cmH2O/L/s) | |
|---|---|---|---|---|---|---|---|
| FVC (L) | r -0.57 | -0.53 | -0.57 | -0.56 | -0.48 | -0.25 | -0.40 |
| p 0.001 | 0.001 | 0.001 | 0.001 | 0.002 | 0.1 | 0.02 | |
| FVC (%) | r -0.59 | -0.59 | -0.56 | -0.55 | -0.54 | -0.38 | -0.20 |
| p 0.001 | 0.001 | 0.001 | 0.001 | 0.001 | 0.02 | 0.2 | |
| FEV1 (L) | r -0.77 | -0.74 | -0.77 | -0.75 | -0.76 | -0.56 | -0.50 |
| p 0.001 | 0.001 | 0.001 | 0.001 | 0.001 | 0.001 | 0.002 | |
| FEV1 (%) | r -0.79 | -0.78 | -0.78 | 0.75 | -0.80 | -0.63 | -0.40 |
| p 0.001 | 0.001 | 0.001 | 0.001 | 0.001 | 0.001 | 0.02 | |
| FEV1/FVC | r -0.71 | -0.69 | -0.71 | -0.69 | -0.74 | -0.60 | -0.40 |
| p 0.001 | 0.001 | 0.001 | 0.001 | 0.001 | 0.001 | 0.02 | |
| FEF/FVC | r -0.74 | -0.72 | -0.75 | -0.74 | -0.76 | -0.57 | -0.46 |
| p 0.001 | 0.001 | 0.001 | 0.001 | 0.001 | 0.001 | 0.004 | |
| FEF25-75 (L) | r -0.73 | -0.70 | -0.74 | -0.72 | -0.74 | -0.54 | -0.46 |
| p 0.001 | 0.001 | 0.001 | 0.001 | 0.001 | 0.001 | 0.004 | |
| FEF25-75 (%) | r -0.78 | -0.76 | -0.77 | -0.76 | -0.78 | -0.60 | -0.40 |
| p 0.001 | 0.001 | 0.001 | 0.001 | 0.001 | 0.001 | 0.01 |
In this study, we observed that severe COPD may be identified by the increase in within-breath respiratory system impedance. Our data suggested that this is more evident in the expiratory phase, and confirms the clinical potential of within-breath impedance analysis for the diagnosis of respiratory modifications related to COPD.
Twenty percent of the initial control group and 17% of the initial group of patients with COPD were excluded from the study due to inadequate FOT measurements. This percentile values may be associated with a characteristic of this sample of volunteers, because these volunteers do not presented experience with FOT. Individuals comprising the group of patients with COPD had body mass and BMI values that were smaller than those in the control group (Table 1). This difference is likely due to the clinical condition of these patients, who suffer from advanced COPD. The alterations in routine lung function parameters in COPD patients were consistent with the presence of severe airway obstruction,1,32 leading to decreased spirometric results (Table 1). An FEV1/FVC ratio below 70% indicates the presence of airflow obstruction,1,32 while an FEV1(%) below 50% indicates the presence of severe obstructive ventilatory insufficiency,1,33 The FVC was reduced in these patients, indicating the presence of a predominantly obstructive process with probable pulmonary hyperinsuflation.34
In this study, we evaluated the respiratory system impedance module, which is associated with the resistive and reactive properties of the entire respiratory system, including the lung and chest wall.4–6 COPD is characterized by the presence of airway wall inflammation, and the consequent reduction in bronchial and bronchiolar quality, as well as mucus hypersecretion, results in airway obstruction.1,7 These factors, alone or associated, are responsible for increased airway resistance. In addition to the increased resistance observed in COPD, a decrease in dynamic compliance is also present. This decrease may be explained using the concept of a “choke point”, introduced by Dellacà et al.,13 and describes the difficulty that the oscillatory signals emitted by the FOT encounter when crossing segments of the bronchial tree; this difficulty is associated with increased small airway resistance.35 This event induces a fall in the dynamic compliance and a consequent increase in the impedance module. Consistent with this theory, all of the analyzed parameters were significantly increased in COPD subjects (Table 2). The observed changes in Zm describe the increase in respiratory work associated with the previously mentioned changes.
In a previous study, Clement et al.36 investigated the behavior of Rrs and Xrs in individuals with and without airway obstruction. These authors associated higher values of Rrs and Xrs with increased degrees of airway obstruction, findings that were associated with the pathophysiological progression of COPD. Van Noord et al.37 evaluated the respiratory system resistance of 125 individuals with severe airway obstruction using the FOT at 6 Hz. The authors observed increased resistance values in patients with COPD as compared to healthy subjects. The increase in Rrs due to COPD was also demonstrated by Zerah et al.,9 who studied the effect of a bronchodilator using multifrequency FOT. According to these authors, this resistance pattern, which is consistent with the lower FEV1 values identified in this population, is associated with the presence of airway obstruction and consequent non-homogeneous lung capacity. The study conducted by Farré et al.38 evaluated respiratory impedance in mechanically ventilated COPD patients. Rrs and Xrs curves showed that resistance values increased and that reactance values were more negative, which are consistent with our results (Table 2, Figure 1). By analyzing the mechanical changes in the respiratory system resulting from increased levels of airway obstruction in COPD, Di Mango et al.7 also found that resistance values were increased and that reactance values were more negative. Other characteristics may contribute to the presence of higher Zm values, such as reductions in the homogeneity of the lung time constants.7,13,27,39 Based on equation (1), the increase in Zm observed in our study (Table 2) as well as the significant inverse correlations between Zm and spirometric parameters (Table 3) are consistent with these previously published results23,24,39 and physiological aspects of COPD.1,35
In the present study, subjects with COPD exhibited higher impedance in all phases of the ventilatory cycle when compared to control subjects (Table 2; Figure 1). The advanced stage of COPD observed in our patients is associated with peribronchial fibrosis and consequent airway tissue remodeling. Thus, this reduced airway compliance may introduce more negative Xrs, contributing to higher Zrs (equation (1)). Higher values of inspiratory and expiratory impedances were also observed by Cavalcanti et al.21 in their comparison between asthmatic and healthy subjects using methodology similar to that used in this paper. One possible contributing factor for these results is the recruitment of accessory muscles in COPD subjects due to impaired diaphragmatic mechanics. In COPD, the change in the tidal volume operating point favors lung hyperinflation, reducing the efficiency of the diaphragm as a pump and inducing the use of accessory muscles. Because respiratory impedance measurements include the influence of the chest wall, we believe that abnormal accessory muscle contraction during inspiration may contribute to the increased Zi in our patients.
The Zrs values observed throughout the respiratory cycle were similar in both groups (Figure 1); Zrs values increased from the beginning of inspiration to expiration. Paredi et al.22 observed only minimal changes in Rrs and Xrs values between inspiration and expiration in normal individuals. Consistent with these results, we observed only non-significant changes in Zrs in healthy subjects (Figure 1). However, patients with COPD showed significant changes in Zrs among the phases of the respiratory cycle (Figure 1; p<0.005). Consistent with the results obtained by Dellacà et al.13 and Johnson et al.,15 Zrs values were higher during expiration than inspiration in patients with COPD.
Analysis of Zrs during expiration has been used to establish the presence of expiratory flow limitation (EFL).13,15 During EFL events, increased Zrs values are observed. In this context, Zbe and Ze are expected to be higher than Zbi and Zi in patients with COPD. The results described in Figure 1 indicate that EFL may be a significant component affecting respiratory impedance in the studied subjects.
Using an impulse oscillation system, Paredi et al.22 investigated whether oscillometric indices differ between patients with asthma and patients with COPD. Consistent with the results of the present work, these authors observed that expiratory reactances at 5 Hz were significantly less than inspiratory reactances in patients with COPD. These results are also consistent with those recently described by Kubota et al.23 and Kanda et al.24
The control subjects exhibited minimal variations in ΔZrs and Zpp (Table 2, Figure 1), which are consistent with previous studies.13–15,24 Conversely, Table 2 shows that COPD subjects experienced significant increases in ΔZrs and Zpp. Previous authors have also observed more substantial expiratory-inspiratory differences in patients with COPD than in healthy subjects.22–24
In our understanding as well as that of other authors,40,41 the behavior of Zrs throughout the respiratory cycle in patients with COPD is a controversial topic with several unclear components of the pathophysiology. Further studies are needed to improve our understanding, e.g., concerning the effects of a process dominated by emphysema (elastic changes) or chronic bronchitis (obstructive changes).
Zm, Zi, Ze, Zbi and Zbe were significantly and inversely associated with FEV1 and FVC (Table 3), which link these impedance parameters with airway obstruction and pulmonary volume reductions. Notably, the highest coefficient of determination was observed between FEV1 (%) and Zbe, whereas weaker associations were observed when Zpp and ΔZrs were considered.
Johnson and colleagues39 compared Rrs and Xrs at 5 Hz with pulmonary resistance (RL), as assessed by the use of an esophageal balloon. Their results indicated that these parameters can be used as predictors of RL. In this case, the greatest advantage of FOT from the perspective of clinical application lies in the fact that the evaluation of Rrs and Xrs by FOT does not involve the use of an invasive procedure, which is necessary for the evaluation of RL with an esophageal balloon. These authors highlighted the strong potential of this approach for scientific and clinical application of real-time assessment of Rrs and Xrs and suggested that the clinical use of these parameters should be systematically evaluated.39
To contribute in this direction, ROC curves were elaborated. According to the literature, ROC curves with AUCs between 0.50 and 0.70 indicate low diagnostic accuracy, AUCs between 0.70 and 0.90 indicate moderate diagnostic accuracy, and AUCs between 0.90 and 1.00 indicate high diagnostic accuracy.42,43 An AUC>0.80 is usually considered to be adequate for clinical use.42,43 Thus, AUC values for Zm, Zi, Ze, Zbi, Zbe and Zpp represented highly accurate measurements (Table 4). However, ΔZrs values do not attain adequate values for clinical use. Under these conditions, Ze was the most suitable for correctly identifying the effects of COPD, with a sensitivity of 100% and a specificity of 90%. These promising results are consistent with those obtained previously21,44 and suggest that the Zrs observed in different phases of the respiratory cycle may be useful in the detection of COPD.
When the results of the present study are compared with those obtained in a previous study our group conducted in asthmatic subjects,21 both studies were found to provide similar results with AUCs above 0.9, indicating high diagnostic accuracy. The AUC values determined in these studies are superior to those obtained in previous studies using multifrequency FOT that were performed in patients with COPD45 (maximum AUCs of 0.85), in asthmatic patients27 (maximum AUCs of 0.88), and in patients with sarcoidosis28 (maximum AUCs of 0.84). Thus, our results confirm the hypothesis that monofrequency FOT can attain higher diagnostic accuracy than its corresponding multifrequency counterpart.21
There are three potential limitations in the present study. First, it is important to note that the description of sensitivity, specificity and accuracy is dependent on the population studied, and that the present work was conducted in patients with severe airway obstruction. Studies in patients with mild and moderate airflow obstruction are still necessary to confirm this hypothesis.
The second possible limitation is that the reproducibility of the FOT measures was not evaluated in our patients with COPD. Dellacà et al.46 recently evaluated the reproducibility of within breath respiratory resistance during home monitoring. These authors showed a discrepancy of resistance of 0.10±0.01 cmH2O/L/s in COPD patients, and pointed out that FOT yields accurate and reproducible data in COPD patients. Therefore, the lack of reproducibility evaluation probably is not a problem in the present study.
The third possible limitation is that, in order to evaluate the contribution of the MnFOT in the diagnosis of COPD, we performed a study using spirometry as a reference. One could argue that a comparison between these methods would also be useful. In fact, our research group recently performed this comparison in groups of smokers with very interesting results. FOT parameters were more accurate than spirometric indices to identify small alterations due to smoking,44,47 while in patients with higher tobacco consumption, the diagnostic performance of the FOT was similar to that observed in spirometry.44 These studies were conducted using multifrequency FOT. However, in the present paper, the spirometry is used as a reference technique, and therefore we cannot make a direct comparison between spirometry and FOT. In the previously cited papers,44,47 we compared these two techniques using the amount of tobacco consumption (pack-years) as a reference. Thus, although it is a really intriguing question, we cannot evaluate it in the present paper.
Individuals with COPD and severe airway obstruction present respiratory impedances higher than those observed in healthy individuals in all phases of the respiratory cycle. Thus, the impedance changes observed in individuals with COPD reflect the high mechanical load imposed on the respiratory system of these patients, and these changes are consistent with the pathophysiology of the disease. These patients experience higher impedances in the expiratory phase than in the inspiratory phase, indicating that expiratory flow limitation may play a significant role in severe COPD. Several of the studied parameters demonstrated high accuracy for the diagnosis of COPD. These results indicate that the evaluation of respiratory impedance in different phases of the respiratory cycle may be a promising clinical diagnostic tool, representing an alternative and/or complementary technique to other conventional exams used to clinically evaluate patients with COPD.
No potential conflict of interest was reported.
Silva KKD conducted the measurements for this study, analyzed the data, and drafted the manuscript. Lopes AJ provided data and subject identification. Jansen JM, mentored Silva KKD and participated in data analysis process. Melo PL mentored Silva KKD organized the study and helped to draft the manuscript. All authors have read and approved this manuscript.