


Transcranial Direct Current Stimulation (tDCS) has emerged as a promising tool for enhancing social cognition. The posterior cerebellum, which is part of the mentalizing network, has been implicated in social processes. In our combined tDCS-fMRI study, we investigated the effects of offline anodal cerebellar tDCS on activation in the cerebellum during social action prediction. Forty-one participants were randomly assigned to receive either anodal (2 mA) or sham (0 mA) stimulation over the midline of the posterior cerebellum for 20 min. Twenty minutes post stimulation, participants underwent a functional MRI scan to complete a social action prediction task, during which they had to correctly order randomly presented sentences that described either actions of social agents (based on their personality traits) or events of objects (based on their characteristics). As hypothesized, our results revealed that participants who received anodal cerebellar tDCS exhibited increased activation in the posterior cerebellar Crus 2 and lobule IX, and in key cerebral mentalizing areas, including the medial prefrontal cortex, temporo-parietal junction, and precuneus. Contrary to our hypotheses, participants who received anodal stimulation demonstrated faster responses to non-social objects compared to social agents, while sham participants showed no significant differences. We did not find a significant relationship between electric field magnitude, neural activation and behavioral outcomes. These findings suggest that tDCS targeting the posterior cerebellum selectively enhances activation in social mentalizing areas, while only facilitating behavioral performance of non-social material, perhaps because of a ceiling effect due to familiarity with social processing.
The cerebellum, traditionally known for its role in motor coordination and control (Ito, 2008), has recently been implicated in a range of cognitive and affective functions, including social functions related to mentalizing (Van Overwalle et al., 2015; Van Overwalle et al., 2014). Mentalizing refers to the human ability to process and interpret social cues to infer other persons’ mental states such as intentions, preferences and traits (Atique et al., 2011; Molenberghs et al., 2016; Schurz et al., 2014a; Van Overwalle, 2009). As human beings, we mentalize constantly, using this information to anticipate and predict what may happen next in social interactions and our life (Molinari & Masciullo, 2019). Mentalizing is supported by the mentalizing network which involves the larger part of the default mode network (Andrews-Hanna et al., 2014; Spreng & Andrews-Hanna, 2015). The mentalizing network consists of key areas in the cerebral cortex, including the temporo-parietal junction (TPJ), which plays a role in temporarily switching attention and processing to other persons’ current mental states, and the medial prefrontal cortex (mPFC), which is responsible for making stable inferences, such as their Past research on the mentalizing network has been typically focused on the cerebral cortex (Schurz et al., 2014b; Van Overwalle, 2009). Recently, a number of meta-analyses (Metoki et al., 2022; Van Overwalle et al., 2015; Van Overwalle et al., 2014, 2020), have suggested that posterior areas of the cerebellum are also involved in mentalizing.
The cerebellum is traditionally known for fine-tuning and automatizing motor behavior. Over the last decade, growing evidence has suggested that this brain area is also involved in affective (Schmahmann, 2010) and social behavior (Van Overwalle et al., 2015; Van Overwalle et al., 2014). For instance, the sequence detection hypothesis (Leggio & Molinari, 2015) suggests that the cerebellum identifies and encodes motor and non-motor sequences, to facilitate automatization of these sequences in order to anticipate upcoming behaviors, including anticipation of others’ social behaviors and mentalizing about it (Van Overwalle et al., 2019; Van Overwalle et al., 2021). The detection of social sequences and our ability to make predictions about social behavior and mentalizing allow us to have smooth and efficient social interactions. Inferring others’ personality traits is particularly helpful in predicting our interactions with others (Hassabis et al., 2014). For example, if we have learned that our neighbor is a friendly person that waves and shouts ‘good morning’ every time we go to work, we would expect and predict that our neighbor will generally interact with us in a similarly friendly way in future.
Within the cerebellum, posterior areas, and specifically cerebellar Crus 1, 2 and lobule IX have been associated with these social sequencing and prediction processes that require mentalizing. Neurological studies have found that cerebellar Crus 1 and 2 were preferentially recruited when we have to memorize sequences of higher-order traits (Pu et al., 2020), beliefs (Heleven et al., 2019; Ma et al., 2021) and goal-directed social navigation (Li et al., 2021, 2024) in comparison to conditions that did not explicitly require sequencing or involved non-social events (cf. meta-analysis by Van Overwalle et al. (2020) Importantly, Crus 1, 2 and lobule IX were also preferentially recruited when making predictions about upcoming actions based on known traits (Haihambo et al., 2022), intentions (Haihambo et al., 2023) and preferences of others (Haihambo et al., 2023) in comparison with non-sequential and non-social conditions. Together these studies suggest that the posterior cerebellum plays a key role in sequencing, mentalizing and future oriented thinking.
The cerebellum is essential for efficient social interactions. A number of clinical studies have linked structural and functional impairments in the cerebellum with psychiatric and neurological disorders which include social difficulties, such as autism spectrum disorder (Stoodley, 2014), schizophrenia (Andreasen & Pierson, 2008) and other clinical pathologies (Van Overwalle et al., 2021). Studies including cerebellar patients have used mentalizing tasks in which sequences of social actions play a critical role. A typical example is the Picture Sequencing task in which participants are presented with cartoon-like drawings of events and required to put these pictures in the correct chronological order (Heleven & Van Overwalle, 2019). Cerebellar patients were found to have difficulties correctly ordering social events that required mentalizing (e.g., inferring what someone may believe), but performed equally well as neurotypical participants on routine social scripts (e.g., going to the supermarket) and mechanical events (e.g., a car accident; (Van Overwalle et al., 2019). Although these clinical studies highlight the sequencing role of the cerebellum when mentalizing is required, the causal role of the posterior cerebellar Crus 1 & 2 in predicting future behavior is still unclear and not much understood.
One way to investigate a causal impact of the posterior cerebellum is by manipulating brain excitability, such as through transcranial direct current stimulation (Morya et al., 2019) targeting that area. tDCS is a non-invasive brain stimulation technique that modulates neural activity by applying a weak electrical current to the scalp. Although much of the current is shunned by the scalp and skull, a significant portion of the current does reach the targeted brain area (Datta et al., 2013), creating an electric field that modulates electrical activity in this area (Truong et al., 2020). It is proposed that anodal stimulation could increase neural excitability (Bikson et al., 2016). Previous studies have found that tDCS can be applied to the cerebellum in both healthy and pathological brains (Ferrucci et al., 2015; Grimaldi et al., 2014; van Dun et al., 2016), and that applying tDCS on the cerebellum could have a beneficial impact on behavioral performance on a variety of tasks such as movement (Galea et al., 2009), working memory (Pope & Miall, 2012; Sheu et al., 2019), language processing (Lesage et al., 2012) and processing social actions (Oldrati et al., 2021) and mental state recognition (Clausi et al., 2022). Notably, however, a previous study from our lab did not find modulatory effects of cerebellar stimulation on social sequencing. For example, (Catoira et al., 2023; Ma et al., 2023) delivered anodal tDCS on the posterior cerebellum, while participants performed a Belief Serial Response Time task, in which participants had to infer the beliefs of two protagonists and implicitly learned a hidden repeated trial sequence. However, the results did not reveal significant differences between anodal and sham groups on social performance, but it did show faster response times on a non-social cognitive control condition (Catoira et al., 2023; Ma et al., 2023). This lack of social performance effects might have been due to the high familiarity of social mentalizing for the healthy participants, resulting in a ceiling effect. These somewhat conflicting results could also be due to differences in tDCS montage setups and parameters, or differences in task type and task difficulty (Rice et al., 2021), as well as baseline behavioral performance (Caulfield et al., 2020, 2020; Joshi et al., 2023; Khan et al., 2022, 2023; Splittgerber et al., 2020) or brain activity (Splittgerber et al., 2020), which may impact outcomes. Nonetheless, while these studies give us insight into potential benefits and limitations of tDCS on behavioral outcomes, they leave open the question of how tDCS modulates neural activation and behavioral performance.
To answer this question, tDCS has previously been combined with fMRI in a number of task-based studies, where fMRI is used to measure differences in activation (i.e., BOLD signal) as a result of active tDCS (e.g., anodal) versus sham tDCS. For example, in the language domain, tDCS-fMRI studies found that anodal cerebellar tDCS improved performance on language prediction and, importantly, increased activation in language areas in the cerebellum and altered resting state functional connectivity between and within cerebellar and cerebral language areas (D'Mello et al., 2017; Rice et al., 2021). On the other hand, in the social mentalizing domain, a tDCS-fMRI study that used the Picture Sequencing task found a decrease in cerebellar and TPJ activation following anodal cerebellar tDCS (Catoira et al., 2023), even though a previous fMRI study without tDCS found robust posterior cerebellar activation on the same task (Heleven et al., 2019). These effects found by Catoira et al. (2023) could be due to the specific montage used, where anodal and cathodal electrodes were placed at the opposite hemispheres of the posterior cerebellum, or due to the fact that tDCS was conducted in the scanner. In general, previous tDCS studies have demonstrated high variability in outcomes, which could be due to significant intraindividual differences of tDCS stimulation (Li et al., 2015), and inter-subject variability in the electric fields induced by tDCS due to physiological differences, such as differences in skull and tissue thickness (Laakso et al., 2015). Together these findings highlight that further research that combines tDCS and fMRI is needed to better understand the effects of cerebellar tDCS on social understanding and processing. Moreover, as far as we are aware, no combined tDCS-fMRI study has yet investigated how exciting the brain using anodal tDCS could modulate social prediction and neural activation.
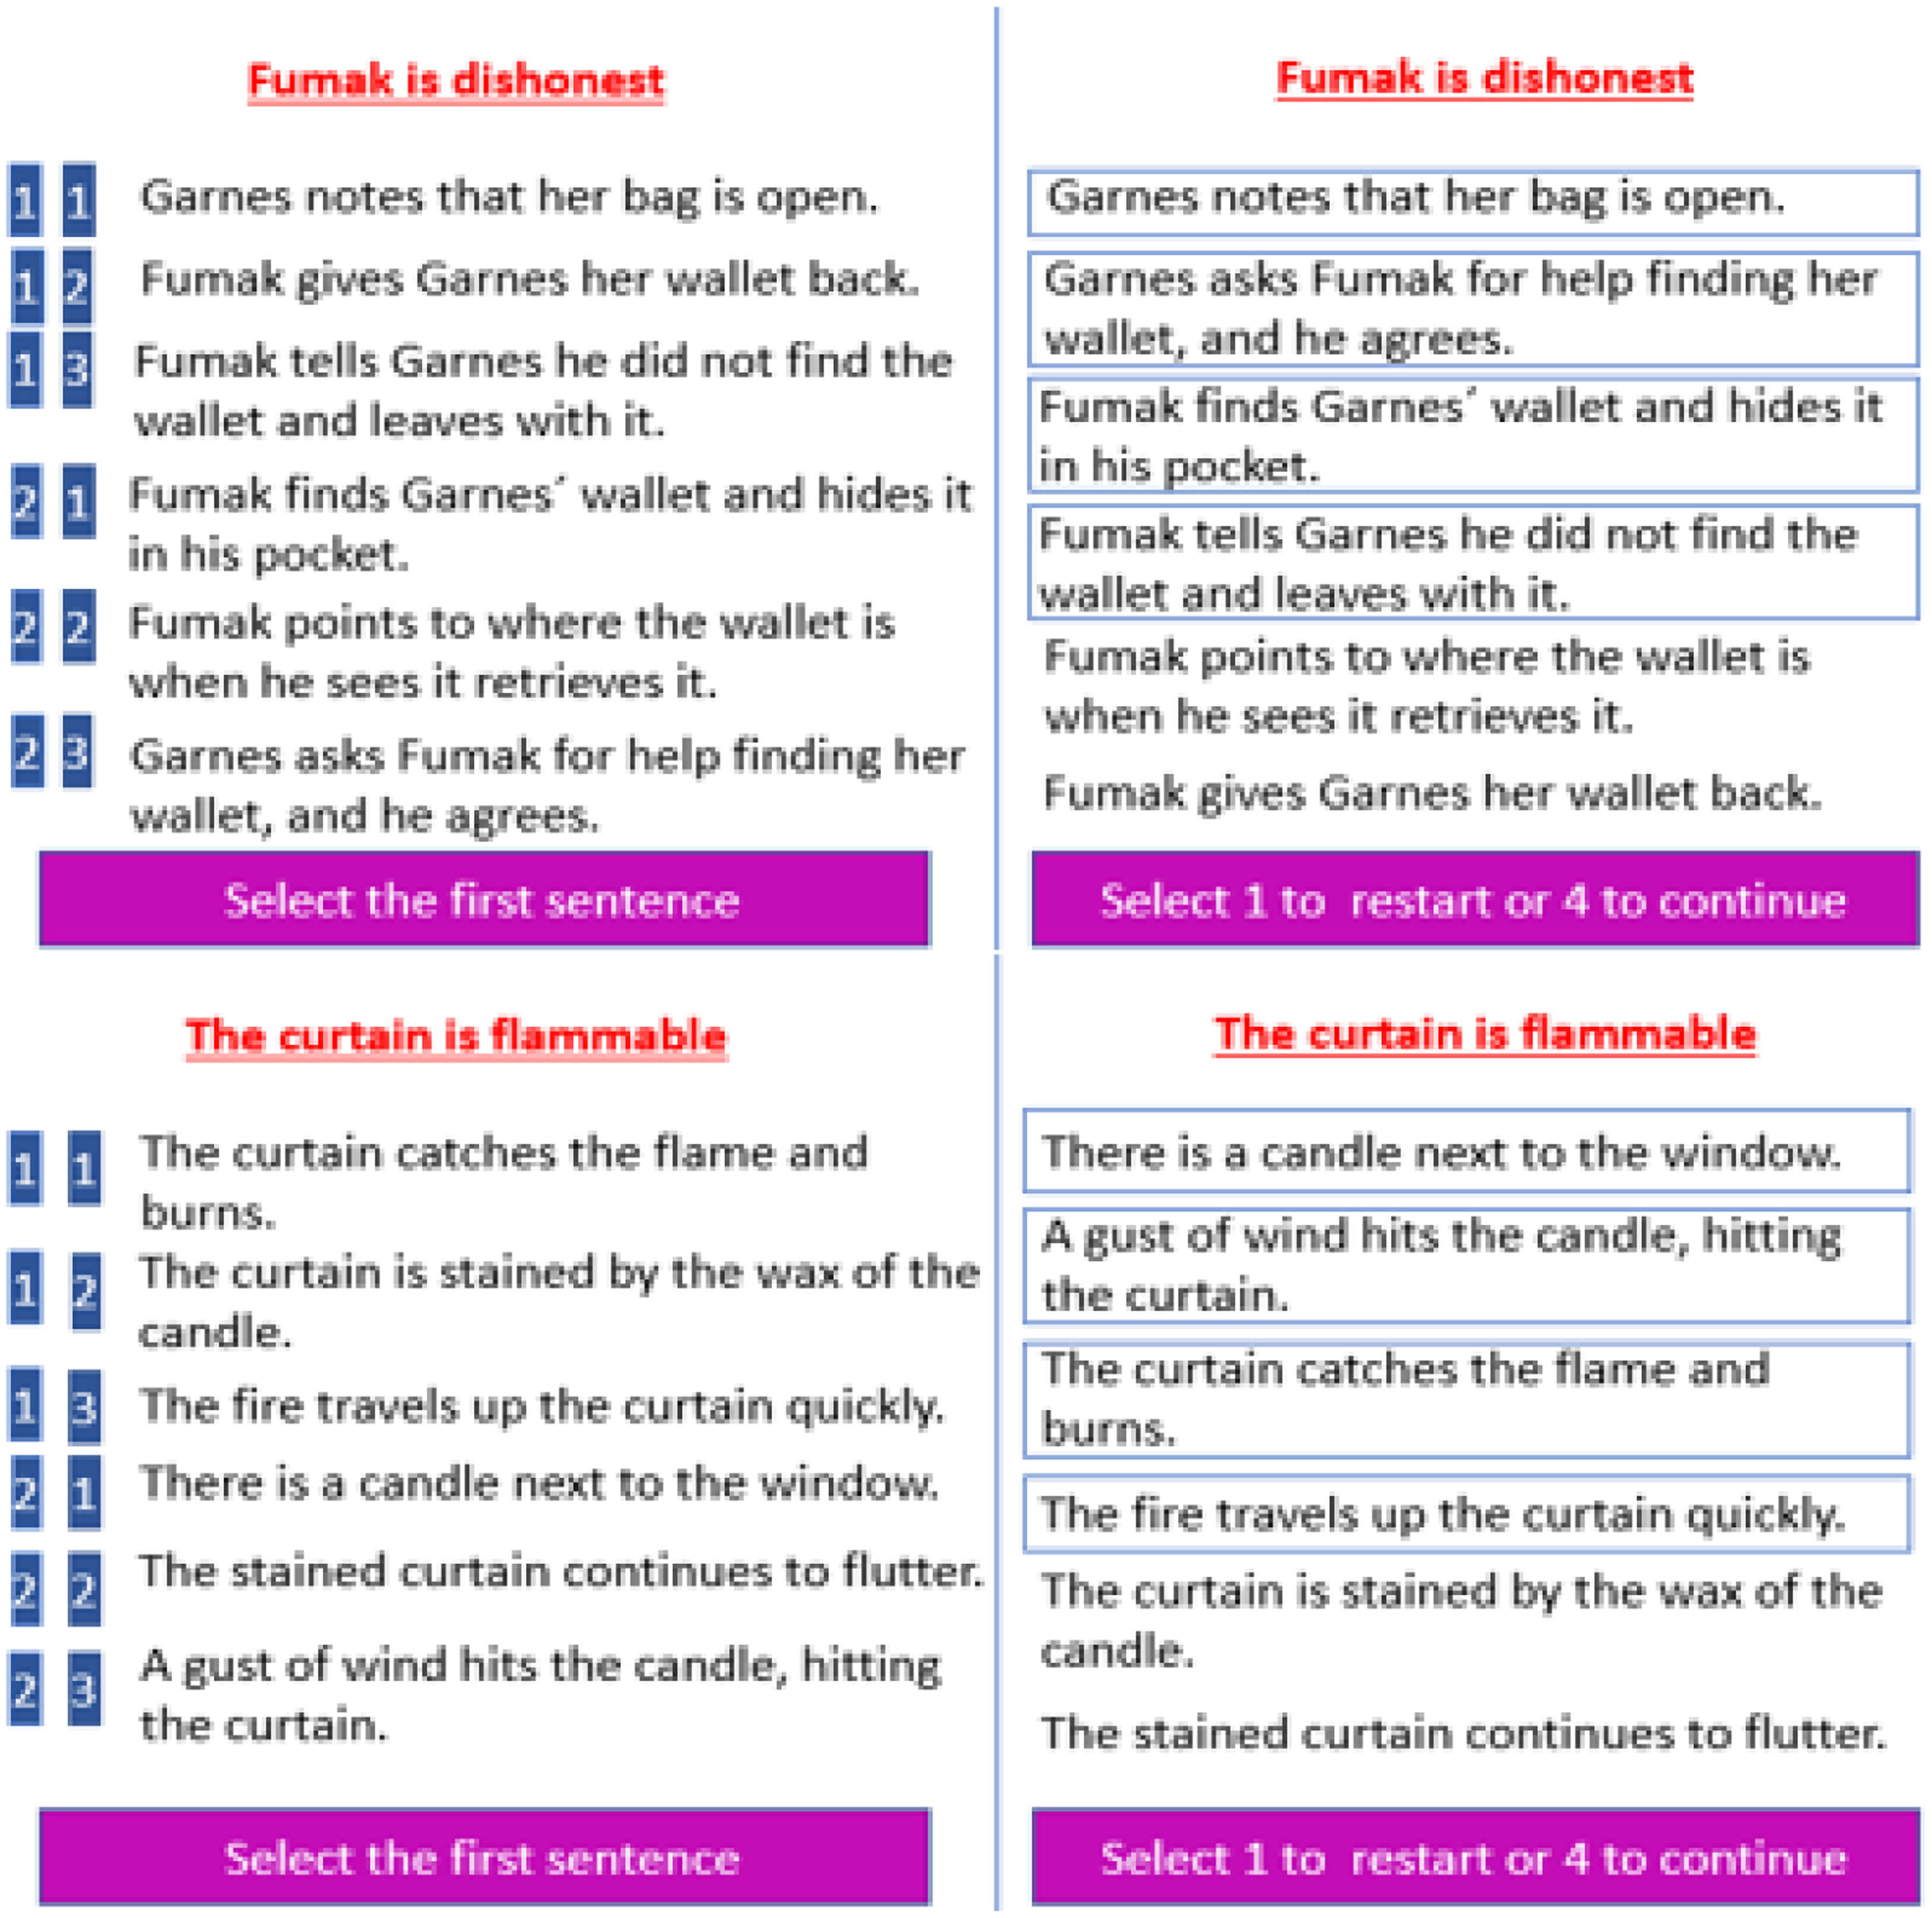
Present studyTo investigate the causal role of the cerebellum in social prediction, we conducted a combined tDCS-fMRI study involving social prediction based on information about someone's personality trait. The present study is based on an earlier fMRI study without tDCS, where participants were asked to predict social actions based on traits (Haihambo et al., 2022). In this study, participants were first given the trait of a protagonist (e.g., Fumak is dishonest; Fig. 1). Afterwards, they had to select four out of six possible actions that would depict actions consistent with the trait and put them in the correct chronological order. To verify that sequencing and social mentalizing were important components of posterior cerebellar activation, several control conditions were added involving a Selection-only task that did not involve generating a sequence and a Non-social task (i.e., with and without generating a sequence) involving objects and their characteristics (e.g., a light feather). We found that cerebellar Crus 1 / 2 and lobule IX, along with key mentalizing cerebral areas in the temporoparietal junction (TPJ) and medial profrontal cortex (mPFC), were robustly recruited during the prediction of social action sequences in comparison with the Selection-only and Non-social control conditions.
 and Non-social sequencing (bottom panel) conditions, adopted from Haihambo et al. (2022). Left Panel: Participants were presented six action sentences (randomly ordered) and were required to select the four sentences that fit best with the person trait / object feature, and to order them in the correct order (ignoring the trait-inconsistent sentences) using two consecutive button presses on the far left on a four-button response box (with responses indicated on a blue background). Right Panel: The ordering as chosen by a participant (the selected four sentences were ordered from top to bottom and marked by blue squares surrounding them).")
Illustration of a trial from the Social Sequencing (top panel) and Non-social sequencing (bottom panel) conditions, adopted from Haihambo et al. (2022). Left Panel: Participants were presented six action sentences (randomly ordered) and were required to select the four sentences that fit best with the person trait / object feature, and to order them in the correct order (ignoring the trait-inconsistent sentences) using two consecutive button presses on the far left on a four-button response box (with responses indicated on a blue background). Right Panel: The ordering as chosen by a participant (the selected four sentences were ordered from top to bottom and marked by blue squares surrounding them).
The present study followed the same procedure, but additionally, in this between participant design, participants were randomly assigned to either an anodal or sham stimulation group. In the anodal group, participants received anodal tDCS at 2 mA for 20 min over the midline of the cerebellum to stimulate the bilateral posterior cerebellum. In the sham treatment group, stimulation was ramped up to 2 mA in 30 s and then slowly ramped down to 0 mA in 30 s, and maintained at 0 mA for the remaining 19 min Fig. 3. We opted for offline stimulation to avoid potential artifacts from having the tDCS device in the scanner. Exactly 20 min after stimulation, participants in both groups performed the trait prediction task in the scanner. Our choice for a between-participant design was motivated by (a) the reduction of experimental duration aiming to minimize participant fatigue, (b) uncertainty regarding the effectiveness of a washout period in nullifying cerebellar tDCS effects between conditions, and (c) the elimination of a second experimental session which minimizes dropout. We hypothesized that anodal stimulation would specifically enhance neural activation and behavioral outcomes during social sequencing compared to the sham group. Specifically, we predicted that there would be more cerebellar Crus 1, 2 and lobule IX activation as well as improved performance (faster and/or more accurate responses) for the Anodal group in the prediction condition where social actions had to be put in the correct chronological sequences (i.e., Social Sequencing condition), compared to all other Non-Social and Selection-only control conditions in this group, as well as compared to all conditions in the Sham group. Since previous studies have found that anodal cerebellar tDCS may modulate activation in brain regions that are functionally associated with the cerebellum (Catoira et al., 2023; D'Mello et al., 2017), we expect modulation in cerebral mentalizing areas. However, we are uncertain which areas would be affected and whether activation would be enhanced or suppressed. Moreover, there might be individual differences in the extent to which tDCS might induce electric changes in the cerebellum. Therefore, we also estimated the electric field magnitude induced by tDCS. We predicted that the improved performance and higher activation in the Anodal Social Sequencing condition would be driven by higher electric field resulting from cerebellar tDCS.
MethodParticipantsParticipants in this study were 42 healthy, right-handed, Dutch-speaking volunteers (10 males: mean age 26 years, SD = 3 years). All participants had normal or corrected-to-normal vision and reported no neurological or psychiatric disorders. The study was approved by the Medical Ethics Committee at the Gent University Hospital, Belgium, where the study was conducted, and informed consent was obtained following these guidelines. Participants were given 20 euros and reimbursed for transportation costs in exchange for their participation. Participants were randomly allocated into an active anodal stimulation group (N = 22; 6 males) or a sham stimulation group (N = 19; 4 males). Originally, there were 50 participants for fMRI scanning and tDCS. However, 9 participants’ data could not be included (Sham = 6; Anodal = 3): From the sham group, 4 participants did not complete the task due to reported discomfort in the scanner, and 2 participants had data files that were corrupted. From the anodal group, due to technical difficulties, 3 participants had a total time between stimulation and task initiation which exceeded 20 min (i.e., 35 – 45 min between stimulation and task initiation), and were therefore excluded. This sample size was determined based on earlier tDCS-fMRI studies (Catoira et al., 2023; D'Mello et al., 2017; Rice et al., 2021).
Stimulus materialThe present study used identical stimulus material from our previous trait-prediction task (Haihambo et al., 2022). In brief, participants were presented with a fictitious main agent and his/her trait (e.g., Fumak is dishonest), along with six socially interactive trait-implying sentences. We used fictional Star-Trek like names, to avoid using names of persons that were familiar to the participants. Participants had to infer what the agent would do based on the trait information provided.
In the Social condition, each trial consisted of a set of six trait-implying sentences describing interactions between two agents (the target agent whose trait was presented and another agent). Of these six action sentences, two were neutral, two consistent, and two inconsistent with respect to the target person's trait. In the Non-social control condition, participants were presented with an object and its characteristic (e.g., the curtain is flammable) along with six sentences, of which two were neutral, two consistent, and two inconsistent with respect to the object's characteristic. Across these two conditions, the structure of the sentence sets was generally identical, with the exception that the Social conditions included social agents performing social actions, whereas the Non-social conditions included non-social objects in a cause-and-effect scenario with the environment.
Task procedureThe procedure used in this study is identical to our previous trait-prediction study (Haihambo et al., 2022). Specifically, participants were informed that there would be two tasks in the experiment: Sequencing and Selection-only.
In the Sequencing task (see Fig. 1), on each trial, participants were first shown a trait of one agent (Social condition) or a characteristic of one object (Non-social condition). The agents and their trait (or the objects and their characteristic) appeared in red on the top of the screen and remained there for the duration of that trial. After 1000 ms, six sentences were shown on the screen one-by-one for 1300 ms each, in a random order for each participant and for each trial. After reading, all sentences were shown together on screen.
In the Sequencing task, participants were instructed to “select only the four sentences that fit the trait of the person or characteristic of the object and put them in the correct chronological order”. They were further told to execute “this task correctly and as quickly as possible. Your time is measured from the presentation of the event until you indicate that you are ready.” Participants selected the sentences using two consecutive button presses on a four-button response box with their left hand. This was practiced outside the scanner so that participants were familiar with this response procedure before scanning. To continue or cancel (i.e., redo the ordering of the sentences), they had to press a button at the end of that trial, by selecting button “1 to restart or 4 to continue”. At the end of the trial, participants were asked “How confident are you about your answer?“ and they answered with a button press on the response box using a 4-point scale ranging from 1 = not at all to 4 = very much. All trials and confidence ratings were preceded by a blank screen with a fixation cross, jittered randomly between 1- 2 s. The confidence ratings were not further analyzed.
The procedure was identical in the Selection-only task, with the following exceptions. Participants were told that “the sentences are now already put in the correct order”, and that they only had to “select the four sentences that fit the trait of the person or characteristic of the object” without generating the correct order. The sentences were not presented in a random order, but in their correct order, that is, with a pair of trait-neutral sentences presented first, followed by a pair of consistent and a pair of inconsistent sentences presented together in the middle or last position (randomly determined for each trial). Thus, while in the Sequencing task, inconsistent sentences could appear at all positions 1 – 6, in the Selection-only task, they appeared only at positions 3 – 6. Participants had to only select one pair sentences out of the two consistent and inconsistent pairs, that fitted the person trait or object characteristic. Sentences were presented for 1100 (instead of 1300 ms in the Sequencing task), because participants needed less time as they did not need to memorize and plan the order of sentences.
Before stimulation, participants were exposed to one simplified practice trial per task to familiarize themselves with the task and task procedure on a Windows 10 computer using the number keypad. This was done to make sure that participants understood the instructions and task under the fMRI scanner. We provided this practice trial before stimulation, in order to make the interval between stimulation and scanning as short as possible. Additionally, during functional MRI scanning, participants read the instructions and practiced the response presses on the MRI four button response box, using sentences that were not part of the fMRI experiment, to make sure they understood how to make a selection and order the sentences. All experimental tasks outside and inside the scanner was presented in E-Prime 3.0 (www.pstnet.com/eprime; Psychology Software Tools), running on a Windows 10 and Windows XP computer respectively.
In total, participants completed 44 trials, each consisting of 6 sentences that differed across all conditions. Each Sequencing or Selection-only task consisted of 11 Social and 11 Non-social trials, or 22 trials in total per task. Participants first received the Sequencing task, after which they received the Selection-only task. This was done so that participants were not primed with the correct structure of already ordered sentences in the Sequencing task. For each task, the social and non-social trials (i.e., sentence sets) were presented in a random order for each participant.
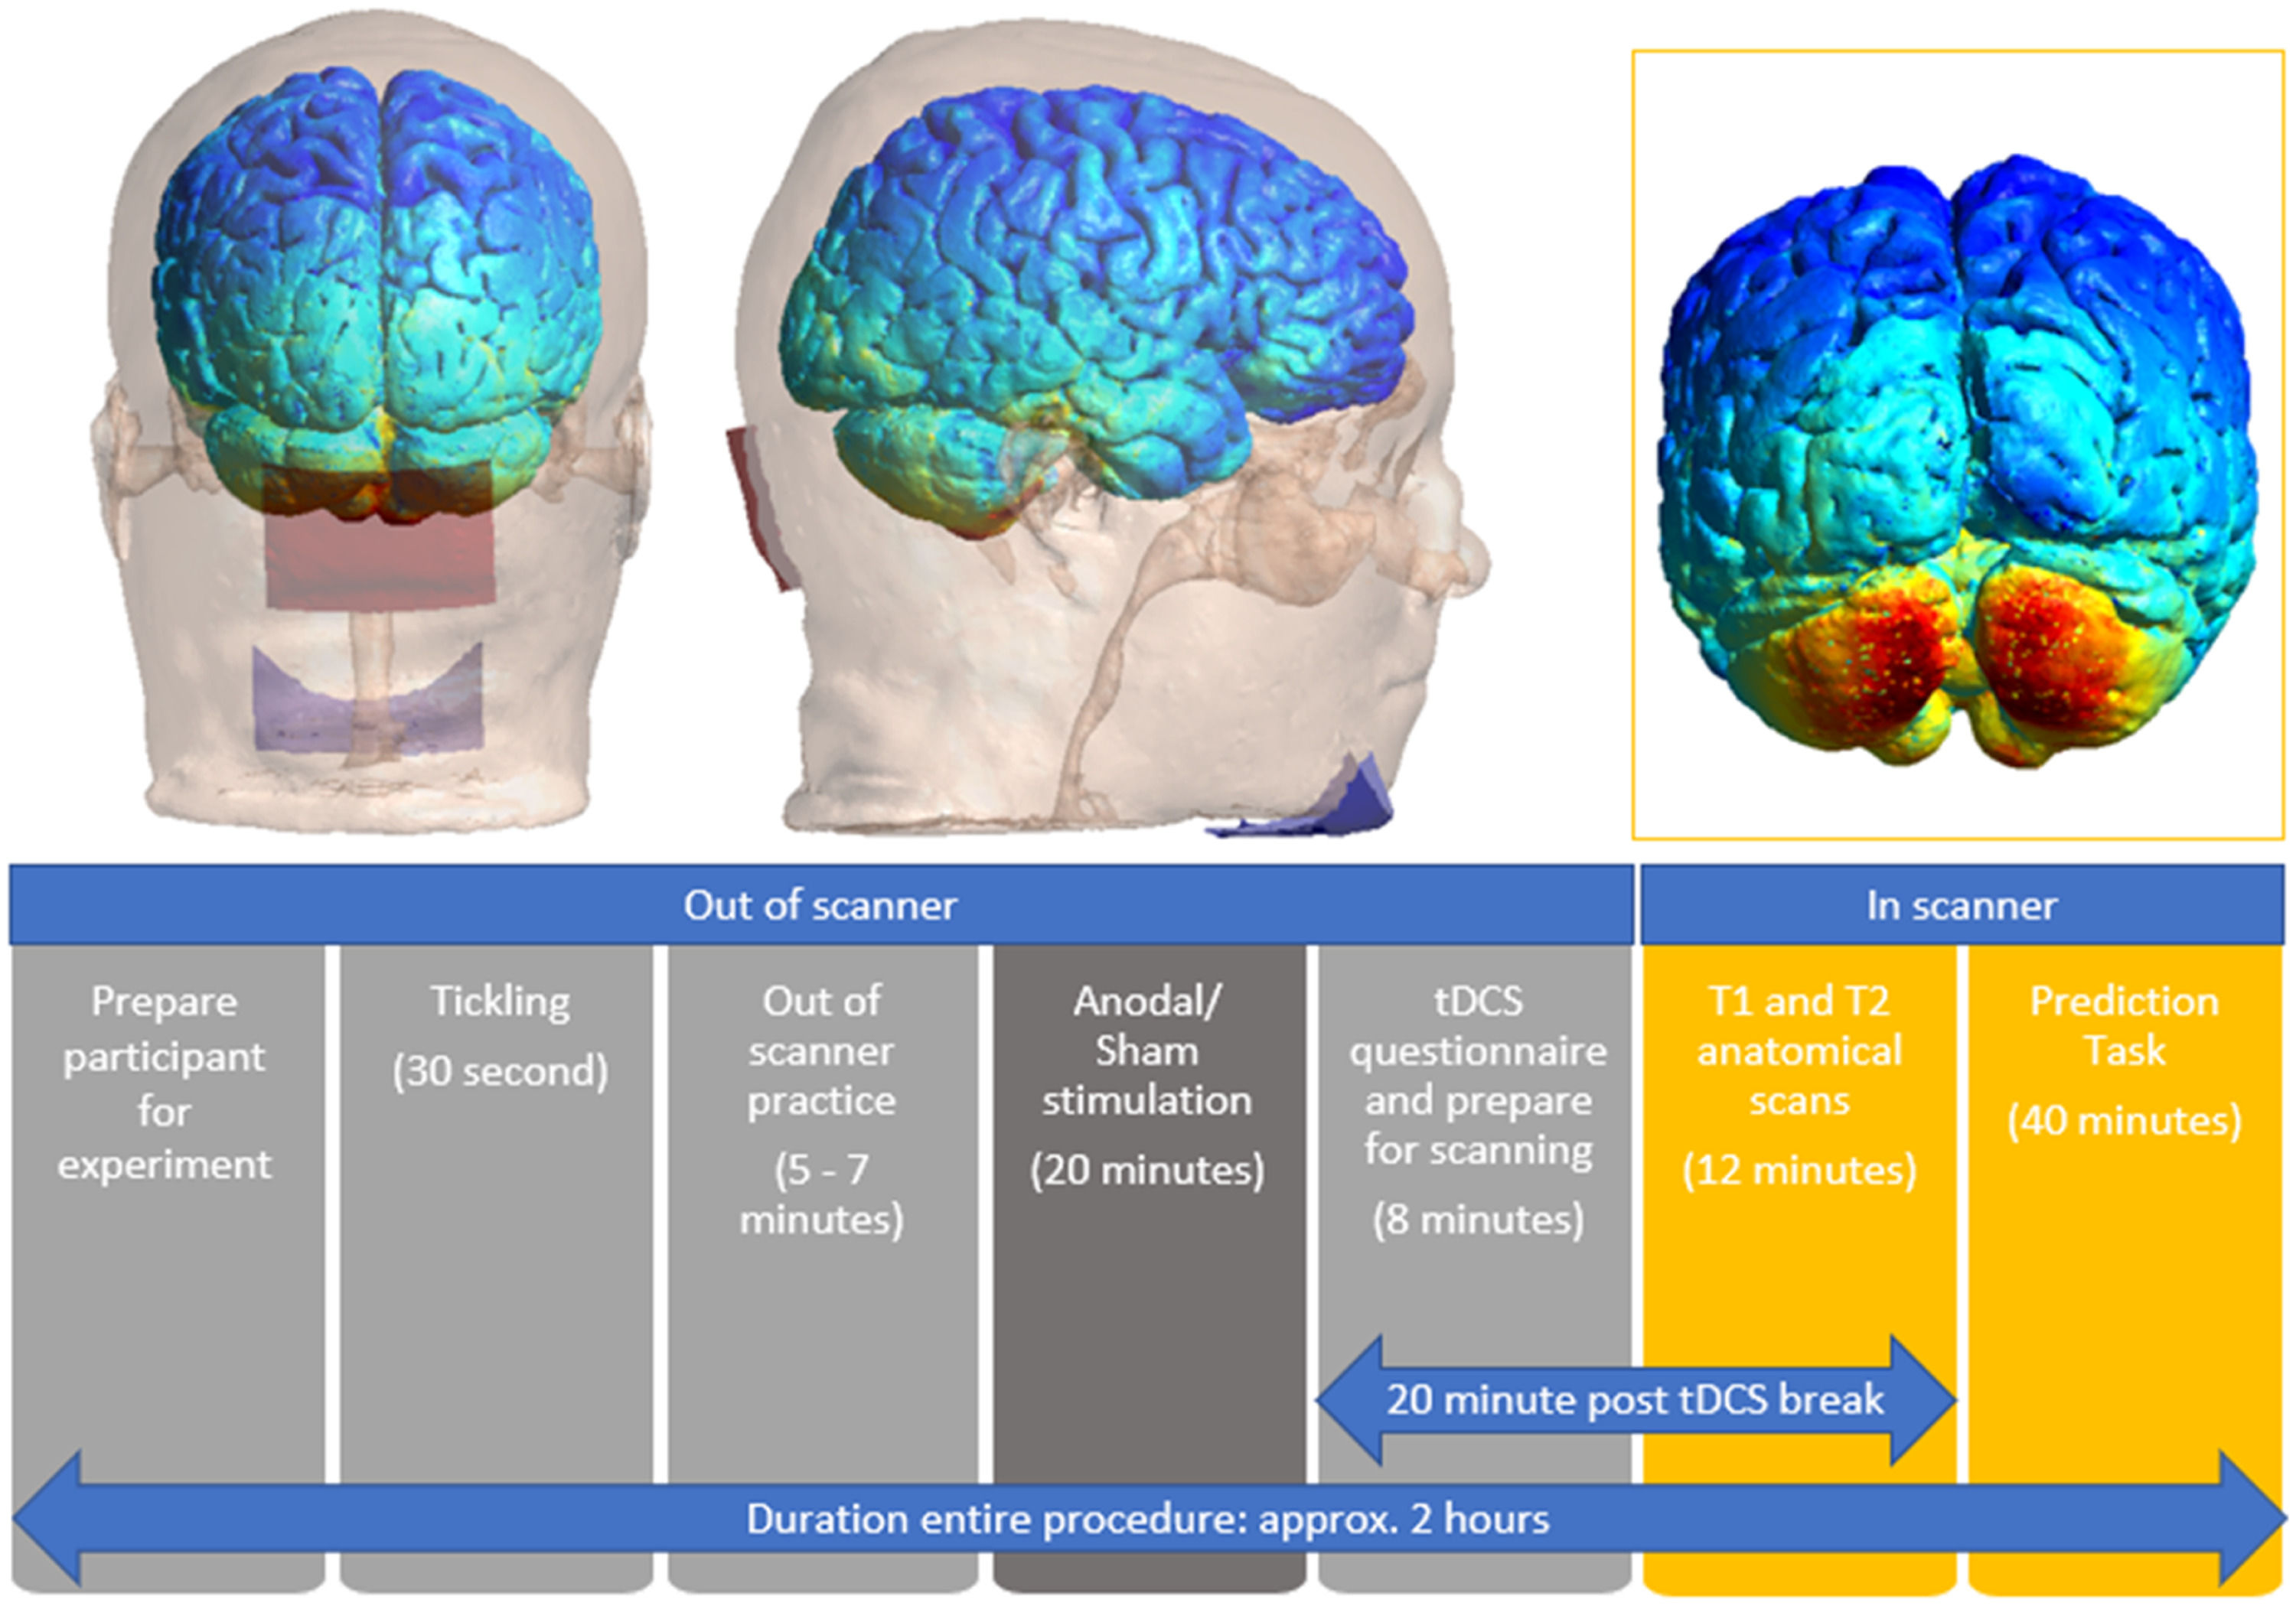
Cerebellar tDCS protocol and processingA Soterix Medical 1 × 1 tDCS Low-Intensity Stimulator was used to deliver cerebellar tDCS via round rubber (50 mm diameter) electrodes embedded in a pair of rectangular saline-soaked synthetic sponges (5 × 7 cm) to stimulate the whole cerebellum (Ferrucci et al., 2015). A number of studies that stimulated the bilateral cerebellum have centered the active (anodal or cathodal) electrode on the median line 2 cm below the inion and with the reference electrode on the shoulder (e.g., Ferrucci, 2008, 2012). Others have placed both the active and reference electrode laterally on the cerebellum (Catoira et al., 2023), but as noted earlier, this lead to inhibitory effects. A more novel approach has placed the electrodes on the right cerebellum and the reference electrode on the chin (Guiomar et al., 2022), and his montage showed more focal and higher electric current in the target region. Applying this latter approach, to stimulate the bilateral cerebellum, we placed the anodal electrode horizontally on the midline of the cerebellum 2 cm below the inion, and the reference electrode horizontally on the chin. Both electrodes were secured with rubber straps. We first simulated this montage on Ernie in SimNIBS (version 3.2.1; (Thielscher et al., 2015)), and found that it stimulated the bilateral (posteromedial) cerebellum, at the same location where we found activation in our previous fMRI study (Haihambo et al., 2022).
In terms of stimulation parameters, we used a current intensity of 2 mA for 20 min for the anodal stimulation and 0 mA for 20 min for sham stimulation (Ferrucci et al., 2008, 2012). We first delivered a 30 second tickling to all participants, so that they could have an understanding of what to expect. If they could tolerate the stimulation, for the anodal stimulation, the current intensity was slowly ramped up from 0 to 2 mA in 30 s, then this current intensity was maintained for 20 min, and then ramped down from 2 mA to 0 in 30 s. For the sham stimulation, the current intensity was slowly ramped up from 0 to 2 mA and then slowly ramped down to 0 mA in one minute. After 20 min, this slow ramping-up and ramping-down of the current intensity was applied again. We used a self-report questionnaire to assess side effects from the tDCS intervention (Brunoni et al., 2011), which included the 10 most common complaints (headache, neck pain, scalp pain, tingling, itching, burning sensation, skin redness, sleepiness, trouble concentrating, acute mood changes). Responses on each item asked participants “Do you experience any of the following symptoms or side-effects?” and required participants to respond on a 4-point scale (1 = absent, 2 = mild, 3 = moderate, 4 = severe). Importantly, participants in both groups reported experiencing tingling, itching, and sleepiness, with no discernible differences between the two groups.
Next, 20 min after stimulation, participants started the trait prediction task in the scanner (Oldrati et al., 2021). This period was used for preparation for the scanner (including filling out the Dutch adverse tDCS effects questionnaire). We opted for offline tDCS as it is the most commonly employed procedure in cerebellar tDCS studies (van Dun et al., 2016) and can be applied very easily in combination with fMRI.
Imaging procedure and pre-processingThe imaging procedure and pre-processing analyses were identical to the original fMRI study (Haihambo et al., 2022). Images were collected with a Siemens Magnetom Prisma fit scanner system (Siemens Medical Systems, Erlangen, Germany) using a 64-channel radiofrequency head coil. Stimuli were projected onto a screen at the end of the magnet bore, which participants viewed by way of a mirror mounted on the head coil. Participants were placed headfirst and supine in the scanner bore and were instructed not to move their heads to avoid motion artifacts. Foam cushions were placed within the head coil to minimize head movements. First, high-resolution anatomical images were acquired using a T1-weighted 3D MPRAGE sequence [repetition time (TR) = 2250 ms, echo time (TE) = 4.18 ms, inversion time (TI) = 900 ms, field of view (FOV) = 256 mm, flip angle = 9°, voxel size = 1 × 1 × 1 mm]. Second, high resolution isotrophic T2-weighted images in the sagittal plane were acquired [TR = 3200 ms, TE = 408 ms, FOV = 230 mm, voxel size = 0.9 × 0.9 × 0.9 mm]. Third, a fieldmap was calculated to correct for inhomogeneities in the magnetic field (Cusack & Papadakis, 2002). Fourth, whole brain functional images were collected in a single run using a T2*-weighted gradient echo sequence, sensitive to blood oxygen level dependent (BOLD) contrast [TR = 1000 ms, TE = 31.0 ms, FOV = 210 mm, flip angle = 52°, slice thickness = 2.5 mm, distance factor = 0 %, voxel size = 2.5 × 2.5 × 2.5 mm, 56 axial slices, acceleration factor GeneRalized Autocalibrating Partial Parallel Acquisition (GRAPPA) = 4].
SPM12 (Wellcome Department of Cognitive Neurology, London, UK) was used to process and analyze the fMRI data. To remove sources of noise and artifact, data were preprocessed. Functional data was corrected for differences in acquisition time between slices for each whole-brain volume, realigned to correct for head movement, and co-registered with each participant's anatomical data. Then, the functional data was transformed into a standard anatomical space (2 mm isotropic voxels) based on the ICBM152 brain template (Montreal Neurological Institute). Normalized data was then spatially smoothed (6 mm full width at half-maximum, FWHM) using a Gaussian Kernel. Finally, using the Artifact Detection Tool (ART; http://web.mit.edu/swg/art/art.pdf; http://www.nitrc.org/projects/artifact_detect), the data was examined for excessive motion artifacts and for correlations between motion and experimental design, and between global mean signal and experimental design. Outliers were identified in the temporal differences series by assessing between-scan differences (Z-threshold: 3.0 mm, scan to scan movement threshold: 0.5 mm; rotation threshold: 0.02 radians). These outliers were “omitted” from the analysis by including a single regressor for each outlier. A default high-pass filter was used of 128 s and serial correlations were accounted for by the default auto-regressive (AR) model.
Statistical analysis of neuroimaging dataThe statistical analysis of the neuroimaging data follows the same procedure as in the original fMRI publication (Haihambo et al., 2022). At the first (single participant) level, for each task, the event-related design was modelled for each of the four conditions (i.e., Social Sequencing, Social Selection-only, Non-social Sequencing, Non-social Selection-only). The onset of each trial was set after all six sentences were presented together on screen and the prompt to select or sequence the sentences appeared. The presentation of each sentence was not included in this timing, as this was relatively short, so that little time was left for anything else other than reading. Hence, although participants could start eliminating inconsistent sentences as soon as they saw one sentence, properly sequencing the sentences was only possible after all sentences were carefully read. Based on considerations of how response processes might have evolved during a trial and our aim to select equivalent timings for fMRI analysis across conditions, duration was set from the onset of the trial (i.e., when the prompt sentence appeared) until the time participants made their final selection (i.e., selection of four sentences reflecting the presented trait in the Sequencing and the Selection-only tasks) and pressed the “continue” button. This timing reflects the same process across the two tasks. All trials were analyzed, irrespective of whether selection or sequencing was correct, because we assumed that participants’ selection and sequencing was based on what they believed to be correct. When a trial was canceled and redone, analysis was performed on the responses and timing of the final sentence selection.
For contrasts between the Anodal and Sham groups, we applied the Sandwich Estimator (SwE) toolbox (Guillaume et al., 2014a; http://www.nisox.org/Software/SwE/). SwE uses a marginal model to analyze repeated measurements between tasks, taking into account correlations because of repeated measurements, unexplained variations across participants, unbalanced study designs of the variable number of scans, and corrected degrees of freedom. We modeled eight covariates in SwE with group (Anodal versus Sham) as a between-participant factor. We used the following default SwE options (see http://www.nisox.org/Software/SwE/man): a modified SwE, which assumes that participants in each task share a common covariance matrix, repeated measurements in each within-factor regressor, small-sample adjustment type C2, and degrees of freedom approximation III. The contrasts between tasks were analyzed using a cluster-forming threshold of p < 0.005 with minimum cluster extent of 50 voxels, followed by a voxel level significance of p < 0.05, using false-discovery rate (FDR) correction for multiple comparisons (Fleming et al., 2019; Guillaume et al., 2014).
We used SwE to investigate the effects of anodal stimulation on brain activity during different cognitive conditions. We first ran main contrasts to examine the effects of stimulation on activation by directly comparing the anodal and sham groups. We then looked at simple contrasts for each condition (e.g., Anodal vs. Sham) for all conditions (Social Sequencing, Social Selection-only, Non-social Sequencing, Non-social Selection-only).
Importantly, we used an asymmetric (or spreading) interaction analysis similar to (Ma et al., 2021) to test our hypothesis that anodal stimulation would increase activity in cerebellar and cerebral mentalizing regions only during Social Sequencing. To test selectivity for social processes during anodal stimulation, we used an asymmetric interaction analysis with Non-social as a control condition, expressed as Anodal Social Sequencing > [Anodal Non-social Sequencing = Sham Social Sequencing = Sham Non-social Sequencing] by using the respective weights: 3 −1 −1 −1, and the reverse contrast (i.e., with reversed < sign). To test selectivity for sequencing during anodal stimulation, we also ran an asymmetric interaction with Non-sequencing as a control condition, expressed as Anodal Social Sequencing > [Anodal Social Selection-only = Sham Social Sequencing = Sham Social selection-only] by using the respective weights: 3 −1 −1 −1, and the reverse contrast (i.e., with reversed < sign). The contrasts in SwE were analyzed using a cluster-forming threshold of p < 0.005 with minimum cluster extent of 50 voxels, followed by a voxel level significance of p < 0.05, using false-discovery rate (FDR) correction for multiple comparisons (Fleming et al., 2019; Guillaume et al., 2014b).
In addition to the whole-brain analysis, we tested our hypotheses more directly by performing a Region of Interest (ROI) analysis, using spheres of 5 mm centered on a priori MNI coordinates for the bilateral cerebellar Crus 1 and 2 (±40 −70 −40 and ±24 − 76 − 40 respectively; (Van Overwalle & Ma et al., 2020). For lobule IX, we used the average peak coordinates from our previous activation studies (0 −52 −40; (Haihambo et al., 2022). Additionally, we included cerebral mentalizing area coordinates for the mPFC (0 50 20), dmPFC (0 50 35), vmPFC (0 50 5), TPJ (±50 −55 25) and precuneus (0 −60 10) from meta-analyses on social cognition (Van Overwalle, 2009; Van Overwalle & Baetens, 2009)(Van Overwalle, 2009; Van Overwalle & Baetens, 2009)(Van Overwalle, 2009; Van Overwalle & Baetens, 2009)(Van Overwalle, 2009; Van Overwalle & Baetens, 2009) using spheres of 8 mm. ROI analyses were done using a small volume (rather than whole-brain volume) correction for multiple comparisons with the same thresholds as the whole-brain analysis.
Statistical analysis of behavioral dataThe statistical analysis of the behavioral data follows the same procedure as in the original fMRI publication (Haihambo et al., 2022). Accuracy for both Sequencing and Selection-only tasks were calculated by giving 1 point for a correct selection and 0 points for an incorrect response. So, the maximum score on a trial is 4 for Sequencing conditions and 2 for Selection-only conditions. The response time (RT) was calculated by timing the whole trial; i.e., starting after all six sentences were presented on screen for the first time and the prompt to select or sequence the sentences appeared, until the selection of the final (fourth) sentence before pressing “4 to continue”. All trials were analyzed, irrespective of whether selection or sequencing was correct, because we assumed that participants’ selection and sequencing was based on what they believed to be correct. When a trial was canceled and redone, analysis was performed on the responses and timing of the final sentence selection.
To explore the possible effect of Stimulation (Anodal versus Sham) on behavioral performance (i.e., RT and accuracy) in our Domain (Social versus Non-social) × Task (Sequencing versus Non-sequencing) design, we analyzed multiple Linear Mixed Models (LMM) in R (version 4.2.3) that took into account individual-level differences and nesting data attributes independently for the three main behavior indicators (RT for all conditions, accuracy in the Sequencing conditions and in Selection-only conditions). For this we used the lme4 package (Bates et al., 2015). Specifically, to estimate how brain stimulation and different conditions influence behavioral performance, we ran Linear Mixed Models and nested the RT for all conditions under different Group, Domain, and Task (Level 1) factors within participants (Level 2). Before the analysis, we removed 12 outliers of the RT, resulting in 1660 data points in total. We computed three models: Model 1 was a baseline model that included an intercept and the dummy indicator of Group, both random at Level 2; Model 2 was a constrained model with the addition of the fixed (main) effects of the proposed predictors (Group, Domain and Task) that predicted Level 2 variation in the intercept, which means that the predictors were free to vary independently. As for ACC, the factor “Task” was not included in the model since it is not applicable (formula 1). Model 3 was an interaction model that contained two-way interactions of Group × Domain, Group × Task, Domain × Task, and the three-way interaction of Group × Task × Domain. In the interaction model, the response time in the trail i was predicted by the fixed effects of Group, Domain, Task, and their interaction, with a random intercept clustered in each subject j (as show in formula 2).
Electric field modeling of the anodal group

We used SimNIBS (version 4.0.1; (Nielsen et al., 2018) to calculate the electric fields induced by tDCS. We created individualized head models for each participant using the charm command. Charm uses individual T1 and T2-weighted structural MRI images to accurately segment nine types of tissues into a tetrahedral head mesh from each participant. Segmentations were checked manually for errors. Subsequently, the location of the peak electric field strength, quantified as the 99th percentile electric field magnitude (Van Hoornweder et al., 2022), was extracted (see supplementary Table S2).
We then used the resulting tetrahedral head mesh of each of the 22 participants in the anodal group to simulate the resulting electric field distribution using our tDCS montage and protocols (cerebellar tDCS at 2 mA). Individual simulations are shown in the Supplementary materials in Figure S1. Based on our hypothesis, we then used SimNIBS to extract individual electric fields induced in cerebellar ROIs of the bilateral Crus 1 and 2 (Van Overwalle & Ma et al., 2020) and lobule IX (Haihambo et al., 2022). These ROIs consisted of spheres with a radius of 5 mm and were centered around the MNI coordinates mentioned above.
To assess the influence of individual electric fields on neural activations, we utilized the MarsBar toolbox (http://marsbar.sourceforge.net) to extract individual percent signal change data in each ROI for each condition change using 5 mm spheres centered on peak voxels within our ROIs. We then employed Pearson correlations to examine the relationships between simulated electric fields in the ROIs, with neural activations in these ROIs (i.e., percent signal change) and the behavioral outcomes (i.e., RTs and accuracy).
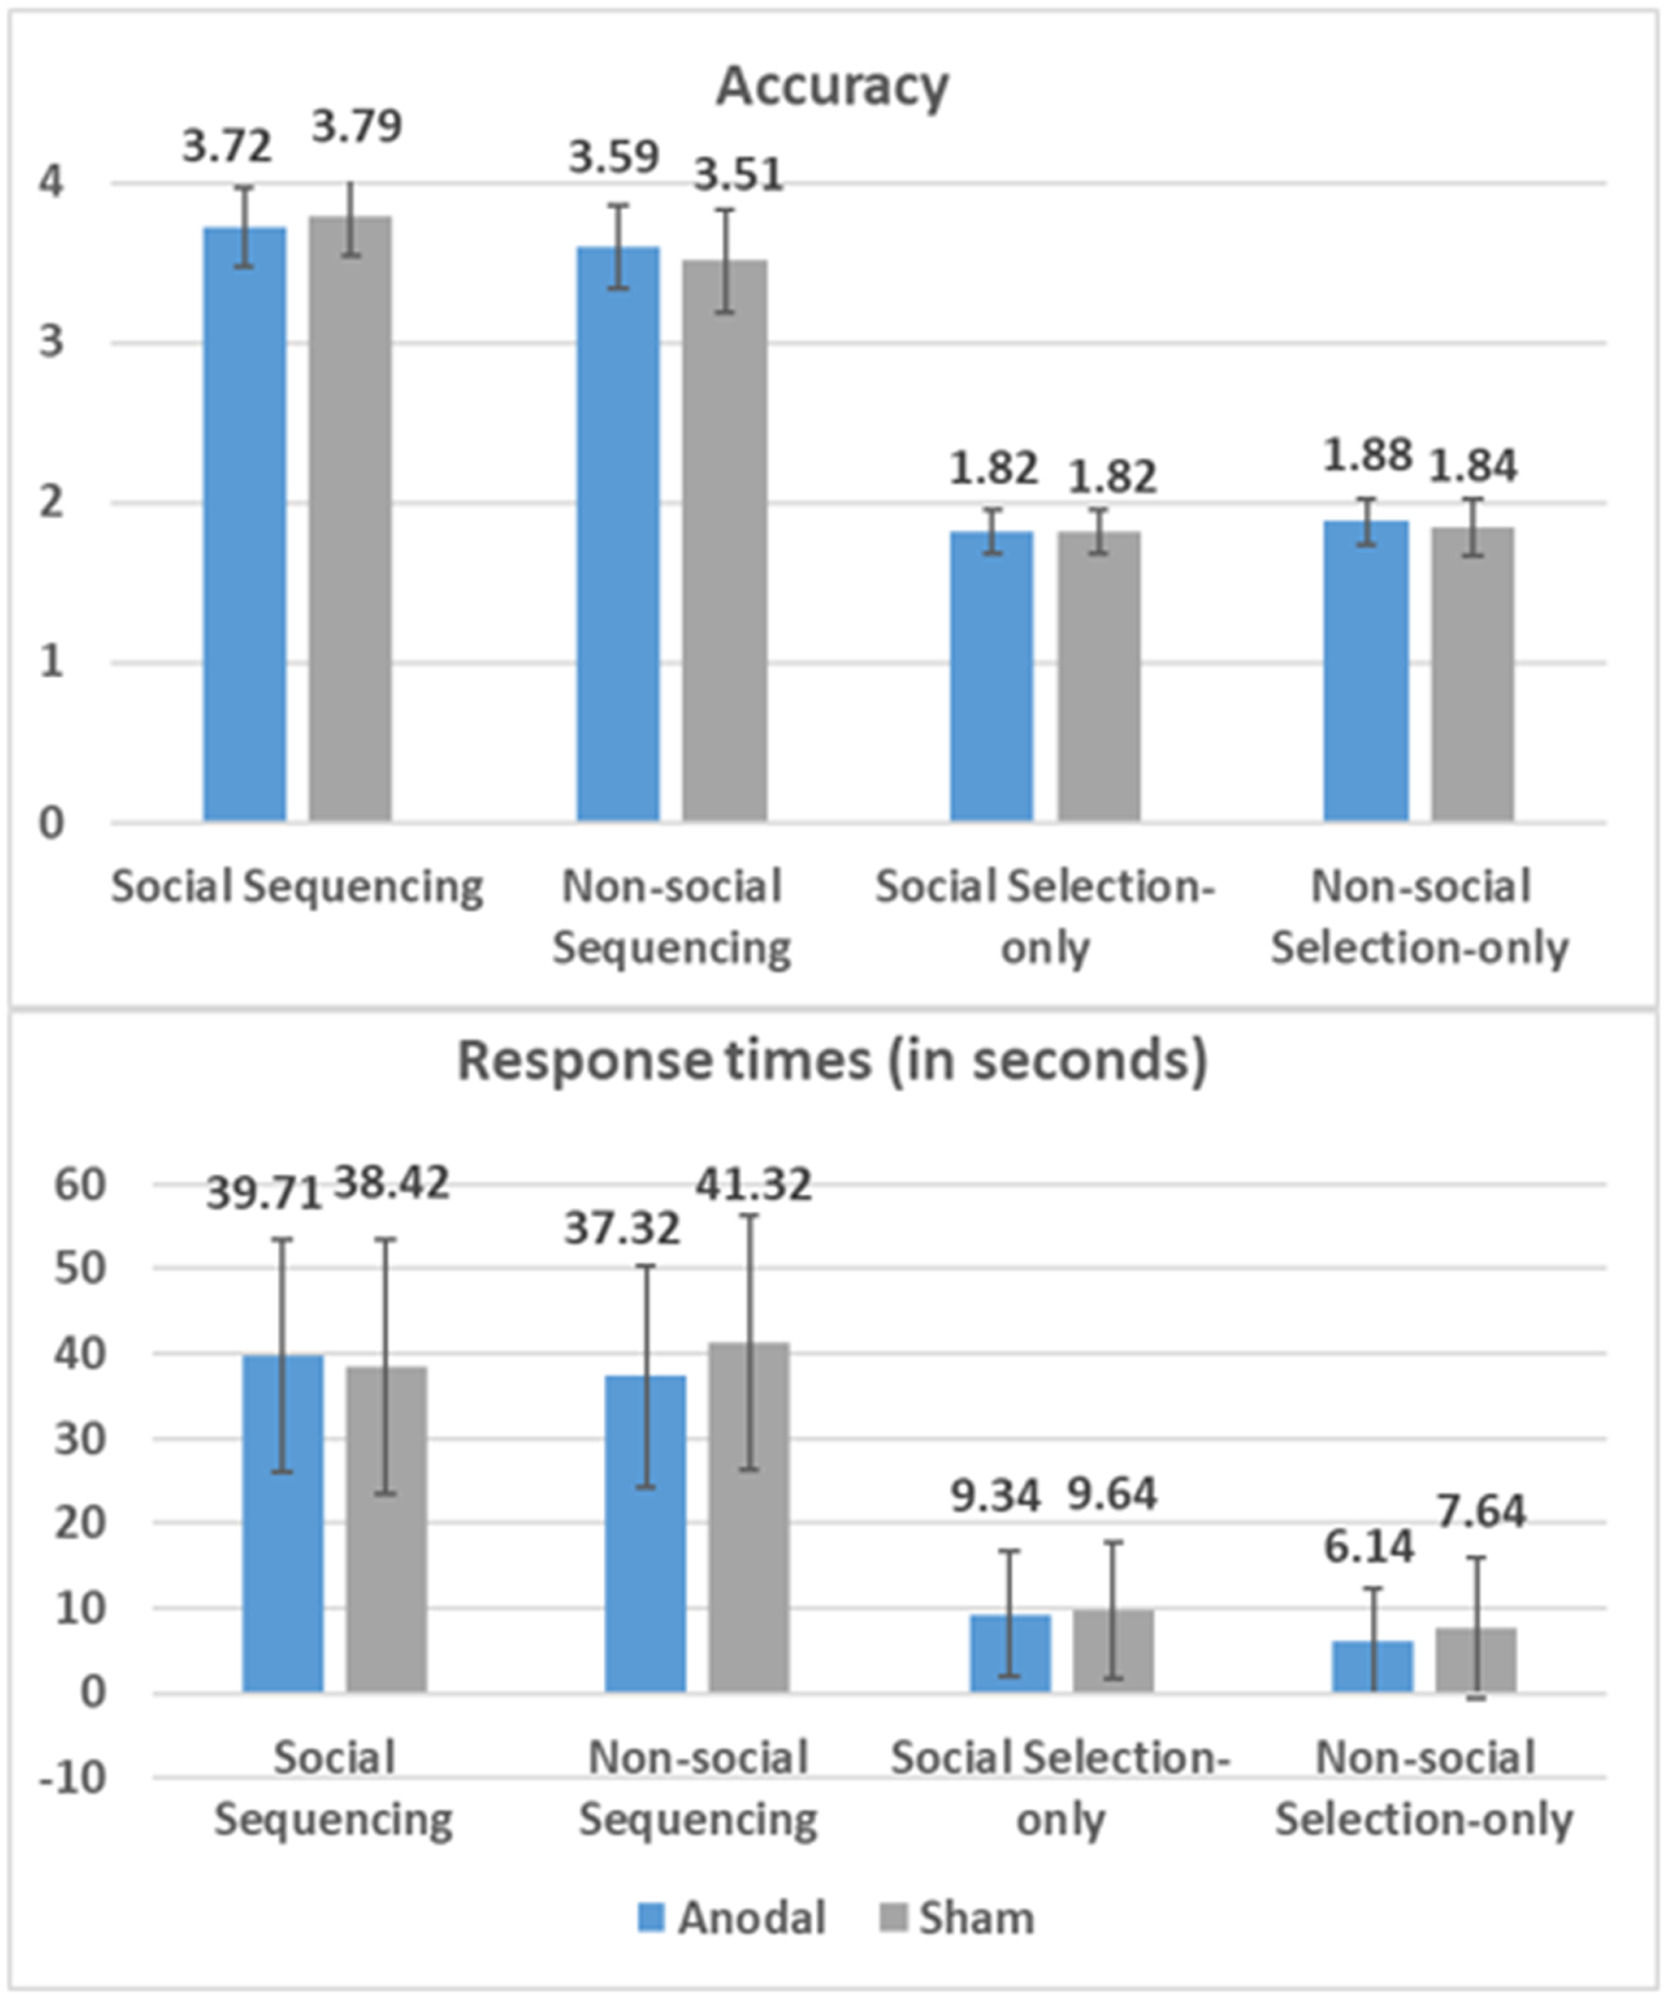
ResultsBehavioral results of anodal and sham groupsResults for response times and accuracy are displayed in Fig. 2.

Accuracy for Sequencing and Selection-only tasks was calculated by assigning 1 point for a correct selection and 0 points for an incorrect response on each trial. Therefore, the maximum achievable score on a Sequencing trial is 4, while for a Selection-only trial, it is 2. Response times are measured in seconds. Mean data are positioned above each bar, with standard errors.
 with a skull showing Anodal electrode (red rectangle) on cerebellum and reference electrode (blue rectangle) on chin. Top right: An illustration of the electric field range imposed onto the cerebellum at a current intensity of 2 mA. Bottom: Schematic representation of the experimental design.")
Top left and middle: Simulation of cerebellar tDCS stimulation montage created using a grey matter mask in SimNIBS version 4.0.1; (Thielscher et al., 2015) with a skull showing Anodal electrode (red rectangle) on cerebellum and reference electrode (blue rectangle) on chin. Top right: An illustration of the electric field range imposed onto the cerebellum at a current intensity of 2 mA. Bottom: Schematic representation of the experimental design.
Results significantly favored Model 3 as shown by Akaike's Information Criterion (AIC) and Bayesian Information Criteria (BIC). Specifically, Model 3 revealed an increased significant influence of Task on RT (β = −0.790, SE = 0.024, t (1615.9) = −33.55, p < 0.001, 95 % CI = [−0.84, −0.74]), showing that participants took longer to complete Sequencing tasks compared to Selection-only tasks (MDSequencing-Selection-only = 31.02 s). We also found a significant effect of Domain (β = −0.056, SE = 0.023, t(1616) = −2.44, p = . 015, 95 % CI = [−0.10, −0.01]) on RT, showing that participants took longer to complete Social task compared to Non-social task (MDSocial-Non-social = 1.29 s). Model 3 also revealed a significant interaction of Group × Domain on RT (β = 0.098, SE = 0.029, t (1616) = 3.37, p = 0.001, 95 % CI = [0.04, 0.13]), showing unexpectedly more facilitatory effects of Anodal stimulation on the Non-social than the Social conditions (MDSocial-Non-social = 22.80 s, SE = 0.66, p < 0.001) while there were no differences in the Sham condition (MDSocial-Non-social = 0.09 s, SE = 0.70, p = 0.898).
AccuracyFor the Sequencing conditions, Model 2 resulted in the best model fit, and revealed an increased significant influence of Domain on accuracy (β = −0.120, SE = 0.034, t (797) = −3.51, p < 0.001, 95 % CI = [−0.19, −0.05]), showing that participants were more accurate in the Social conditions compared to the Non-social counterpart (MDSocial-Non-social = 0.20). For the selection-only conditions, the AIC and BIC showed that adding Group, Domain, or their interaction did not significantly improve the model fit, and the interaction was nonsignificant.
In sum, the LMM results revealed a facilitatory RT effect of Anodal stimulation on the Non-social rather than in the Social conditions, irrespective of Sequencing. It further revealed no effect of Anodal stimulation on accuracy, but did reveal higher accuracy in the Social compared to the Non-social conditions during Sequencing.
Electric field modeling within anodal groupIndividual electric field magnitudeElectric field analyses were performed on 22 individuals from the Anodal group. Supplementary Figure S1 shows the individual electric field strength distribution across all 22 resulting head models. As for electric field magnitude, the mean, standard deviation and range of these values across our five ROIs are as follows. Electric field magnitude in the right Crus 1 ranged from 0.10 v/M to 0.26 v/M (M = 0.19 v/M, SD = 0.04 v/M), in the left Crus 1 from 0.10 v/M to 0.27 v/M (M = 0.18 v/M, SD = 0.04 v/M), in the right Crus 2 from 0.10 v/M to 0.28 v/M (M = 0.19 v/M, SD = 0.05 v/M), in the left Crus 2 from 0.09 v/M to 0.27 v/M (M = 0.20 v/M, SD = 0.03 v/M). We found that the peak electric field magnitude (99th percentile) of all participants was predominantly situated in more inferior parts of the cerebellum (see supplementary Table S2).
Electric field correlationsWe conducted Pearson correlation analyses, examining the relationships in the Anodal group between (1) electric field magnitudes within specific cerebellar ROIs and conditions (e.g., in Lobule IX during Social Sequencing), (2) the corresponding percent signal changes (e.g., in Lobule IX during Social Sequencing), and (3) corresponding behavioral outcomes (e.g., accuracy or RT during Social Sequencing). Our analyses did not reveal any statistically significant correlations, given a significance threshold p < 0.05 after Bonferroni correction for multiple comparisons.
Neuroimaging resultsSimple contrasts between anodal and sham groupsTo test whether anodal stimulation modulates neural activation in cerebellar and cerebral mentalizing areas during social action prediction, we used the sandwich estimator (SwE) to analyze the hypothesized contrasts between the Anodal and Sham stimulation groups (e.g., Anodal Social Sequencing > Sham Social Sequencing) as well as all main effects (e.g., Anodal Social > Sham Social). However, no activations survived FDR correction in either whole brain or ROI analysis for any contrasts.
Asymmetric interactions between anodal and sham groupsTo test our hypothesis that anodal stimulation would result in increased activations during the Social Sequencing condition compared to other conditions within the Anodal and Sham groups, we applied asymmetric interactions which assume high activations in the Social Sequencing condition, and none in the other conditions or sham group.
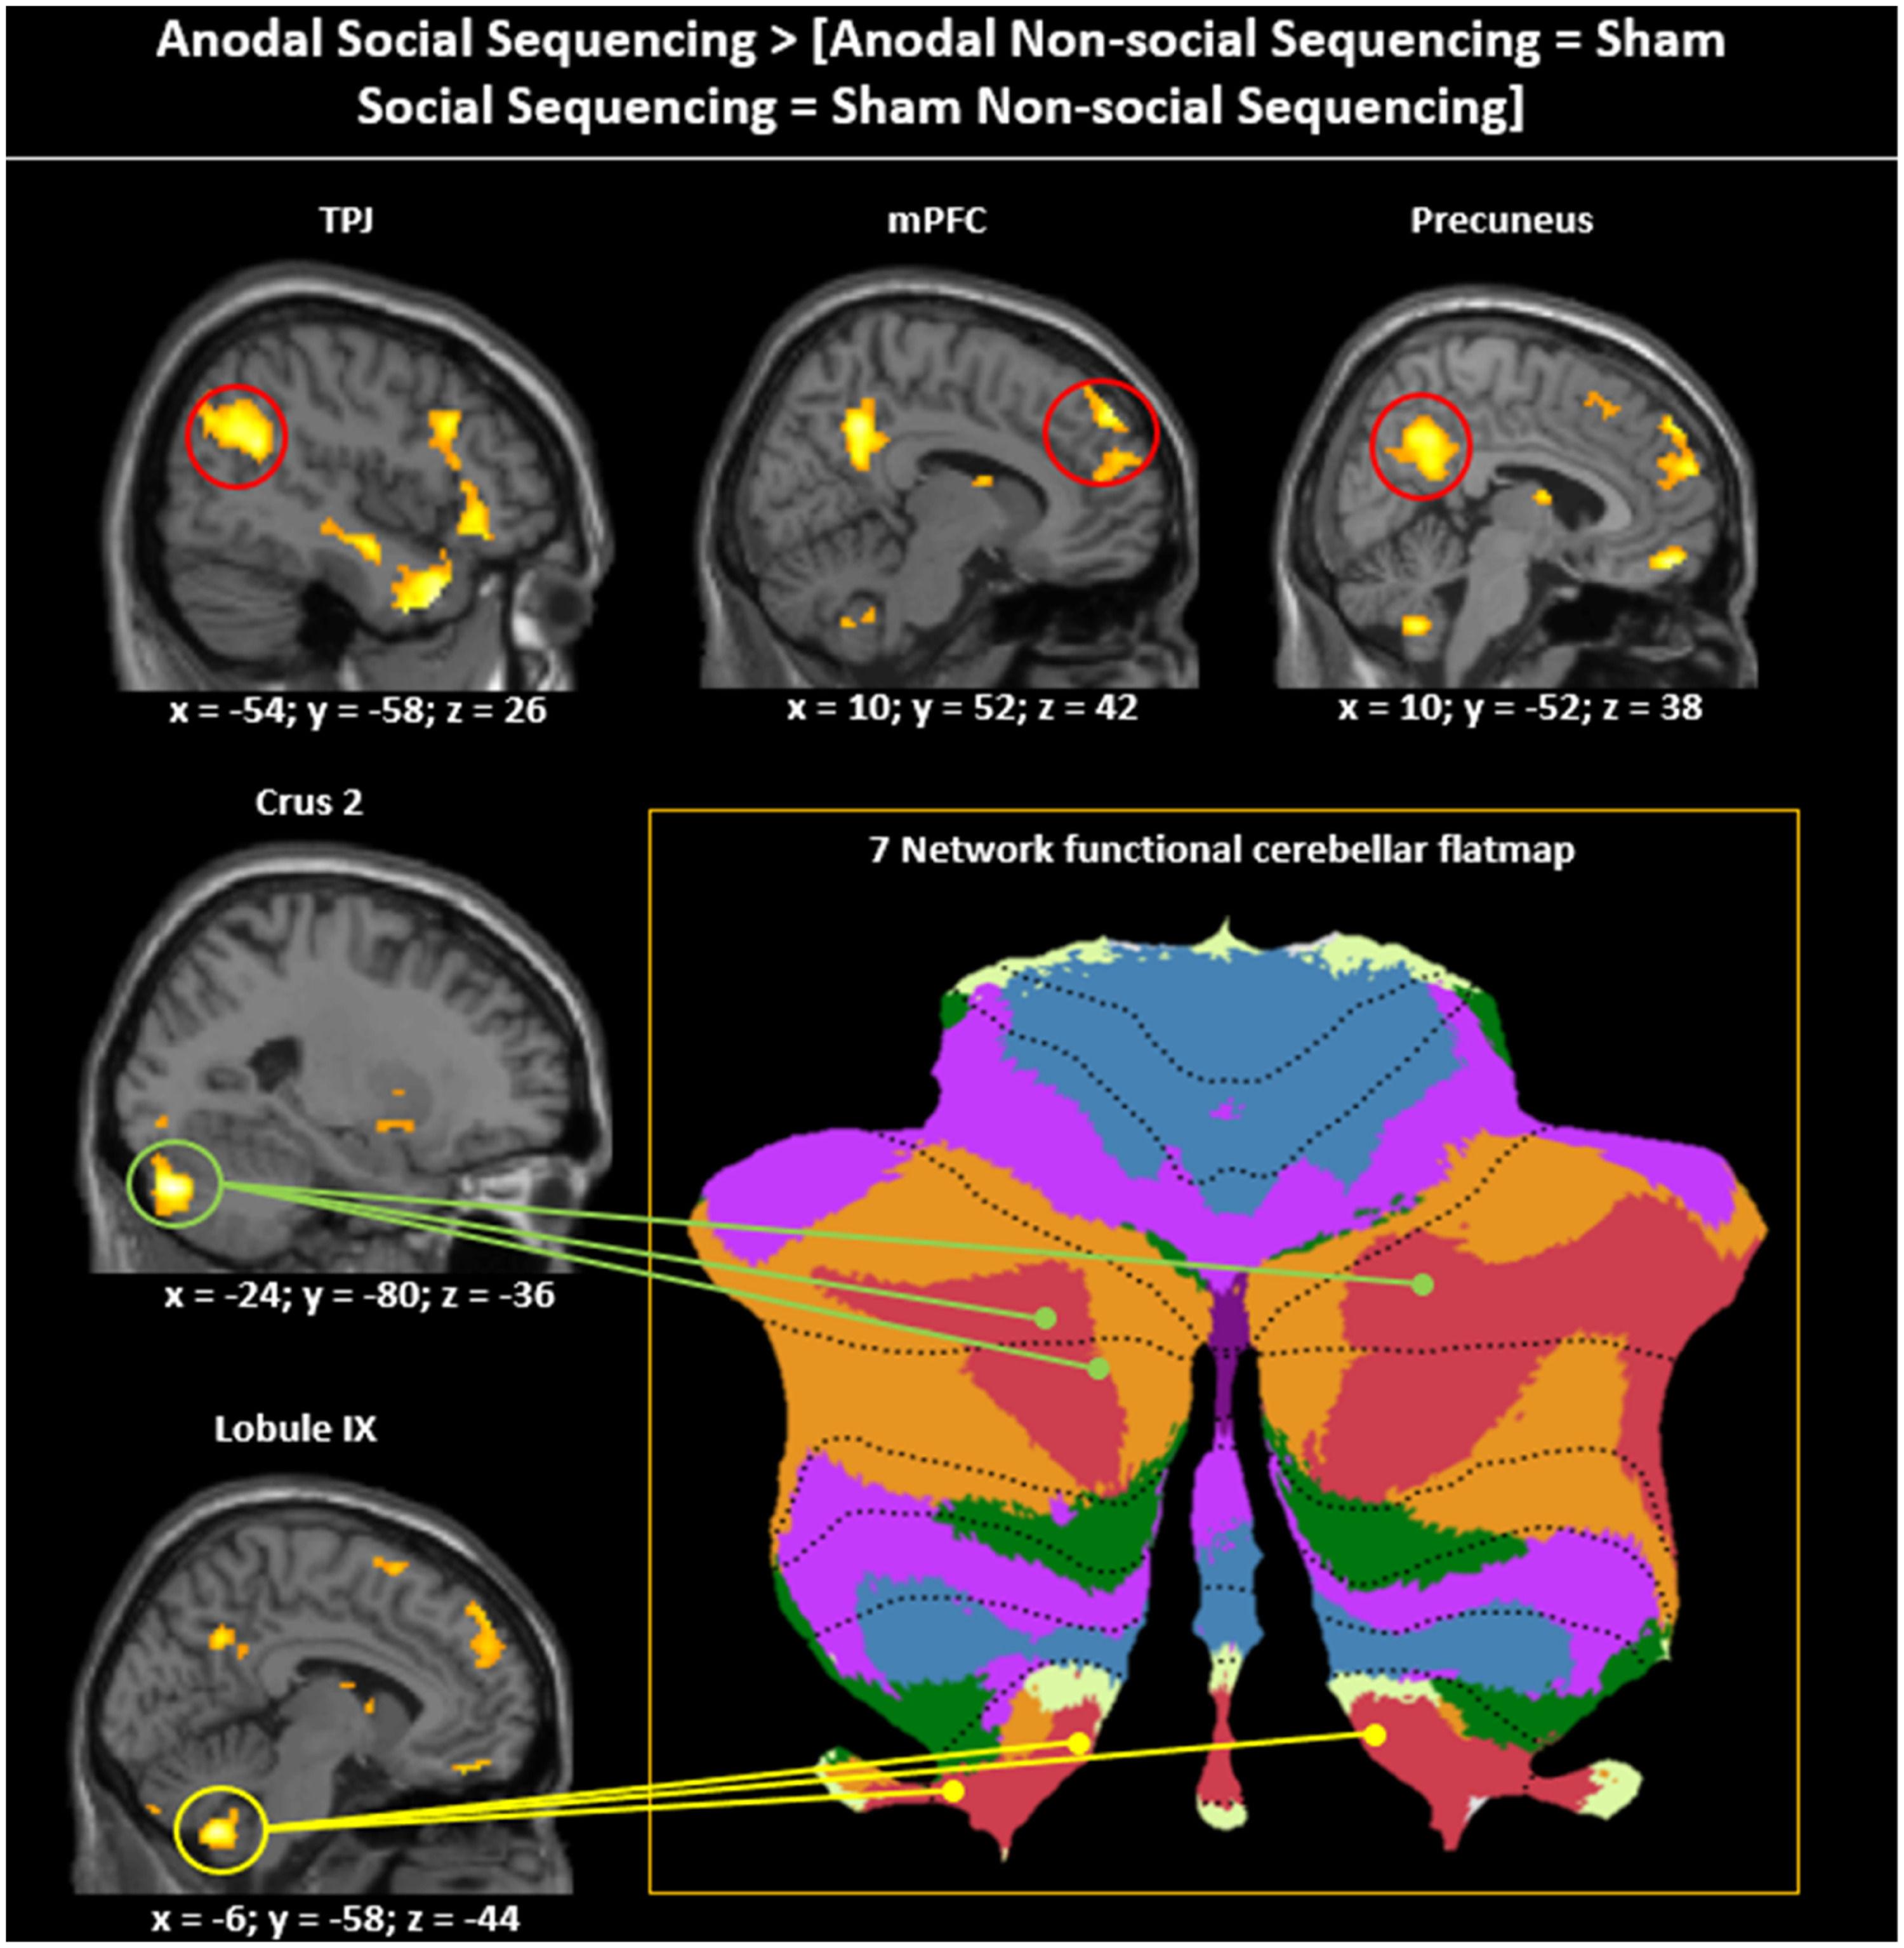
For asymmetric interactions selective for social processing (see method section), as hypothesized, whole brain analysis revealed activations in cerebellar mentalizing areas in the bilateral Crus 2 and lobule IX (see Fig. 4; Table 1). In the cerebral mentalizing areas, we found activations in the bilateral TPJ, precuneus, mPFC and bilateral medial temporal poles. Additionally, we found activations in the left lingual gyrus, caudate nucleus, left posterior-medial frontal gyrus and bilateral inferior frontal gyrus pars opercularis. The opposite asymmetric interaction revealed no significant activations for either whole brain or ROI analysis.
![Asymmetric interaction testing for Social specificity of the Anodal (vs. Sham) stimulation. Sagittal view visualized at a whole-brain FRD corrected threshold of p 〈 0.05 showing clusters of activation in cerebellar and cerebral mentalizing areas given the asymmetric interaction contrast Anodal Social Sequencing 〉 [Anodal Non-social Sequencing = Sham Social Sequencing = Sham Non-social Sequencing]. The cerebellar peak activations in Crus 2 and lobule IX are projected onto the 7-network structure from Buckner, Krienen, Castellanos, Buckner, Krienen, Castellanos, Diaz, and Yeo (2011) shown on a cerebellar flatmap (http:// www. diedrichsenlab.org/imaging/Atlas Viewer/viewer. html). Regions in red on the cerebellar flat map are functionally related to mentalizing. Although the cerebellar areas on the middle and bottom left show only one hemisphere, for ease of presentation, the location and functional role is indicated for both hemispheres on the flatmap.](https://static.elsevier.es/multimedia/16972600/0000002400000003/v5_202411250749/S1697260024000450/v5_202411250749/en/main.assets/gr4.jpeg?xkr=ue/ImdikoIMrsJoerZ+w997EogCnBdOOD93cPFbanNensa1rW+zY7MJT+xyAusAd1eWSWVsld5nw/a67MxcQhCEMM2i1CV6qumZGJ0M7jjFysrLJ5QeiW7RzNNLWY0mpKgZ636k3fCq00dBkBbaOYyHBKyisBoN3MH+NDP6TEFdFt7Yv394AY7GHqsOnzrhH7XW2C9jQ02zLZE47Bn0gGAnSRBKoxA0oG4MrajvMyBzsuWBoysaZs1sSoWUIpWCHNxMDz0O3ua4LcFjl4uAoi7LmifeoCe9yvjpFAjJALHM= "Asymmetric interaction testing for Social specificity of the Anodal (vs. Sham) stimulation. Sagittal view visualized at a whole-brain FRD corrected threshold of p 〈 0.05 showing clusters of activation in cerebellar and cerebral mentalizing areas given the asymmetric interaction contrast Anodal Social Sequencing 〉 [Anodal Non-social Sequencing = Sham Social Sequencing = Sham Non-social Sequencing]. The cerebellar peak activations in Crus 2 and lobule IX are projected onto the 7-network structure from Buckner, Krienen, Castellanos, Buckner, Krienen, Castellanos, Diaz, and Yeo (2011) shown on a cerebellar flatmap (http:// www. diedrichsenlab.org/imaging/Atlas Viewer/viewer. html). Regions in red on the cerebellar flat map are functionally related to mentalizing. Although the cerebellar areas on the middle and bottom left show only one hemisphere, for ease of presentation, the location and functional role is indicated for both hemispheres on the flatmap.")
Asymmetric interaction testing for Social specificity of the Anodal (vs. Sham) stimulation. Sagittal view visualized at a whole-brain FRD corrected threshold of p 〈 0.05 showing clusters of activation in cerebellar and cerebral mentalizing areas given the asymmetric interaction contrast Anodal Social Sequencing 〉 [Anodal Non-social Sequencing = Sham Social Sequencing = Sham Non-social Sequencing]. The cerebellar peak activations in Crus 2 and lobule IX are projected onto the 7-network structure from Buckner, Krienen, Castellanos, Buckner, Krienen, Castellanos, Diaz, and Yeo (2011) shown on a cerebellar flatmap (http:// www. diedrichsenlab.org/imaging/Atlas Viewer/viewer. html). Regions in red on the cerebellar flat map are functionally related to mentalizing. Although the cerebellar areas on the middle and bottom left show only one hemisphere, for ease of presentation, the location and functional role is indicated for both hemispheres on the flatmap.
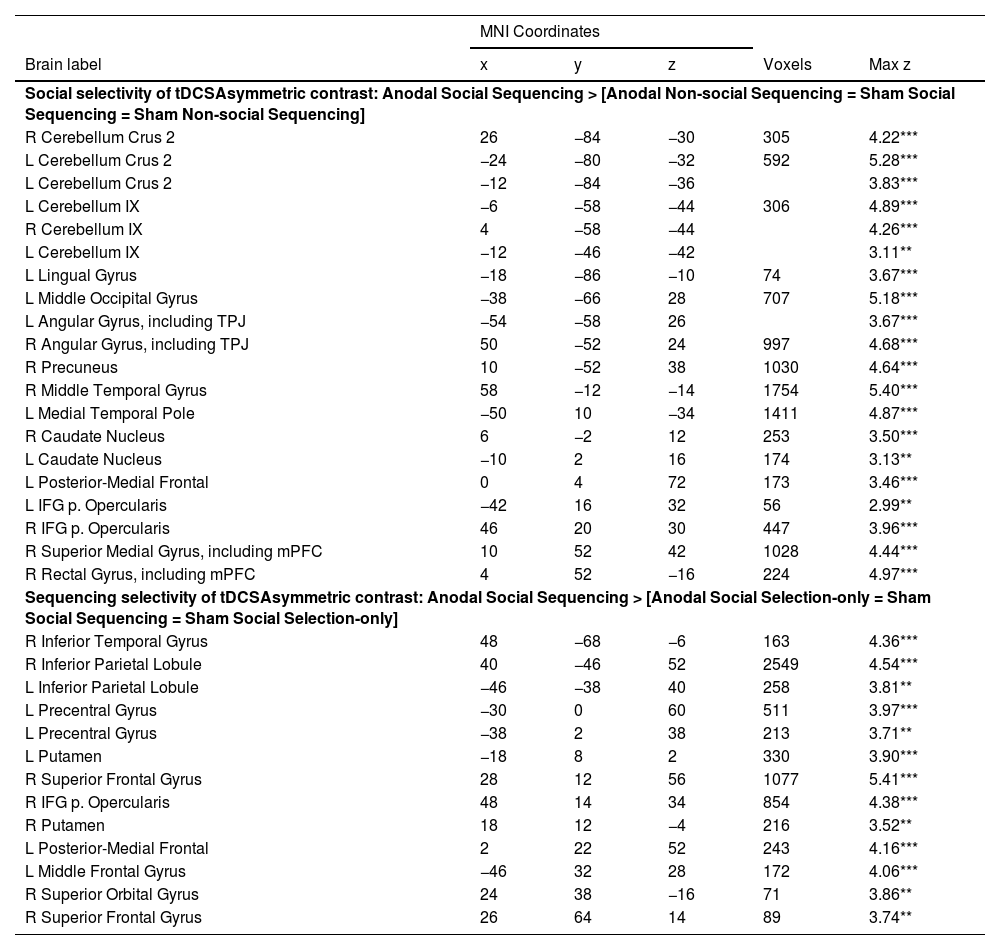
Whole brain and ROI analyses comparing Anodal Sequencing to other social/sequencing conditions.
Note: Coordinates refer to the MNI (Montreal Neurological Institute) stereotaxic space. Shown are only the highest peaks of each cluster, except all significant subpeaks of the cerebellum and mentalizing ROIs. Whole-brain analysis thresholded at cluster-defining FRD corrected p < 0.05 and voxel extent ≥ 50. L = left, R = right, PCC = posterior cingulate cortex, TPJ = temporoparietal junction, mPFC = medial prefrontal cortex, *p < 0.05; **p < 0.01; ***p < 0.001.
For asymmetric interactions selective for sequence processing, neither whole brain nor ROI analysis revealed activations in the cerebellum. However, we did find whole brain activations in the right inferior temporal gyrus, bilateral inferior parietal lobule, left precentral gyrus, bilateral putamen, bilateral superior frontal gyrus, right inferior frontal gyrus pars opercularis, left posterior-medial frontal gyrus, left middle frontal gyrus and superior orbital gyrus. The opposite asymmetric interaction revealed no significant activations for either whole brain or ROI analysis.
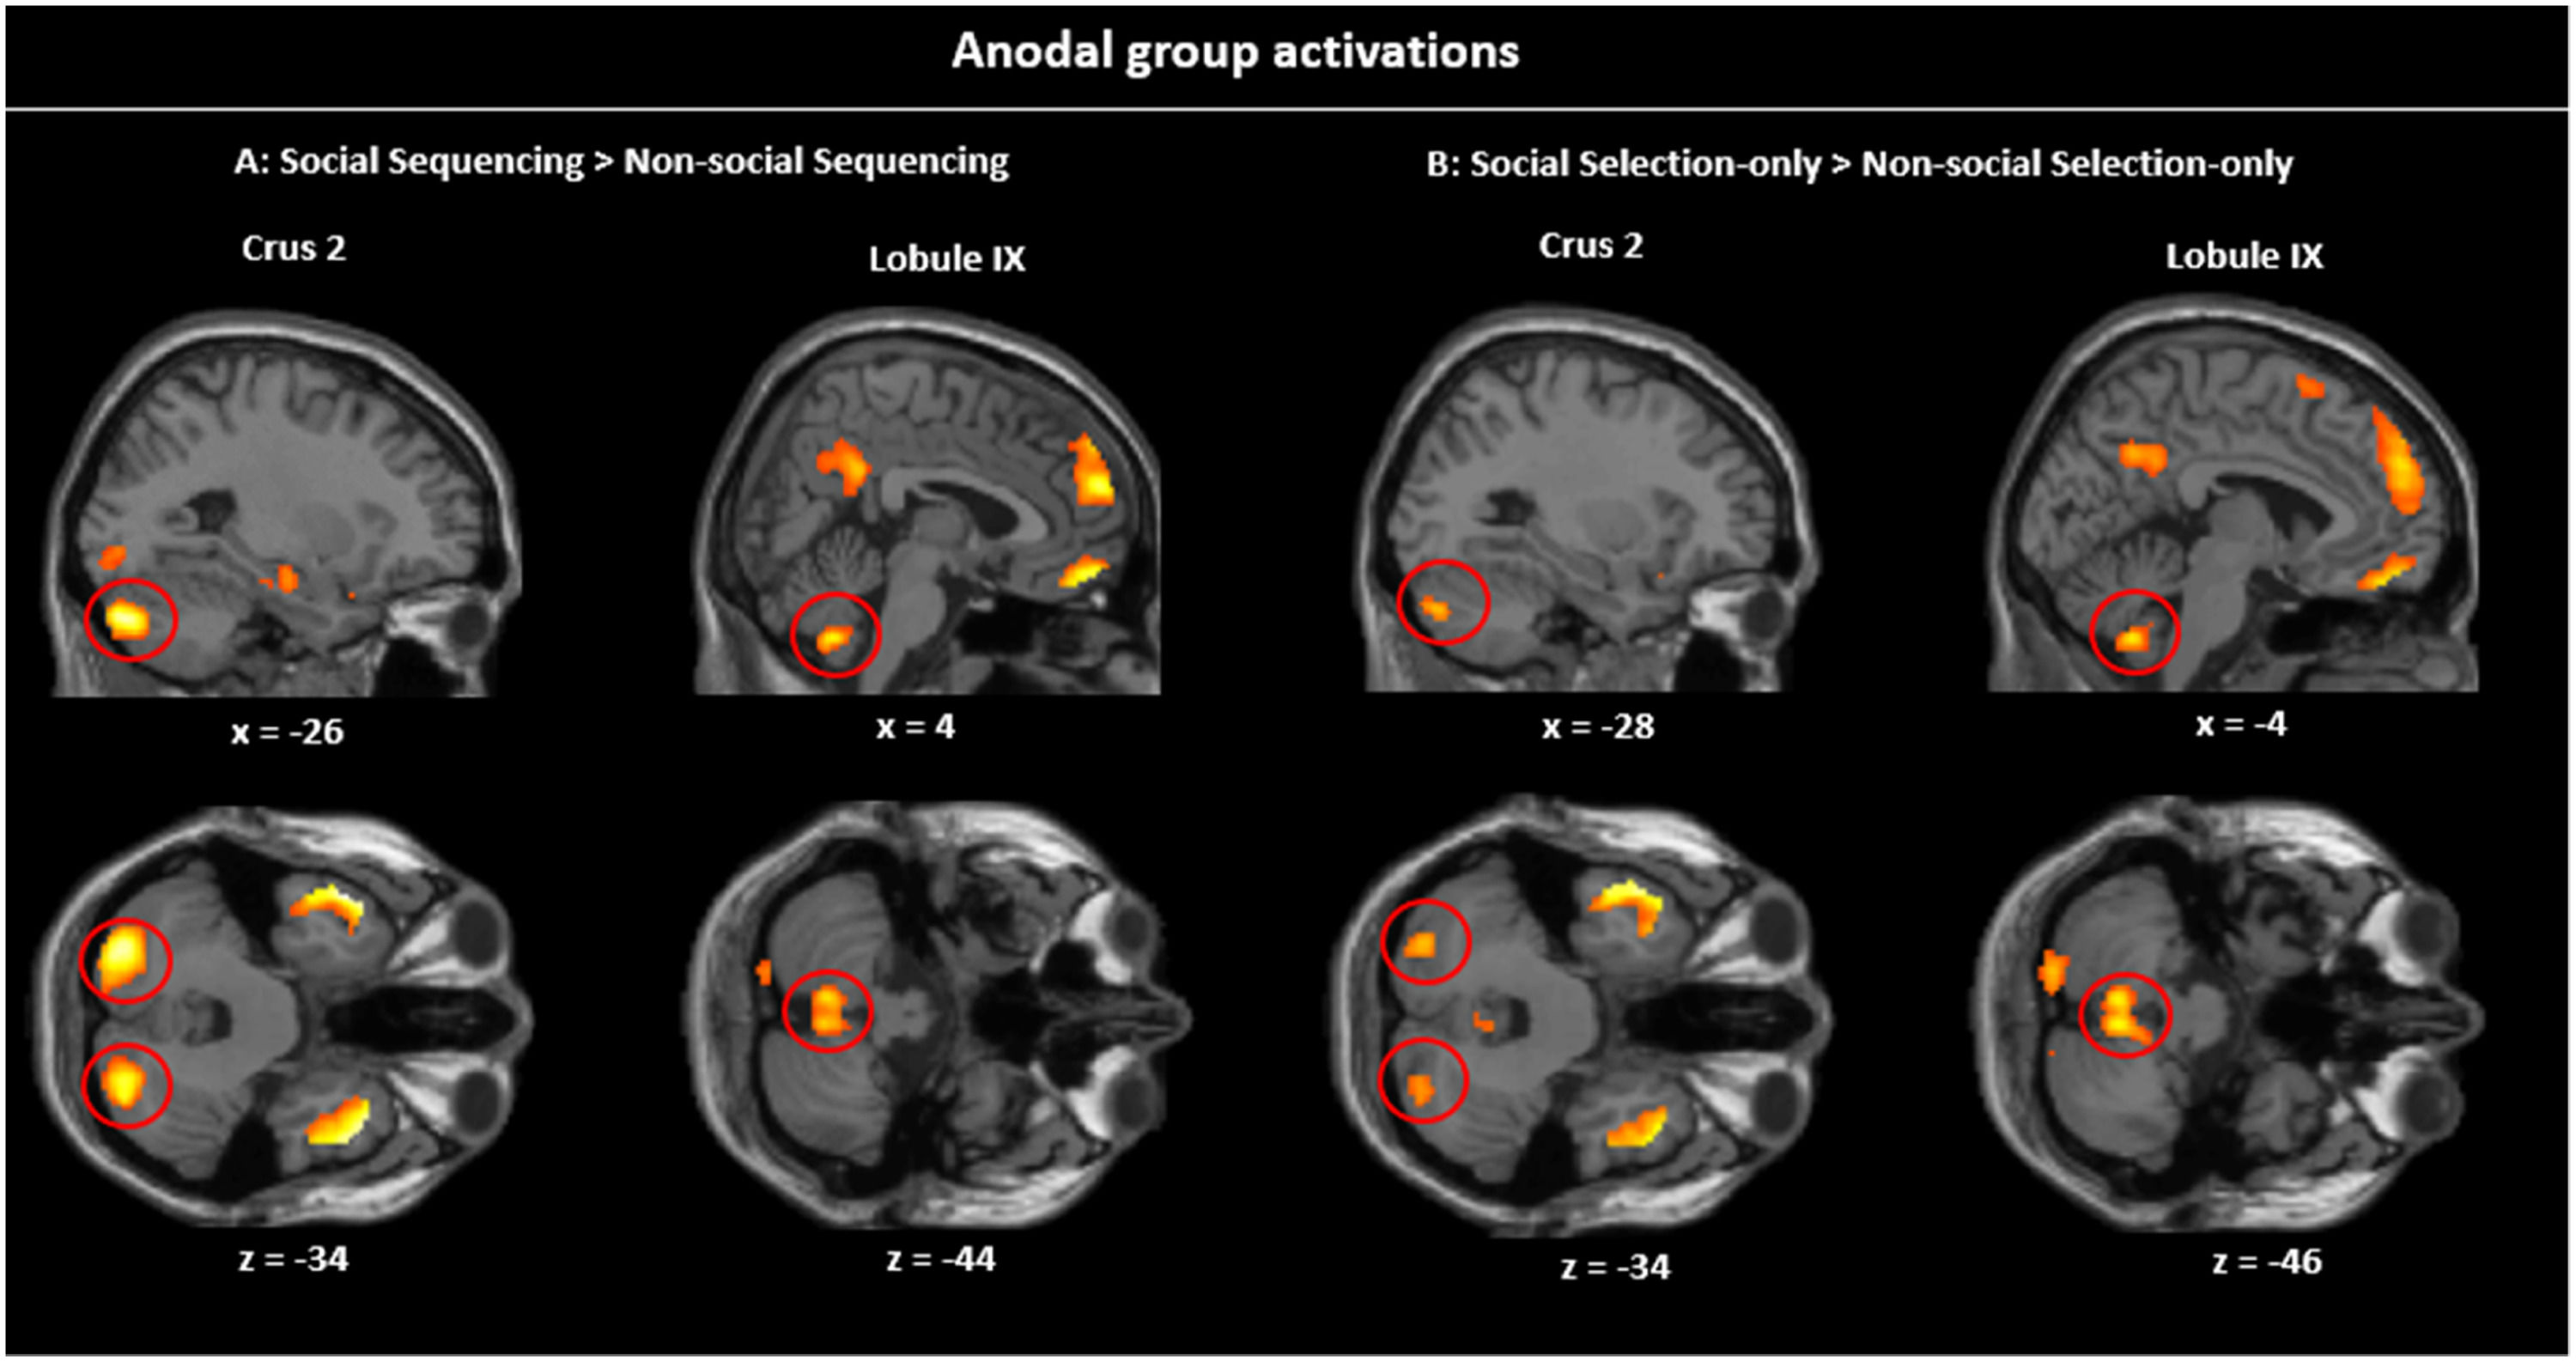
Simple contrasts within the anodal groupTo validate and explain the asymmetric interactions, we further conducted simple contrasts in the Anodal group. Given the results of the asymmetric interactions, we should expect a parallel specificity for Social (vs. Non-social) information which should be stronger in Sequencing than Non-sequencing, but little specificity for Sequencing (vs. Selection-only; Fig. 5; Table 2).
 clusters in the Sequencing condition (A) are larger than in the Selection-only condition (B).")
Simple contrasts in the Anodal group. Sagittal and transverse views of the experimental contrasts visualized at peak whole-brain FWE corrected threshold of p 〈 0.001. A: Social Sequencing 〉 Non-Social Sequencing contrast showing Crus 2 and lobule IX activations, B: Social Selection-only > Non-Social Selection-only contrast showing Crus 2 and lobule IX activations. As can be visually inspected, the Social (vs. Non-social) clusters in the Sequencing condition (A) are larger than in the Selection-only condition (B).
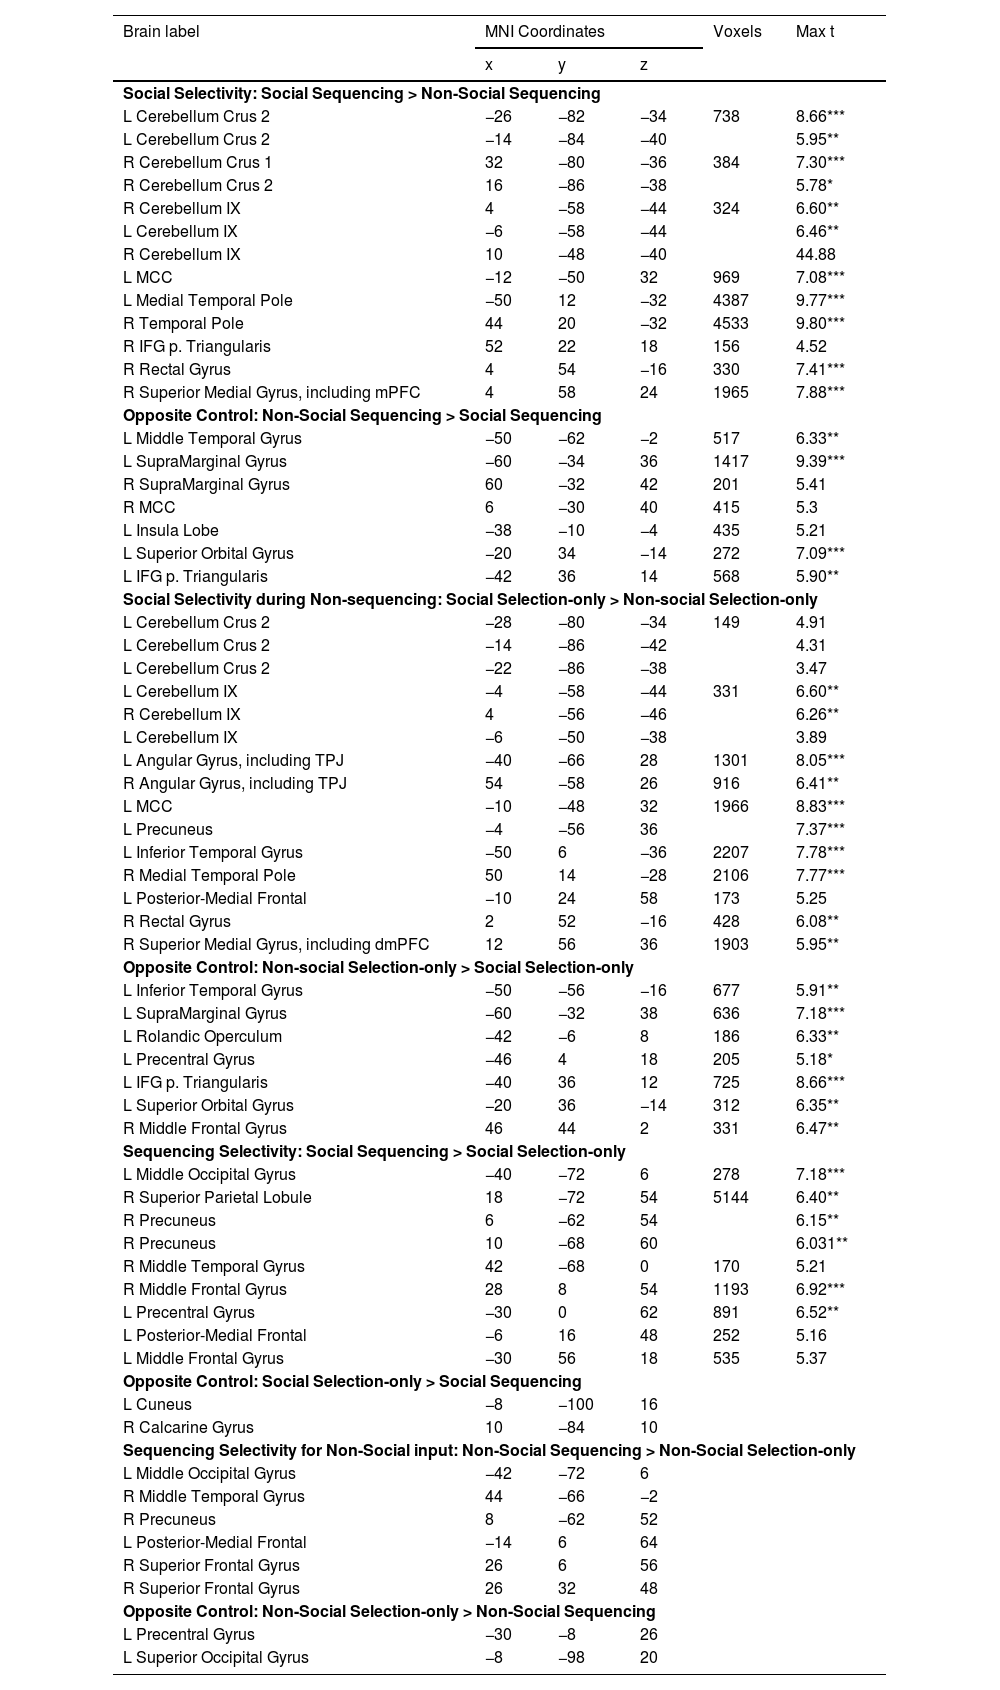
Whole brain and ROI analyses comparing conditions within the Anodal group.
Coordinates refer to the MNI (Montreal Neurological Institute) stereotaxic space. Shown are only the highest peaks of each cluster, except all significant subpeaks of the cerebellum and mentalizing ROIs. Whole-brain analysis thresholded at cluster-defining uncorrected p < 0.001 and cluster-wise FWE corrected p < 0.05, with voxel extent ≥ 10. L = left, R = right, TPJ = temporoparietal junction, mPFC = medial prefrontal cortex, dmPFC = dorsal medial prefrontal cortex, MCC = medial cingulate cortex, TPJ = temporoparietal junction *p < 0.05, **p < 0.01, ***p < 0.001 (peak FWE corrected).
Social specificity during Sequencing. The Social Sequencing > Non-social Sequencing contrast revealed, as hypothesized, activations in the bilateral Crus 2, right Crus 1 and lobule IX, which are all located within cerebellar mentalizing areas. Further, we also found whole brain activations in the middle cingulate cortex, bilateral temporal poles, right IFG pars Triangularis, rectal gyrus and superior medial gyrus, including the mPFC and dmPFC. The opposite contrast (i.e., Non-Social Sequencing > Social Sequencing) did not show mentalizing activations, but revealed activations in the left middle temporal gyrus, right supramarginal gyrus, bilateral supramedial gyri, middle cingulate cortex, left insula lobe, left superior orbital gyrus and left IFG pars Triangularis.
Social specificity during Non-sequencing control. As a control, we further explored the involvement of the cerebellum in processing social information that did not include sequencing. The Social Selection-only > Non-Social Selection-only contrast revealed activations in the left Crus 2 and lobule IX in the posterior cerebellum. However, it is important to note that the volumes of these cerebellar clusters were much smaller overall than in the same Social > Non-Social contrast involving Sequencing discussed above (see Table 2), which is in line with our hypothesis. We found further whole brain activations in the bilateral angular gyri including TPJ, medial cingulate gyrus, bilateral inferior temporal gyri, right middle temporal pole, posterior-medial frontal, rectal gyrus, and superior medial gyrus including dmPFC. The opposite contrast (i.e., Non-social Selection-only > Social Selection-only) did not reveal mentalizing activation, but revealed whole brain activations in the left inferior temporal gyrus, left supramarginal gyrus, left rolandic operculum, left precental gyrus, left IFG pars Triangularis, left superior orbital gyrus and right middle frontal gyrus.
Specificity for Sequencing of Social information. Contrary to our hypothesis, the Social Sequencing > Social Selection-only contrast revealed no activation in mentalizing areas, but did reveal activation in the left middle occipital gyrus, right superior parietal lobule, right middle temporal gyrus, bilateral middle frontal gyri, left precentral gyrus and posterior-medial frontal. The opposite contrast (i.e., Social Selection-only > Social Sequencing) also did not reveal activation in mentalizing areas, but did reveal activations in the cuneus.
Specificity for Sequencing of Non-Social control information. To further control for the posterior cerebellum's preference for sequencing social actions over non-social actions, we computed a Non-social Sequencing > Non-social Selection-only contrast. This contrast revealed no mentalizing activations, but additional whole brain activations in the left middle occipital gyrus, right middle temporal gyrus, right precuneus left posterior-medial frontal and right superior frontal gyrus. The opposite contrast revealed activations in the left precentral gyrus and superior occipital gyrus.
Simple contrasts within the sham groupIn the sham group, we found similar cerebral mentalizing activations to those observed in the Anodal group when testing for Social specificity during Sequencing (Social Sequencing > Non-social Sequencing), and during Non-Sequencing (Social Selection-only > Non-social Selection-only). However, contrary to our hypothesis, we did not find cerebellar activation. Please consult Tables S1 in the supplementary materials for more details.
DiscussionIn the current study, we aimed to demonstrate the causal role of the posterior cerebellum in predicting social action sequences based on personality trait information of social agents. To this end, we investigated the effects of anodal tDCS targeting the posterior cerebellum on neural activation in cerebellar and cerebral mentalizing areas, as well as on behavioral performance. We hypothesized that anodal stimulation would result in stronger activations in mentalizing areas during Social Sequencing compared to other conditions within the Anodal and Sham groups. Consistent with our hypothesis, we found significant activations in the cerebellar Crus 2, and lobule IX, as well as in cerebral mentalizing regions (i.e., mPFC, TPJ, and precuneus) during Social Sequencing in the Anodal group, compared to Non-social and Sham conditions, indicating a social specificity of tDCS effects in this study. However, our results failed to reveal a sequencing specificity of the stimulation, as there were no significant activations when comparing Social Sequencing processes to Non-sequencing (Selection-only) and Sham. Contrary to these neural findings, our behavioral results revealed faster response times after Anodal stimulation on the Non-social rather than in the Social conditions, irrespective of Sequencing; there was no effect of Anodal stimulation on accuracy.
tDCS modulates neural activation during social processingAs hypothesized, anodal cerebellar tDCS modulated neural dynamics in the cerebellum (Crus 2 and lobule IX) more during social than non-social processing, when sequences were involved. This suggests that anodal cerebellar tDCS generates an excitatory effect and enhances neural activation during social action prediction based on personality traits. These results are consistent with previous studies highlighting the role of the cerebellum in social processing and prediction (Van Overwalle & Baetens et al., 2015; Van Overwalle et al., 2014, 2020), particularly in the context of social sequencing (Van Overwalle et al., 2019). Importantly, as noted before, we observed cerebellar activation in the anodal group when testing for social specificity, but not when testing for sequencing specificity. This suggests that the effects of anodal cerebellar tDCS may be closely tied to processing social predictive sequencing rather than to general sequencing mechanisms. This interpretation is in line with previous research demonstrating the specific involvement of the posterior cerebellar Crus 1 and 2 in processing social information (Sokolov, 2018; Stosic et al., 2014; Van Overwalle & Baetens et al., 2015; Van Overwalle et al., 2014, 2020). Importantly, we found increased activation in the cerebellar Crus 2, which is in line with the assertion that cerebellar Crus 2 is more functionally relevant for social events (Van Overwalle & Ma et al., 2020).
Although we did not put forward any hypotheses on cerebral mentalizing areas following tDCS, our observation of co-activation in these areas (TPJ, mPFC, precuneus) along with posterior cerebellar areas is not surprising, and is in line with prior research (Mar, 2011; Schurz et al., 2014a; Van Overwalle, 2009) (Mar, 2011; Schurz et al., 2014a; Van Overwalle, 2009) (Mar, 2011; Schurz et al., 2014a; Van Overwalle, 2009) (Mar, 2011; Schurz et al., 2014a; Van Overwalle, 2009). These increased activations may be due to substantial functional connections between mentalizing areas in the cerebellum and cerebrum, which has been demonstrated by previous studies. In particular, Dynamic Causal Modelling analyses have revealed strong and consistent functional connectivity between areas in the posterior cerebellum in Crus 2, and key cerebral mentalizing nodes in the TPJ, precuneus and mPFC (Ma et al., 2023; Pu et al., 2023; Van Overwalle & Van de Steen et al., 2020). More importantly, a previous resting-state study showed that TMS targeting the cerebellum increased the functional connectivity between the cerebellum and cerebral areas of the mentalizing network (Halko et al., 2014). Future studies could further explore whether this would also be the case for tDCS, by analyzing possible changes in cerebello-cerebral connectivity following tDCS.
Stimulation of the cerebellum using tDCS does not always seem beneficial. For instance, a recent cerebellar tDCS-fMRI study by Catoira (Catoira et al., 2023) found no activation in the cerebellum following anodal cerebellar tDCS. Instead, these authors observed an inhibitory effect manifested by decreased activation in cerebral mentalizing areas including the TPJ and precuneus. However, their electrode position was radically different from ours, as both anode and cathode were placed at opposite cerebellar hemispheres, and so may have hampered rather than increased cerebellar activation. Similarly, in a resting-state tDCS study by (Stoodley et al., 2017), anodal tDCS targeting the cerebellum was found to increase inhibitory output from cerebellar Crus 1, leading to lower activation in areas such as the inferior parietal lobe, which is implicated in the perception of social behavior (Van Overwalle & Baetens, 2009). Note that this study measured continuous resting state, without any social input or task, which may limit its implications. Thus, overall, our findings suggest that anodal stimulation with an appropriate electrode montage enhances social sequencing processes by increasing activity in cerebellar and cerebral mentalizing regions. Since it is still unclear what the most efficient tDCS-fMRI procedures are, these results have important implications for the development of tDCS interventions aimed at improving social cognitive processes.
Facilitatory effect of anodal tDCS on response time, but not accuracyOur behavioral findings revealed that anodal tDCS had a facilitatory effect on participants’ response times in predicting non-social sequences, but not in predicting social sequences, which is contrary to our hypothesis. However, these results align with a previous study conducted by (Ma et al., 2023) which applied cerebellar tDCS during a mentalizing task involving responding to a sequence of social agents’ beliefs or non-social shapes’ colors. They also found faster response times after tDCS on non-social, but not on social trials. The consistency between our findings and this previous study may suggests that healthy individuals may be more attuned to social sequencing information in everyday life and, consequently, require less cognitive effort when applying this skill, compared to thinking of non-social sequences. This familiarity may result in ceiling effects leaving little room for improvement, since the task requires less substantial mental effort, rendering social sequencing related processes less responsive to interventions such as tDCS (Pope & Miall, 2012). For example, a study by (Sánchez-Kuhn et al., 2018) found that anodal tDCS significantly improved motor learning in untrained, but not in trained musicians, suggesting that competency and familiarity play an important role in the efficacy of anodal tDCS. Consequently, people with less well developed social skills, such as individuals with autism, may potentially profit substantially more from our tDCS treatment. People in this population have been found to struggle with sequencing social information that requires mentalizing (Bylemans et al., 2023; Heleven et al., 2022; Van Overwalle & Baeken et al., 2021).
The effects of electric fields on brain and behaviorIn this study, we also investigated the individual electric field magnitudes and their relationships within the anodal group to better understand the effects of electric field exposure on cerebellar regions of interest. We hypothesized that a higher electric field magnitude in a given ROI and condition (e.g., lobule IX in social sequencing) would result in higher cerebellar activation in the same region and condition and better behavioral performance in that condition. However, we were not able to confirm this hypothesis. We found no significant correlation between simulated electric field magnitude and neural activation or behavioral performance.
Prior tDCS research on the cerebellum has reported higher electric field magnitudes, reaching up to 0.7 v/M (Klaus & Schutter, 2021), in contrast to the maximum of 0.27 v/M observed in our current study. This discrepancy raises the possibility that our tDCS parameters, involving 2 mA intensity for a duration of 20 min, might not have been potent enough to induce detectable effects, particularly within the cerebellum, a region densely covered by muscle and tissue. It is noteworthy that these prior studies relied on the headreco function for tissue segmentation, which incorporates less tissue compared to the charm command utilized in our investigation (Puonti et al., 2020).
Nevertheless, investigations into electric field magnitudes in cerebral areas, such as the prefrontal cortex, have revealed that higher stimulation intensities result in both quicker and more accurate performance on behavioral tests (Razza et al., 2023). It would be worthwhile for future studies to explore whether escalating stimulation intensities could yield similar beneficial effects within the cerebellum. Additionally, to further advance our understanding of these intricate relationships, future research endeavors should delve further into the mechanisms underlying tDCS stimulation, particularly concerning its application to the cerebellum.
Additionally, an important consideration in our study is the variability observed in the electrical estimations among participants (Figure S1). While all participants received stimulation at the same site—specifically, the midline of the cerebellum (2 cm below the inion)—there were notable differences in the estimated peak stimulation locations. This variability likely stems from inherent anatomical differences among participants, which can significantly impact the distribution and intensity of electric fields.
These findings further point to the importance of considering individualized stimulation approaches in future research. By tailoring stimulation parameters such as target and dosage, to individual anatomical characteristics and mental, behavioral or physiological baselines, researchers can perhaps optimize efficacy and minimize variability in stimulation effects (Caulfield et al., 2020a, 2020b; Joshi et al., 2023; Khan et al., 2022, 2023; Splittgerber et al., 2020). While our study did not explicitly address these anatomical variations, they are crucial factors to consider in the interpretation of stimulation outcomes.
Considerations and suggestionsWhile our study provides important insights into the potential effects of anodal cerebellar tDCS on task performance and neural activation during social action prediction, several limitations and considerations should be taken into account.
First, our study only focuses on rather immediate effects of anodal tDCS. However, the behavioral effects of tDCS may not manifest immediately and potential delayed effects may be observed a few days after stimulation. For example, (Ma et al., 2023) found improvements in task performance following tDCS up to a week later. Second, our study only included a single tDCS session. It is plausible that tDCS needs to be administered over multiple sessions to gain more significant behavioral and neural results (Centelles et al., 2011), which could be relevant for both healthy and clinical populations. For example, a study by (Benussi et al., 2017) found that anodal tDCS over the posterior cerebellum for 10 sessions over 2 weeks, has long term beneficial effects in restoring physiological cerebellar brain inhibition pathways in patients with cerebellar ataxias. It would be valuable for future studies to investigate the presence and duration of cumulative effects on both behavioral outcomes and neural activation during social processing following multiple sessions of cerebellar tDCS. Third, although we did not find a sequencing specificity in the cerebellum after tDCS, we did find activation of the bilateral putamen. The basal ganglia, including the putamen, have been associated with sequential processing (Baetens et al., 2020; Janacsek et al., 2020). It is plausible that the putamen may play a larger auxiliary role in sequencing during tDCS, while cerebellar activation is involved only for social processing during our task. While the exact mechanisms underlying the putamen's auxiliary function in this process remain speculative, a previous study reported communication between the putamen and the dentate nuclei in the cerebellum (Hoshi et al., 2005). Future studies could investigate the functional connectivity between the cerebellum and the basal ganglia, and their involvement in sequencing during predictive processes and non-invasive neurostimulation. Fourth, we did not measure baseline activation within our cerebellar ROI, because internal fMRI baseline activation typically reflects activation of the whole brain, and is thus influenced by any changes due to stimulation in any brain area. This renders the use of a baseline questionable. Nevertheless, we recognize that our current design may lack sensitivity to intraindividual differences. Future investigations should integrate initial assessments of mental, behavioral or physiological differences (Joshi et al., 2023; Schutter et al., 2023), and consider within-subject designs to provide a more comprehensive understanding of individual responses to stimulation.
ConclusionOur study provides evidence showing that anodal tDCS has an excitatory effect on the posterior cerebellum and remote cerebral areas during Social Sequencing, and thus supports the causal involvement of the posterior cerebellum in predicting social action sequences. Through anodal stimulation, we increased activations in cerebellar Crus 2 and lobule IX, as well as in cerebral mentalizing regions, including the mPFC, TPJ, and precuneus during Social Sequencing. These findings highlight the specific role of the posterior cerebellum in social action sequence prediction and have implications for our understanding of social cognition and its neural underpinnings. Surprisingly, however, performance improved only for Non-social Sequencing, which may be due to ceiling effects in our neurotypical sample. Our findings require further investigations on potential therapeutic interventions targeting social cognition deficits observed in various neuropsychiatric disorders.
Ethical approvalThe study was approved by the Medical Ethics Committee at the Gent University Hospital, Belgium, where the study was conducted
Authors' contributionsNH conceptualized the present study. FVO supervised this study and coded the experiment. NH and QM did the data curation of the experiment and ML contributed. NH conducted the neurological formal analysis, while ML and NH organized and analyzed the behavioral data. NH wrote the the origional draft in consultation with FVO. All authors reviewed and edited the final manuscript.
FundingThis research was funded by the Strategic Research Program SRP57 awarded by the Vrije Universiteit Brussel to Frank Van Overwalle.
Availability of data and materialsAll requested (pseudonymized or anonymous) data are available upon request, excluding data that allow identifying individual participants. All manuals and code for processing the data is also available together with the data.
