


The course of socio-cultural transition can neither be aimless nor arbitrary, instead it requires a clear direction. A common goal of social species’ evolution is to move towards an advanced spiritual and conscious state. This study aims to develop a population-based algorithm on the basis of cultural transition goal. In this paper, the socio-cultural model based on a system thought framework could be used to develop a cultural evolution algorithm (CEA). CEA leverage four strategies, each consists of several search methods with similar thinking. Seven benchmark functions are utilized to validate the search performance of the proposed algorithm. The results show that all of the four strategies of cultural evolution algorithm have better performance when compared with relevant literatures.
Finally, the CEA was then applied to optimize two different reliability engineering problems, a Serial-Parallel System design and a Bridge System design. For the Serial-Parallel System design, the CEA achieved the exact solution with ease, and for the Bridge System design, the solution obtained by the CEA is superior to those from other literatures.
Most practical engineering systems are very complicated and can include a considerably large number of design variables n, where multiple local minima exist. This has limited the use of traditional optimization methods based on mathematical programming. New optimization methods mimicking evolution, animal behavioral rules of natural ecology, mechanisms of human culture in social sciences were hence developed in order to efficiently solve complicated engineering design problems. Whilst gradient-based algorithms can rapidly find a local optimum solution, metaheuristic algorithms inspired based on evolution, biology, zoology, astronomy, electromagnetism, social sciences, music, etc have global optimization capabilities. Examples of metaheuristic optimization algorithms are: Genetic Algorithms (GA) [1, 2], Particle Swarm Optimization (PSO) [3, 4], Ant Colony Optimization (ACO) [5], Differential Evolution [6, 7], Swarm Intelligence [8, 9], Electromagnetic-like algorithm (EM) [10], Harmony Search Optimization [11], Big Bang-Big Crunch [12], Charged System Search [13], Hunting Search [14], and Firefly Algorithm [15].
Holland proposed the genetic algorithm reproducing the Darwin’s evolution theory based on the survival of the fittest. Later in the same year, De Jong [16] applied GA to optimization problems. Goldberg [17] coded the basic GA implementation by imitating the mode of the biological gene string: (i) 0/1 binary codes were used to express variables; (ii) a fitness value evaluated following some criterion and then assigned to each individual; (iii) a population-based search was adopted.
In the evolution process, the rule of “survival of the fittest” was applied to individuals by performing simple operations on gene-string codes. The operators used to generate new populations were selection, crossover and mutation. The crossover operation creates a new generation of individuals by mixing gene strings. The mutation operation modifies genes in the string to provide the population with sufficient proliferation or diversification. When there are no optimization constraints and gradient information, the above-mentionedalgorithmissuitableforparallel computing. Goldberg [18] developed the Bit-string GA (BGA) to explore the global optimization. BGA had a robust global optimization capability but required too much computation time and was not very efficient in high-dimensional or high-accuracy problems. Furthermore, the Hamming distance between two adjacent decimal integers may become very large when expressed in binary codes.
Cultural Algorithm was proposed by Reynolds in 1994 [19]. It is one kind of population-based algorithm equipped with the concept of collective intelligence. The CA imitates the lineal evolution of socio-cultural transition, which prevailed in the 19th century, to be the main operation mechanism. First, this algorithm makes use of the database built by it to guide each cultural species’ search. It then improves the cultural species through evolution. Last, it acquires the optimal solution of the problem.
The scientific approach attempts to arrange phenomena in orderly categories, to recognize consistent interrelationships between them, to establish laws of regularities, and to make formulations that have predictive value. On the other hand, the historical approach research pathway is more concerned with the occurrence of phenomena in time and place, the uniqueness of each constellation, and the ethos or value systems that characterize culture areas [20]. The lineal evolutionism proposed by the culture researchers in the middle of 19th century, the multi-lineal evolutionism introduced by Steward in 20th century [20], and the sociobiology published by Wilson et al. all interpret the behaviors of socio-cultural transition from the point of view of natural science [21, 22].
Wilson and other socio-biologists also incorporated the logical thinking of natural science into social science, and then proposed socio-biologism to interpret the process of social cultural evolution in a more reasonable way. Socio-biologists bring genetic rules algorithm into the process of cultural transition. They consider that such behaviors as communication, infection, and learning among cultures are similar to the crossover and the mutation advocated by genetic theories. They also believe that the competition among cultures is just like that among species, and that new cultures equipped with competitive advantages will take the place of those with lower competitiveness to form a new cultural population. This echoes Steward’s multi-linealism [20] and the prediction of the course of cultural evolution transition.
However, the transition process of the cultural species will be infected by cultural species and led to different transition behavior. That is to say, the transition of cultural species belongs to one kind of group decision behavior. Among cultural species, there will be behaviors like mutual communication, mutual infection, and mutual learning. Based on this concept, cultural species will compare to, compete with, and replace each other to go through a series of socio-cultural transition processes.
In view of this, this study develops a population-based algorithm on the basis of cultural transition process. It generates new cultural species by using some modes that are the four ways: group consensus (or so-called mainstream value), individual study, innovative study, and self-improvement. Then from the four new cultural species generated respectively using the four ways, the best new cultural species will be acquired through competition. In this way, continuous innovation from generation to generation results in the best cultural species; that is, the global optimal solution to an optimization problem.
2Cultural Evolution Algorithm (CEA)This paper proposes a cultural evolution algorithm using Steward’s [20] socio-cultural integration theory as its system thinkings. The main difference from Reynolds’ [19] cultural algorithm is that the CEA aims to fit the phenomenon of socio-cultural transition, imitates the concept of diverse cultural population evolution, and includes such behaviors as communication, infection, and learning among cultural species. There are two mechanisms that map this system thinkings into information search scheme. They are the way of coding or describing an individual that represents a problem in a population and the population’s innovation mode. The cultural species’ evolution modes can be categorized into four types, group consensus (or so-called mainstream value), individual learning, innovative learning, and self-improvement. The corresponding mathematical models for these four evolutionary modes are described respectively as follows.
2.1Group consensus evolution mode (GCE)The group consensus of a cultural population exists in the core value of all strata of this cultural population. The characteristic index of the whole cultural population is given. Cultural species with poor competitiveness may learn from this characteristic and turn into new cultural species. If a mathematical model represents the group consensus of a cultural population, then the centroid of the cultural population is given. In the case that the reflection mode of the Nelder-Mead’s simplex method is adopted, two cultural species, Xh and Xl, areselectedrandomly from the cultural population and their competitiveness are compared to each other. Provided thatXlis better than Xh, and m cultural species are existed between Xl and Xh, then their centroid is

The bad cultural species Xh evolves into a new cultural species Xn along the direction of Xc−Xh.
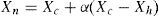
where α is called the learning coefficient.
2.2Individual learning evolution mode (IDL)Steward [20] mentioned that a culture would adopt a subculture’s characteristics due to contact. That is, a culture species with poor competitiveness Xh may learn a certain characteristic from a better culturespecies Xl, mergeitintoitsown characteristics, and evolve into a new culture that adapts better to the environment in the real society to reach the goal of continuing to exist for fear of being submerged in the mighty torrent of history to make the old cultural species throw far away the old thinking framework and become a brand-new cultural species. If the expansion mode of the simplex method is used to simulate the process, the worst cultural species Xh may evolve into a new cultural species Xn along the direction of Xl–Xh. Its mathematical expression is:
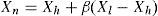
where β is called the breakthrough learning coefficient, which mostly is set to a larger number.
2.3Innovative learning evolution mode (INL)Steward [20] mentioned that a new culture could be created from a sub-cultural group’s characteristics due to contacting with them. That is, any one cultural species may learn some characteristics from several diverse cultural species and evolve into a new cultural species. Such cultural evolution mode is very common in the culture transition of the real socio-culture. A cultural species itself will learn other cultures’ particular behaviors under the influence of propagation effect in order to make up its own insufficiency, promote its adaptability to the environment, and increase its competitiveness. This paper simulates this process using the mutation strategy of the differential evolution algorithm.
Any one mutation strategy proposed in the differential evolution algorithm can be used to simulate the innovative learning evolution mode. This paper only adopts two mutation strategies, DE/rand/1(DE1) and DE/best/2(DE2). The difference between these two strategies is whether or not a cultural species will include the cultural species with best competitiveness among its leaning objects when it is learning other culture’s characteristics. They are described as follows:
A.DE/rand/1 (DE1) :
The mathematical formula of DE/rand/1 is

Three different cultural species Xi, Xj and Xk are selected randomly from the cultural population. By utilizing the combination of them, another new cultural species Xn is generated. It can also be explained in this way: the cultural species Xi transmutes itself into a new culture Xn by learning the characteristics betweenXjand Xk. where ρm is called the innovative learning coefficient, which is set to a uniformly random number 0~1.
B.DE/best/2 (DE2) :
Its mathematical formula is

From the cultural population, four cultural species are chosen randomly. They are Xi, Xj, Xk, and Xl. The best cultural species Xbest in the cultural population is also included as a learning object and transmutes itself into a new culture Xn.
2.4Self-improvement evolution mode (SIE)Kroeber [23] mentioned that it is very possible that cultural relationship or cultural mode is naturally developed from the inside out instead of being directly adopted. In other words, a culture has the ability to examine itself. Every culture itself, in order to fit the environment better and promote the competition advantage, constantly introspects, ponders, and settles. Its objective is only to avoid been eliminated from the competition with other new cultures or cultures with more advantages. Therefore, cultures continue to improve themselves and break though from the inside out. This paper simulates this process by using simplified Nelder-Mead’s simplex method (SSM) and Hooke-Jeeves direct search method (HJ) with limited search iterations.
A. Simplified Neider and Mead’s Simplex Method (SSM)
Select a cultural species Xh from a cultural population at random and calculate Xc, the centroid of all the cultural species (suppose there are nh) which are better than Xh, and then evolves a new cultural species Xn along the direction from this bad point to the centroid.

The cultural species Xh is to be evolved into a new cultural species Xn along the direction of Xc–Xh. Its mathematical equation is as below:

B.Hooke-Jeeves Direct Search Method (HJ)
Hooke-Jeeves direct search method makes a random selection of a cultural species from a cultural population as the starting point for iteration search. In this paper, the number of iteration is 20.
2.5Procedure process of cultural evolution algorithmThe proposed cultural evolution algorithm in this paper is presented by associating the approaches of natural science with the thinking of social science. The procedure process of the cultural evolution algorithm will be described as follows:
Step 1 : Create an initial cultural population:
Given cultural population size, number of replacements, and maximum number of generations, an initial cultural population is uniformly and randomly created. Calculate every cultural species’ fitness and sort them in numerical order.
Step 2: The proceeding of the cultural population evolution:
Two strategies is proposal and synchronously active in this step.
- (1)
Reserve elitist cultural species: from the cultural population, the assigned number of best cultural species is reserved as the elitist cultural species.
- (2)
Cultural species evolution: a cultural species are randomly selected from the cultural population using roulette wheel selection. After that, evolve it into four new cultural species by using four evolution modes respectively. Then find out the best new cultural species by comparing them with one another and eliminate the rest three. New cultural species are continued generating until the assigned number of innovations is reached.
Step 3: Merge cultural population:
All evolved cultural species and the elitist cultural species is merged from the former generation into a new generation of cultural population.
Step 4: Stopping criterion:
If the assigned maximum number of generations is reached, stop evolution, and then stop searching. Thus, the best cultural species are selected as the optimal solution; otherwise, one has to skip to Step 2 and evolve the next generation.
The parameter definitions of the cultural evolution algorithm are as follows:
- (1)
Cultural population size: the number of the cultural species in the initial cultural population. It means the same as the population size in genetic algorithms.
- (2)
Number of innovations: the number of cultural species to be innovated. For example, the population consists of 10 cultural species. The number of innovations is set to 7. Then the new population has 7 new cultural species and the reserved 3 better ones. It is similar to the generation gap rate and reserve rate of genetic algorithms. It can also be represented as 70%, namely 70% of the population size is the number of innovations.
- (3)
Number of generations: as the number of innovations reaches the assigned number of the cultural species, it means one generation evolution is done. If the number of generations is set to 100, it represents the whole population will evolve 100 times.
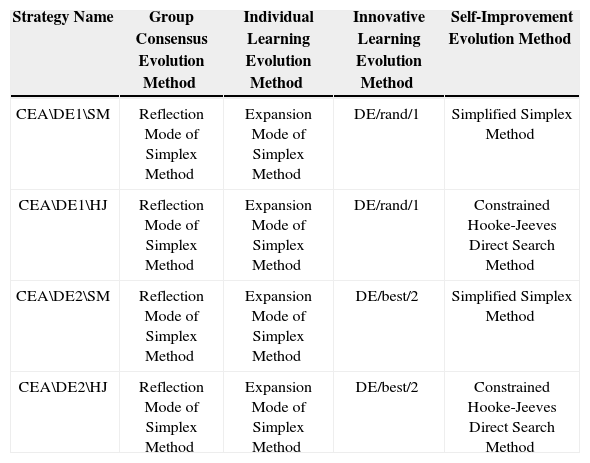
As shown in Table 1, the cultural evolution algorithm consists of four evolution modes: group consensus, individual learning, innovative learning, and self-improvement. Among them, the innovative learning mode and the self-improvement mode each are simulated using two different methods, while each of the rest uses one method. In this work, four strategies of this algorithm are proposed to be examined.
Analyze Table of the Strategies of Cultural Evolution Algorithm.
| Strategy Name | Group Consensus Evolution Method | Individual Learning Evolution Method | Innovative Learning Evolution Method | Self-Improvement Evolution Method |
|---|---|---|---|---|
| CEA\DE1\SM | Reflection Mode of Simplex Method | Expansion Mode of Simplex Method | DE/rand/1 | Simplified Simplex Method |
| CEA\DE1\HJ | Reflection Mode of Simplex Method | Expansion Mode of Simplex Method | DE/rand/1 | Constrained Hooke-Jeeves Direct Search Method |
| CEA\DE2\SM | Reflection Mode of Simplex Method | Expansion Mode of Simplex Method | DE/best/2 | Simplified Simplex Method |
| CEA\DE2\HJ | Reflection Mode of Simplex Method | Expansion Mode of Simplex Method | DE/best/2 | Constrained Hooke-Jeeves Direct Search Method |
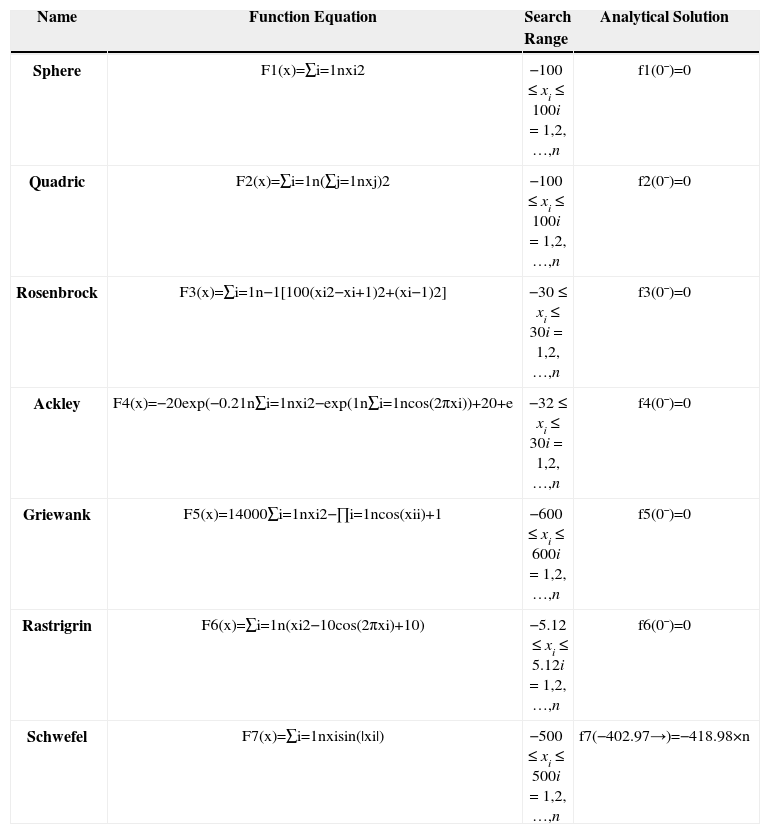
In this paper, seven benchmark functions from [24, 25, 26] are shown in Table 2. Among them, F1(X)-F3(X)areuni-modalfunctions, while F4(X)-F7(X) multi-modal functions. All the global optimal solutions to the first 6 benchmarks functions are zeroes, while for F7(X) the global optimal solution locates at the left bottom corner of search domain. The dimensionalities of each test function are 100. We take 50 different runs for all test functions.
Seven benchmark functions.
| Name | Function Equation | Search Range | Analytical Solution |
|---|---|---|---|
| Sphere | F1(x)=∑i=1nxi2 | −100≤xi≤100i=1,2,…,n | f1(0¯)=0 |
| Quadric | F2(x)=∑i=1n(∑j=1nxj)2 | −100≤xi≤100i=1,2,…,n | f2(0¯)=0 |
| Rosenbrock | F3(x)=∑i=1n−1[100(xi2−xi+1)2+(xi−1)2] | −30≤xi≤30i=1,2,…,n | f3(0¯)=0 |
| Ackley | F4(x)=−20exp(−0.21n∑i=1nxi2−exp(1n∑i=1ncos(2πxi))+20+e | −32≤xi≤30i=1,2,…,n | f4(0¯)=0 |
| Griewank | F5(x)=14000∑i=1nxi2−∏i=1ncos(xii)+1 | −600≤xi≤600i=1,2,…,n | f5(0¯)=0 |
| Rastrigrin | F6(x)=∑i=1n(xi2−10cos(2πxi)+10) | −5.12≤xi≤5.12i=1,2,…,n | f6(0¯)=0 |
| Schwefel | F7(x)=∑i=1nxisin(|xi|) | −500≤xi≤500i=1,2,…,n | f7(−402.97→)=−418.98×n |
The parameter settings are: population size is set to 150, maximum number of generations is given to 100. The favgand fb are the average value and the best value over 50 runs per test function, respectively. Two learning coefficients α=0.618, and β=10. The platform is AMD Athlon 3000+with 1GB of memory, Windows XP Professional SP2. The CEA is implemented in Fortran with single precision.
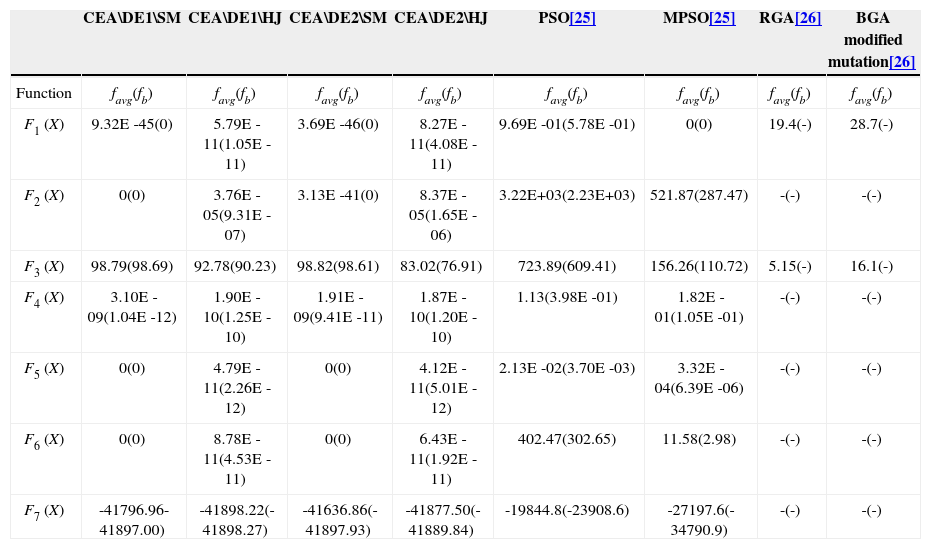
3.2Benchmark functions and parameter settingIn order to understand the search capability of the four strategies of the proposed cultural evolution algorithm, experiments have been done on above-mentioned seven benchmark functions. The results (100-dimensional) in reference [25] are shown Table 3 below.
Performance comparisons among CEAs, PSO and MPSO on 100-dimensional seven benchmark.
| CEA\DE1\SM | CEA\DE1\HJ | CEA\DE2\SM | CEA\DE2\HJ | PSO[25] | MPSO[25] | RGA[26] | BGA modified mutation[26] | |
|---|---|---|---|---|---|---|---|---|
| Function | favg(fb) | favg(fb) | favg(fb) | favg(fb) | favg(fb) | favg(fb) | favg(fb) | favg(fb) |
| F1 (X) | 9.32E -45(0) | 5.79E -11(1.05E -11) | 3.69E -46(0) | 8.27E -11(4.08E -11) | 9.69E -01(5.78E -01) | 0(0) | 19.4(-) | 28.7(-) |
| F2 (X) | 0(0) | 3.76E -05(9.31E -07) | 3.13E -41(0) | 8.37E -05(1.65E -06) | 3.22E+03(2.23E+03) | 521.87(287.47) | -(-) | -(-) |
| F3 (X) | 98.79(98.69) | 92.78(90.23) | 98.82(98.61) | 83.02(76.91) | 723.89(609.41) | 156.26(110.72) | 5.15(-) | 16.1(-) |
| F4 (X) | 3.10E -09(1.04E -12) | 1.90E -10(1.25E -10) | 1.91E -09(9.41E -11) | 1.87E -10(1.20E -10) | 1.13(3.98E -01) | 1.82E -01(1.05E -01) | -(-) | -(-) |
| F5 (X) | 0(0) | 4.79E -11(2.26E -12) | 0(0) | 4.12E -11(5.01E -12) | 2.13E -02(3.70E -03) | 3.32E -04(6.39E -06) | -(-) | -(-) |
| F6 (X) | 0(0) | 8.78E -11(4.53E -11) | 0(0) | 6.43E -11(1.92E -11) | 402.47(302.65) | 11.58(2.98) | -(-) | -(-) |
| F7 (X) | -41796.96-41897.00) | -41898.22(-41898.27) | -41636.86(-41897.93) | -41877.50(-41889.84) | -19844.8(-23908.6) | -27197.6(-34790.9) | -(-) | -(-) |
The results obtained by applying the four strategies proposed in this paper to the seven 100-dimensional benchmark functions reveal that all of them have great performances. Especially in the case of the five test functions, the Sphere F1(X), the quadric F2(X), the Ackley F4(X), the Griewank F5(X), and the Rastrigrin F6(X), all of their analytical solutions are found. As for the Rosenbrock F3(X), since the shape of the area near its global optimal solution is a banana-shaped valley, it’s hard for the search for cultural species to get into this area. All strategies have the same effects save for the CEA\DE2\HJ strategy that has a slightly better result. For the Schwefel F7(X), while none of the four strategies is able to find the global optimal solution, they all manage to find solutions very close to it.
Both of the CEA\DE1\HJ and the CEA\DE2\HJ strategies utilize the Hooke-Jeeves direct search method. The accuracy of the results of the four functions, the Sphere function, the Quadric function, the Griewank function, and the Rastrigrin function, is inferior to the CEA\DE1\SM and the CEA\DE2\SM. For the Ackley function, the results of the four strategies are almost the same. For both the Rosenbrock function and the Schwefel function, the CEA\DE1\HJ and the CEA\DE2\HJ are superior to the other two strategies. The CEA\DE2\HJ is the best. But it only has more effect on the result of the Rosenbrock function. Its effect on the other functions is limited. That is because the algorithm on the Rosenbrock function needs the local search mechanism which has directionality and provides versatile chances.
3.2.2Convergence performance:It can be seen from the convergence charts of the seven 100-dimensional test functions as shown in Fig. 1 to 7 that less number of generations are required to reach a very good result. Within about 20 generations, a solution very close the global optimal solution can be found. What is more, the convergence processes of the four strategies are almost the same. This indicates that the search performances of the DE1, DE2, SM and HJ, which are adopted by the four strategies of the proposed algorithm, have tiny difference. In the mean time, it also reveals that the proposed algorithm utilizing the logic thinking of socio-cultural transition phenomenon is robust.

Except the fact that for the quadric function, the CEA\DE1\HJ and the CEA\DE2\HJ are slightly inferior to the other two versions in the initial stage of the search, both of them perform better when applied to other functions. In the case of the four functions, the Sphere function, the Rosenbrock function, the Griewank function, and the Schwefel function, the population even gets into the area near the global optimal solution just in the second generation.
3.3Comparison between CEA and other algorithms


By using 7 benchmark functions with 100 variables, the search performances of the proposed CEA methods are compared with those of the two PSOs, RGA and BGA methods from other literatures [25,26].
All of the algorithms in this paper are developed in the Fortran programming language, adopting single precision variables, and they are compiled utilizing a PowerStation compiler. Particle swarm optimization (PSO) uses three quantities - the speed of the particle itself, the best position of the individual, and the best location of the group - to determine the direction in which the particle moves. The memory particle swarm optimization (MPSO) proposed in literature [25] is based on the PSO with a strategy that uses external memory to store better particles and replace worse particles in every generation. The number of maximum generations to be searched is 3,000. The RGA is original and the BGA was modified mutation operator [26]. Tables 3 show the results collected by applying all of the algorithms to the seven benchmarked functions with 100 variables. The comparisons are made as follows:
The parameters used literatures with another algorithms in Table 3 are: PSO[25], MPSO [25] parameters: swarm size=25 particles, inertia weight W=0.95~0.6, learning factors C1=C2=2.0, maximum number of generations=3000, and average value is the average of the 10 optimal values generated from 10 trials independently.
From Table 3, the search performances of the proposed four algorithm strategies can be found and their comparisons with other algorithms are discussed as follows.
From the comparisons of the results summarized in Table 3, obviously all the strategies proposed in this paper are better than the references [25, 26]. Especially for the Schwefel function, each of the proposed four strategies can find a solution near to the global optimal solution. As for the Sphere function, the exponents of the data are slightly worse than MPSO but it is very close to the global optimal solution. For the other function, they are not only better than MPSO but also better than RGA and BGA.
Based on the results in Tables 3, collected from testing the 100-dimensional functions, the robustness of the solutions of the proposed CEAs does not deteriorate as the number of dimensions increases. This result shows that the algorithmic frames of the CEA is correct when dealing with high-dimensional problems, and that they have the features of fast convergence and robustness.
3.4Reliability Engineering ProblemsTwo non-linear system reliability allocation problems [27, 28] are utilized to evaluate the search performance of the proposed CEA and the comparisons with these results are also made.
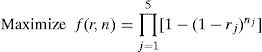
3.4.1Serial-Parallel SystemThis system shown in Fig. 8 is composed of 5 subsystems in series. Each subsystem consists of two to three components in parallel. This serial-parallel system is going to deal with a mixed integer nonlinear programming problem. The goal of this problem is to maximize the system reliability; accordingly, it is necessary to allocate each subsystem’s number of components and component reliability. Its mathematical model is as follows:


1≤nj≤10 integer, j=1,…,5
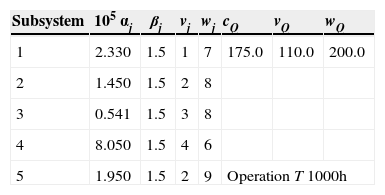
It also has three nonlinear and non-separable constraints,g1tog3. The system reliability is RS=∏j=1nRj, and the system unreliability Qs, where Rs+Qs=1. The subsystem reliability is Rj=Rj(nj)=1−Qj, and the subsystem unreliability Qj(nj)=(1−rj)nj, where nj is the number of the components used by subsystem j, and rjis the reliability of the components used by subsystem j. The C(rj)in g1(r,n)represents the cost of the components used in subsystem j. It is expressed by C(rj)=αj[−T/ln(rj)]β. The related parameters and resource constraints are shown in Table 4.
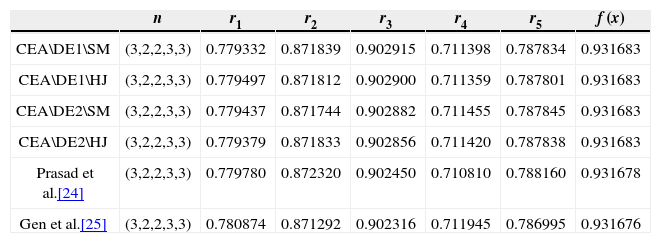
The cultural species’ population size adopted in this paper is 80, and the maximum number of generations is 300. The results of the CEA are compared with those of the references as shown in Table 5.
| n | r1 | r2 | r3 | r4 | r5 | f (x) | |
|---|---|---|---|---|---|---|---|
| CEA\DE1\SM | (3,2,2,3,3) | 0.779332 | 0.871839 | 0.902915 | 0.711398 | 0.787834 | 0.931683 |
| CEA\DE1\HJ | (3,2,2,3,3) | 0.779497 | 0.871812 | 0.902900 | 0.711359 | 0.787801 | 0.931683 |
| CEA\DE2\SM | (3,2,2,3,3) | 0.779437 | 0.871744 | 0.902882 | 0.711455 | 0.787845 | 0.931683 |
| CEA\DE2\HJ | (3,2,2,3,3) | 0.779379 | 0.871833 | 0.902856 | 0.711420 | 0.787838 | 0.931683 |
| Prasad et al.[24] | (3,2,2,3,3) | 0.779780 | 0.872320 | 0.902450 | 0.710810 | 0.788160 | 0.931678 |
| Gen et al.[25] | (3,2,2,3,3) | 0.780874 | 0.871292 | 0.902316 | 0.711945 | 0.786995 | 0.931676 |
From the comparisons in Table 5, for this nonlinear serial-parallel system reliability optimization problem, all the four algorithm strategies of the proposed cultural evolution algorithm have pretty good effects. The optimization results are completely the same, and are all slightly superior to the references [27, 28].
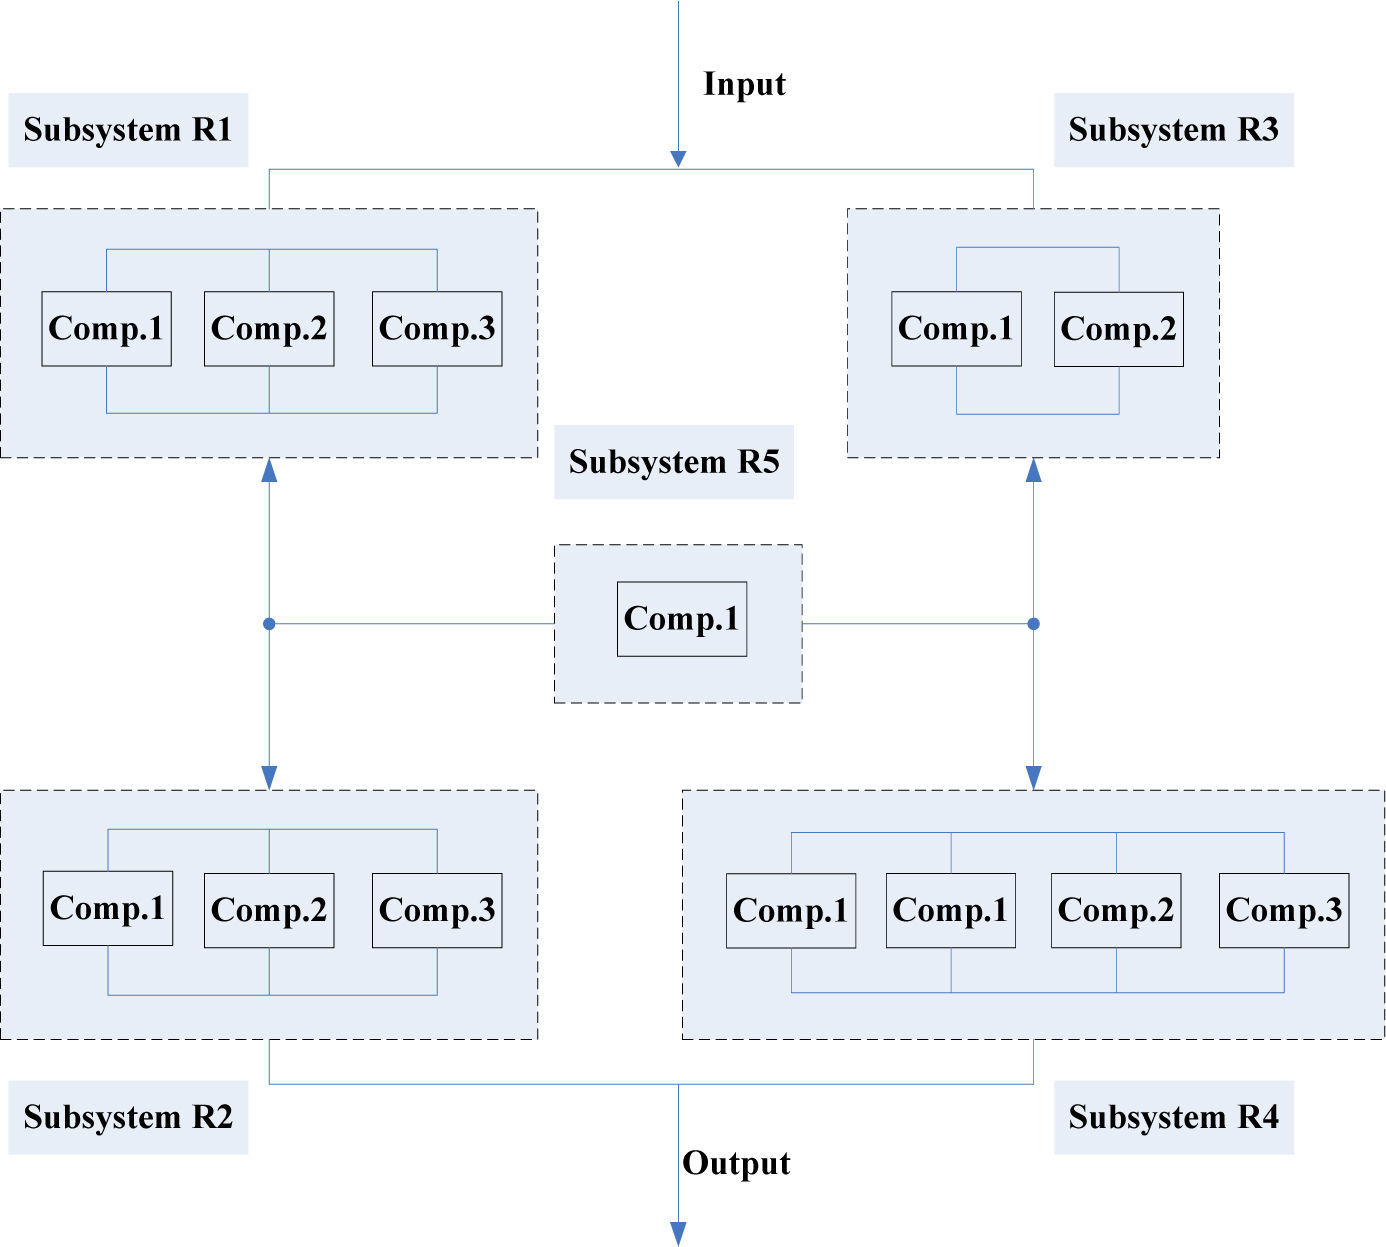
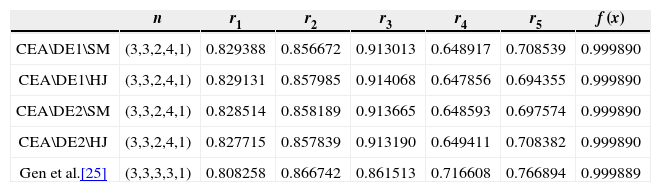
3.4.2Bridge SystemThe bridge system shown in Fig. 9 is made up of five subsystems R1 to R5. Each subsystem is composed of 1 to 4 components in parallel. Again, this problem is regarded the system reliability allocation and optimization. The objective is to maximize the system reliability. The constraints of the bridge system are the same as the serial-parallel system in the above section. The objective function is as follows:

Maximize

algorithm should be incorporated in order to compare the search performances with one another.
Comparisons of results among CEAs and reference [28].
| n | r1 | r2 | r3 | r4 | r5 | f (x) | |
|---|---|---|---|---|---|---|---|
| CEA\DE1\SM | (3,3,2,4,1) | 0.829388 | 0.856672 | 0.913013 | 0.648917 | 0.708539 | 0.999890 |
| CEA\DE1\HJ | (3,3,2,4,1) | 0.829131 | 0.857985 | 0.914068 | 0.647856 | 0.694355 | 0.999890 |
| CEA\DE2\SM | (3,3,2,4,1) | 0.828514 | 0.858189 | 0.913665 | 0.648593 | 0.697574 | 0.999890 |
| CEA\DE2\HJ | (3,3,2,4,1) | 0.827715 | 0.857839 | 0.913190 | 0.649411 | 0.708382 | 0.999890 |
| Gen et al.[25] | (3,3,3,3,1) | 0.808258 | 0.866742 | 0.861513 | 0.716608 | 0.766894 | 0.999889 |