


A dynamic self-assessment of performance on supply chains operating in emerging markets is proposed. Based on well-established key performance indicators (KPI), this paper provides a decision support aid. Although it has been validated in the automotive industry, the standardized model’s approach makes it applicable to other industries. It is the result of a large literature review and identification of best practices from the automotive industry in which the lack of dynamic tools to evaluate logistics performance of suitable supply chains to the current competitive exchange rate was detected. Developed under a system dynamics approach (DS), the model analyzes different scenarios taking into account KPI and its dynamic relationships. The results obtained were validated through the statistical technique of design of experiments (DOE). This model also considers the specific features of the automotive operations in emerging countries as well as their importance in the future development of the manufacturing industry. In this context, the tool exposed is a key backup to decision making and to dynamically evaluate the variables with major influence on manufacturing supply chains. As a conclusion, findings are discussed and future researches are presented.
Se propone un modelo para la autoevaluación dinámica del desempeño de cadenas de suministro operando en mercados emergente. Con base en indicadores de desempeño ampliamente establecidos en las operaciones industriales, se expone una herramienta de ayuda a la toma de decisiones. Aunque ha sido validado en el contexto de la industria automotriz, su enfoque estandarizado hace que sea aplicable a otras industrias. El modelo es el resultado de una amplia revisión de la literatura y de prácticas de la industria en donde se detectó la falta de herramientas dinámicas para evaluar el desempeño de las cadenas de suministro adecuadas a la evolución competitiva actual. El modelo, desarrollado bajo un enfoque de dinámica de sistemas (DS), analiza diferentes escenarios, teniendo en cuenta las variables dinámicas. Los resultados obtenidos fueron validados a través de la técnica de diseño de experimentos (DE). Este modelo también considera las características específicas de las operaciones automotrices en países emergentes, así como la importancia de estos mercados en el desarrollo futuro de la industria automotriz. En este contexto, la herramienta expuesta es un soporte clave para la toma de decisiones y para evaluar de forma dinámica las variables con mayor influencia en las cadenas de suministro automotrices. Como conclusión, los resultados son discutidos al mismo tiempo que se presentan futuras investigaciones.
For many years, Mexico has been one of the most competitive places for investment in the manufacturing industry, mainly for automotive corporations in quest of new marketplaces and strengthening their presence in America. The country’s geographical location and 44 international free trade agreements provide an important platform to deliver products from Mexico to many countries in the world. Recently, Mexico has been targeted by automotive companies as Audi, Mazda, Honda, Fiat and Chinese companies as a key location in their internationalization strategy (Deloitte, 2010; OICA, 2010).
Essentially, the automotive sector has a significant rate of product innovation because of the fierce competition between manufacturers for a mature market and importance to position themselves within the new trends in customer demand for the coming years (Deloitte, 2010). The presence of this industry has grown strongly in countries such as USA, Japan, Germany, France and Italy, mature markets that have had so far a major role in this industry, defining the policies of the performance of this industry (Humphrey, Memedovic, 2003). However, a growth in emerging economies like South Korea, China, India, Brazil, Mexico, Thailand and Malaysia has been seen in recent years, which will be a reference to this sector in the future (Mukherjee, Sastry, 1996; Langley, 2012). The evolution of this industry is also reflected in their production systems, which have gone from “make-to-stock”, where standardization of the products was the main goal, to “make-to-order”, which seeks efficiency in production systems, paying attention to changing market demands (Meyr, 2004). This will certainly impact the development of their innovation strategies, manufacturing processes and supply chain performance. In this context, the purpose of this paper is to provide a decision support aid through a dynamic self-assessment of the performance tool. To this end, we have identified well-established key performance indicators (KPI) and their dynamic relationships in order to facilitate the dynamic measurement of their impact on supply chain performance.
This article is structured as follows: Section 2 presents the importance of supply chains, highlighted as a success factor in the automotive sector. Section 3 provides the model description and its casual loop diagrams and equations that support the dynamic hypothesis. Section 4 exposes the system dynamics (SD) simulation and the validation process using design of experiments. Finally, in Section 5, conclusions as well as future research work will be presented.
2BackgroundIn a changing economic world, new performance processes, machineries and manufacturing systems will need new methods and decision support aids. Furthermore, innovative tools are needed in support of customization and “make-to-order” strategies in automotive, electronics and aerospace industries. Dynamic measuring systems for exact and time efficient measurement combined with adaptive automated tool-control are a possible solution to support just-in-sequence approaches in the near future (Wagner, Silveira-Camargos, 2011). Therefore, as manufacturing develops global capabilities, the core of competition will no longer be only between supply chains but between regional industrial clusters too. In this sense, a wider logistics concept is proposed by Cedillo-Campos (2012) which is called supply chain clustering. It links the advantages of theoretical and practical developments in the supply chain area as well as in the industrial cluster domain from a geographical standpoint. It is a new management and engineering concept to improve business cluster based on supply chain competitiveness from a global-local perspective. In sophisticated supply chain clustering systems such as Silicon Valley, regional competitiveness as well as supply chain performance are improved at a highest level (Saxenian, 1994; Cedillo-Campos and Pérez-Araos, 2010). Actually, the geographical component of supply chain will be more and more a key element of industrial competitiveness (Bhatnagar and Sohal, 2005; Rodriguez, 2012).
Furthermore, increased growth of the North American Trade Agreement (NAFTA) integration is expected based on supply chain flows boosted by the automotive industry and also by the electronic and aerospace industry. A “reverse globalization” is becoming a trend as firms back off from China to other countries such as Mexico for sourcing and manufacturing operations. Analysis from the Boston Consulting Group (BCG) identifies that the move offshore to China by U.S. corporations seeking lower labor costs may slow considerably over the next few years and even reverse path, as rising wages in China will make it more expensive to the U.S., when productivity gaps are factored in (SCD, 2011; 2012). The opportunity to organize inside the NAFTA area one of the largest regional manufacturing zones in the world exists; however, because of the intensification of operations, improving measurement of supply chain performance will be a critical issue for manufacturing companies.
Since demand and supply structures fluctuate, a manufacturing supply chain must be adjusted over the product life cycle if a business tries to continuously achieve dynamic competitiveness. In fact, a number of researchers have already studied supply chains and their importance regarding the competitive advantages for companies and regions (Cedillo-Campos, 2012; Saxenian, 1994; Bhatnagar, and Sohal, 2005; Rodriguez, 2012; Cedillo-Campos, Sánchez and Sánchez, 2006; Bhatnagar and Sohal, 2005).
In assembly industries, supply chain solution approaches are a key element to success because of the quantity of components, process and organizations needed to make a vehicle. Thus, it becomes a strategic issue for the performance and permanence of companies in a market that is increasingly globalized and competitiveness propagating uncertainty all along automotive supply chains (Duggan, 2008; Knemeyer, Zinn, Eroglu, 2009; Sánchez, Cedillo-Campos, Pérez, Martínez, 2011; Chopra and Meindl, 2012; Waters, 2003).
Even if it is not a new phenomenon, concluding solutions have not been proposed until now. In fact, Forrester (1961) conducted the first analysis, from a dynamic and comprehensive point of view, which was aimed to demonstrate the phenomenon of demand amplification and its impact on the links that make up the supply chain. Recently, Jimenez et al. (2002), Cedillo-Campos et al. (2008), and Sanchez et al. (2011) identified the close relationship generated between dynamic oscillations in production systems and its impacts on supply chain processes operating under emerging markets conditions. They demonstrated the importance of systemic approaches to improve supply chain performance. Because of the complexity of considering different interrelated variables within a dynamic supply chain, the combined use of the system dynamics approach supported by the statistical method of design of experiments (DOE) provides a highly reliable analytic tool. In fact, Kleijnen (1995) and GröBler et al. (2005) consider that this approach offers a middle ground between pure formal modeling, and empirical observations and experiments, with high reliability in the analysis.
2.1System dynamics methodologyIn our research, system dynamics was used as the application of feedback control systems to the supply chain field. The SD approach pursues to integrate the functional units of an organization into a whole system and deliver quantitative data for measuring and designing more effective supply chains. From a SD point of view, the performance of a supply chain results mainly from its organization structure where the organization structure includes tangible decision aspects about facility location or manufacturing processes, for instance, but more importantly, from the procedures and behaviors that govern organizational decision-making processes. This framework includes sources of amplification, time lags, and information feedback related to complex supply chain engineering (Roberts, 1978). In this research the structural orientation of system dynamics provides a better understanding of this complexity.
2.2Design of experimentsAs for design of experiments, it is a useful statistical tool for supply chain engineers faced with understanding the relation between numerous variables and one or more response variables in the context of optimizing a manufacturing process or redesigning a supply chain. Design of experiments is a valuable approach for leading the most effective experiments and understanding the outcomes using statistical procedures (Montgomery, 2012).
A key component of design of experiments is operationalization, which is the formal procedure that links scientific concepts to data collection. In this sense, operationalizations define measures or variables which are quantities of interest or which serve as the practical substitutes for the concepts of interest. In this research, design of experiments provides a significant balance of several features including generalizability, various forms of “validity”, practicality, and reduced cost of analysis.
3Model descriptionIn order to study complex system dynamics, causal diagrams are an essential element to establish the problem to be analyzed. According to Oliva (1996), the causal loop diagrams are the dynamic hypothesis that allows explaining how the structure of the system can modify its behavior. In this section, we establish the dynamic hypothesis of the proposed model, identifying the main feedback loops between the systems variables (KPI).
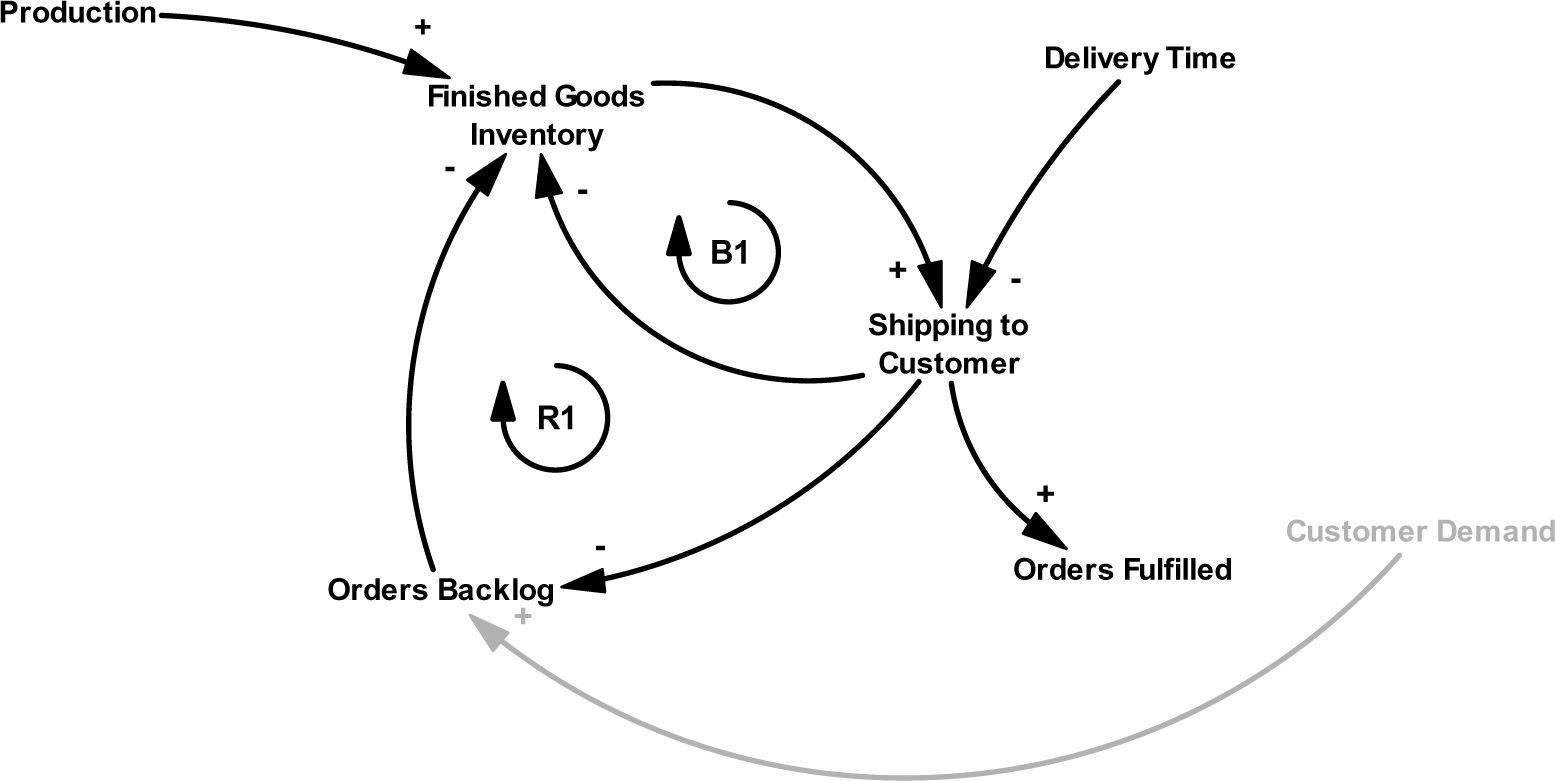
In our model, the distribution process (see Figure 1) has three important variables which are i) finished good inventory (FGI), ii) order backlog (OB), and iii) shipping to customer (SC). The loop (R1) that is composed by these variables, represents a behavior in which if the inventory of finished goods is greater or equal to the customer’s order that must be reached, it is sent to the customer so that each increase inventory of finished goods will increase the rate of shipments to customers and vice versa.

The balancing loop (B1) represents a performance where if the finished goods inventory increases, then the shipping rate will also increase, but if there is an increase in shipments, the inventory of finished goods will decrease. The equations for this subsystem are as follows:

Where w=1, …, 52. Thus, customer demand is received every week. However, since they must be waiting for being scheduled and produced, an OB is caused, which is calculated as follows:

Where CD is the Customer Demand and SC is calculated by the minimum value between OB and FGI, computed as follows:

At the same time, orders that have been produced (P) are shipped to FGI, which is calculated by

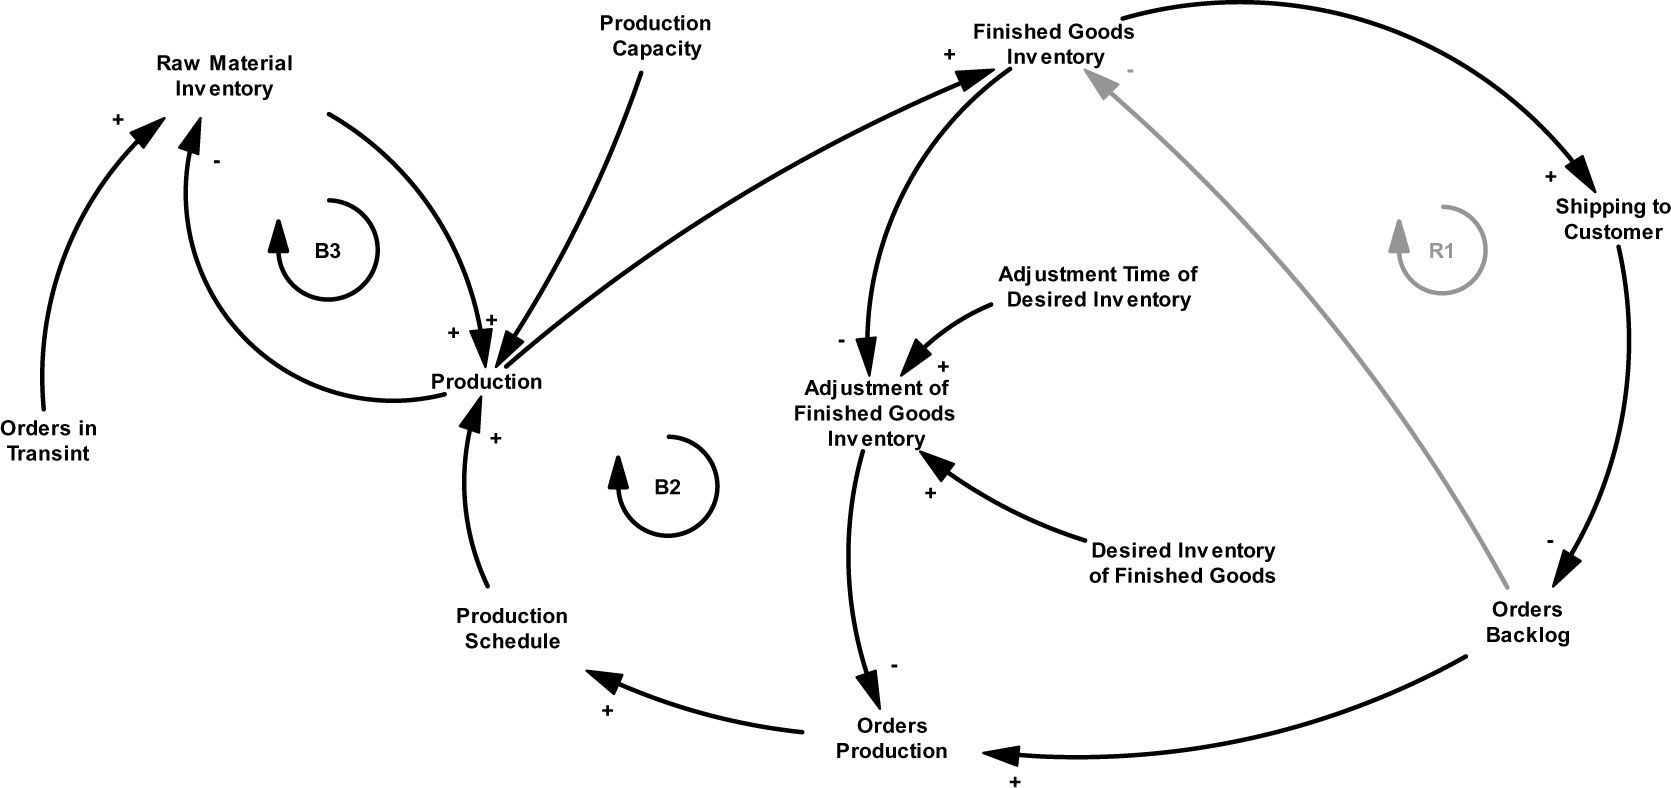
In the production process subsystem (see Figure 2), if the production rate is increased, the inventory of finished goods does as well. In addition, by increasing the inventory, the rate of shipments to customers will also be higher and thus may reduce the order backlog. However, an increase in outstanding orders would positively influence the order production, therefore, orders would increase in the queue and this, in turn, would positively influence in the same way the production (B2).

In the production process subsystem, the orders received are considered as order production (OP) which is calculated by the following equation:

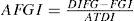
Production schedule (PS) allocates a level of priority to customer orders (1, 2 or 3), which is assigned according to a FIFO (first input, output first) queuing process technique by ordering the process by first customer’s order arrived (priority 1), first-served. In this sense, adjustment of finished good inventory (AFGI) serves to correct the difference between FGI and the desired inventory of finished goods (DIFG) in a period of time which is allocated by adjustment time of desired inventory (ATDI). The calculation of this adjustment is realized by the following expression:
Thus, production (P) takes the minimum value between RMI, PC and PS and is calculated by

Where PC is the production capacity, RMI is the raw material inventory and PS is the production schedule.
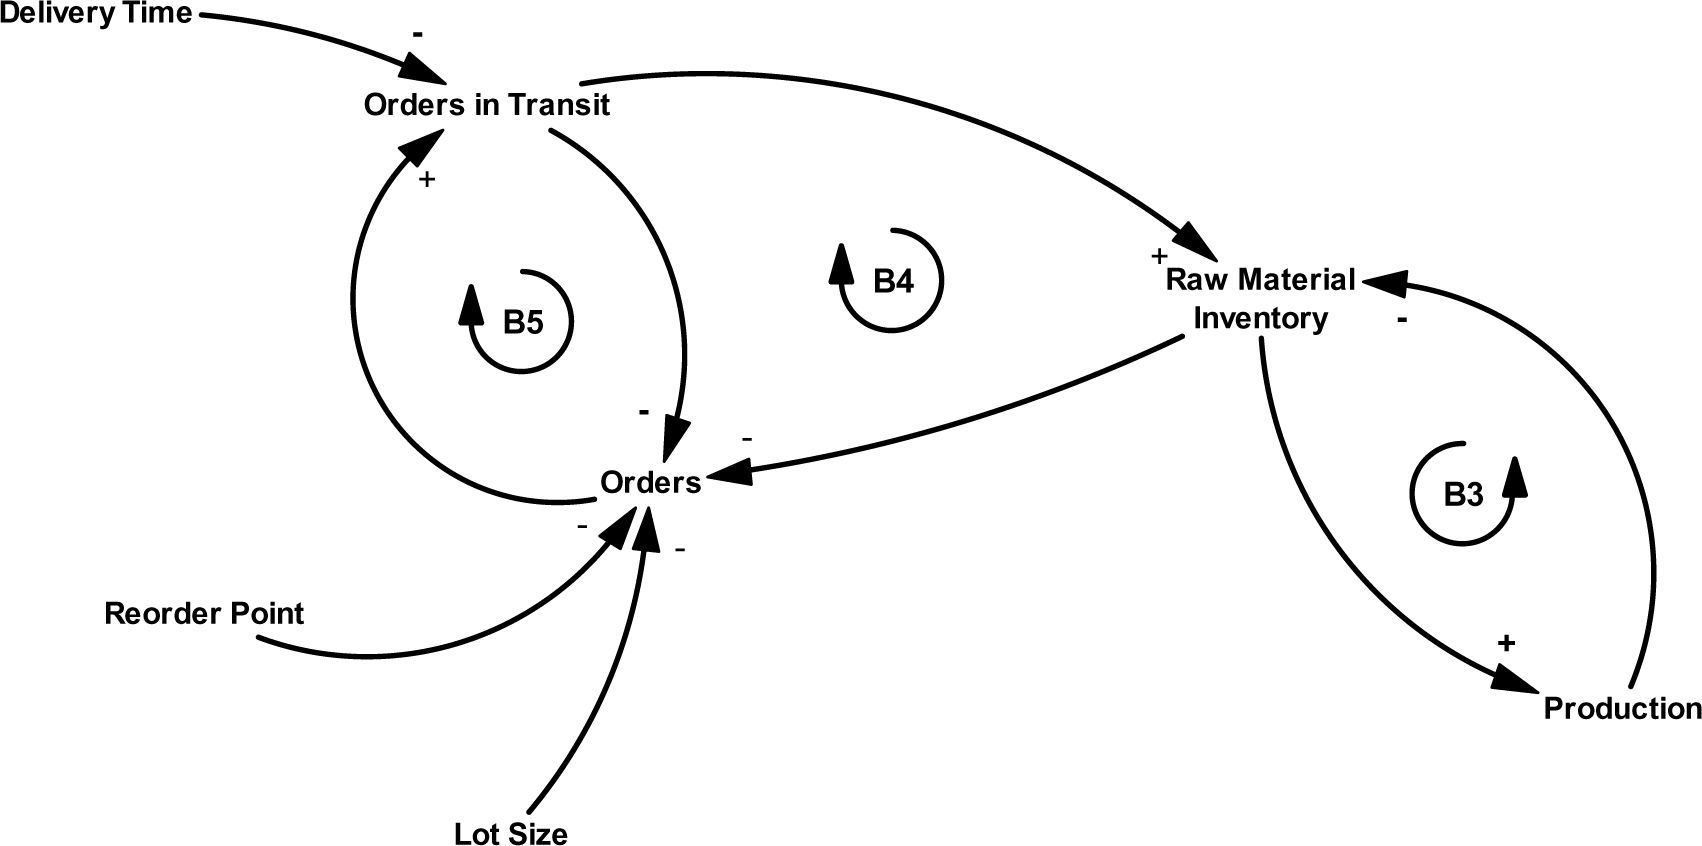
In the procurement process (see Figure 3), the system behaves in such a way that if the inventory increases, then compliance with production orders increases, but this increase in production orders influences the decreasing inventory of raw material (B3). Likewise, if production orders increase, then the number of orders made to suppliers increases (B4), and this will increase traffic orders. If orders in transit increase, the inventory level of raw material will increase, impacting the supply to production orders in the same way (B5).

The RMI is calculated as follows:

Where OT is orders in transit which is influenced by the delivery time (DT) and orders, which are generated by the following equation:
4Analysis and results4.1Evaluation of the proposed model
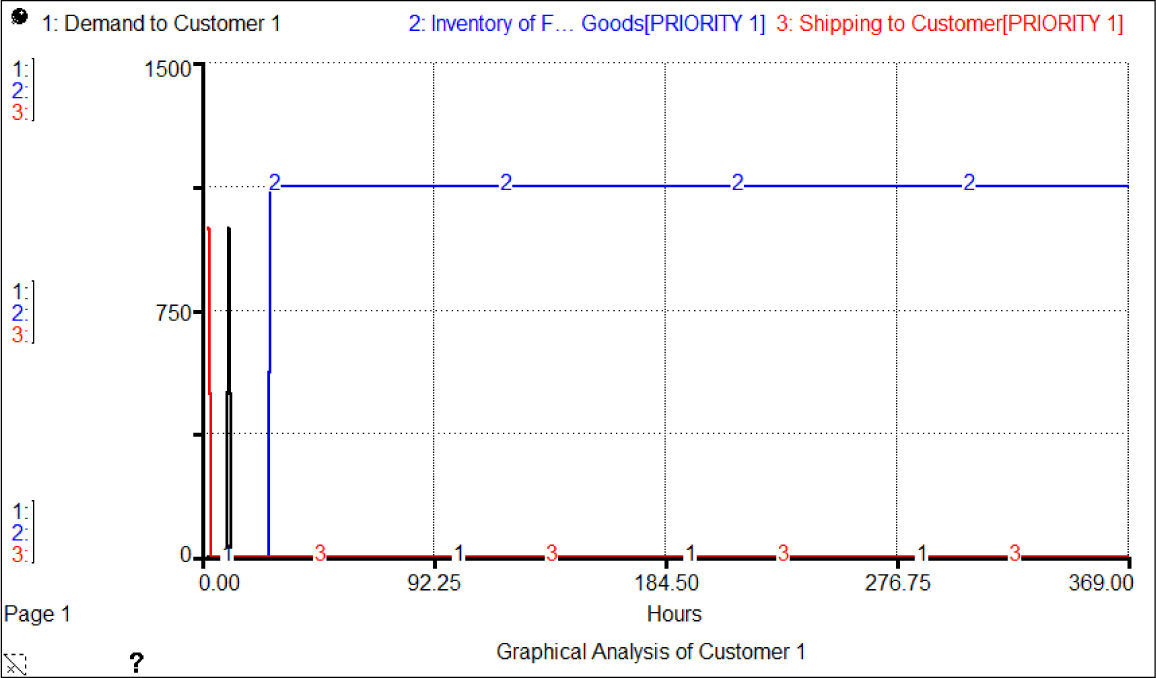
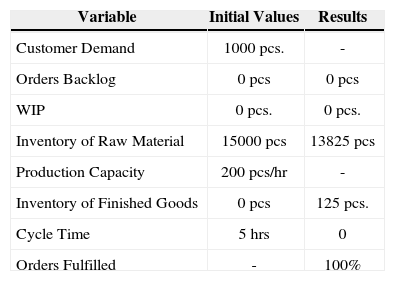
The implementation of the system was validated within a key automotive company with global operations. For the first scenario, for testing the system, 1,000 pieces of customer #1 were scheduled at 7:00 a.m. The scheduled delivery date was two days (48 hours). In this case, customer #2’s and #3’s orders were not scheduled.
Table 1 shows the initial data and the results obtained in the simulation of this scenario. The simulation time horizon was one week (168 hours). Orders were fulfilled in 100% of the cases and demand of customer # 1 was served.
Initial Values for Customer 1’s Demand.
| Variable | Initial Values | Results |
|---|---|---|
| Customer Demand | 1000 pcs. | - |
| Orders Backlog | 0 pcs | 0 pcs |
| WIP | 0 pcs. | 0 pcs. |
| Inventory of Raw Material | 15000 pcs | 13825 pcs |
| Production Capacity | 200 pcs/hr | - |
| Inventory of Finished Goods | 0 pcs | 125 pcs. |
| Cycle Time | 5 hrs | 0 |
| Orders Fulfilled | - | 100% |
Figure 4 shows an increase at the moment the request is scheduled. The inventory behavior of finished goods is also analyzed when it is sent to the customer, and 125 pieces remain in the inventory of finished goods.
4.1Validation based on design of experiments
Authors such as Forrester and Senge (1980), Barlas (1996), Kleijnen (1992) and Umeda and Jain (2004) suggest the application of techniques such as sensitivity analysis, linear regression and design of experiments for the validation of systems developed in system dynamics. However, it is important to note that few authors validate their systems using these techniques given that most of them validate the system according to the system structure and behavior.
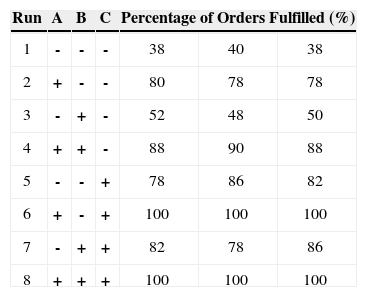
Table 2 presents data obtained for the development of the design of experiments, of which three replicas were made. The factors considered were
(A) Inventory of Finished Goods: 1000 (-) a 3000 (+) Pcs.;
(B) Work In Process (WIP): 500 (-) a 1000 (+) Pcs.;
(C) Production Capacity: 100 (-) a 400 (+) Pcs / hr.
The results obtained from the runs in STELLA® were integrated into MINITAB® version 15 to analyze the design of experiments and to identify significant factors in the logistics evaluation system.
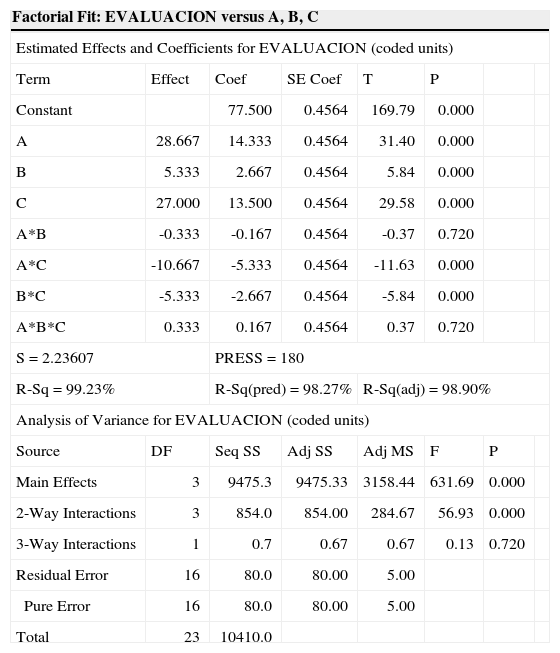
The results obtained in the ANOVA (Table 3) indicate that the inventory of finished goods, work in process and production capacity influence the fulfillment of orders. Combinations A * C and B * C are also significant, but the combination of the factors A * B and the combination of the three factors A * B * C are not significant. The coefficient of multiple determination R2 (99.23%) and the adjusted R2 (98.90%) are measures of regression analysis and allow explaining the system’s good fit.
ANOVA Experimental Design Applied to the Evaluation System.
| Factorial Fit: EVALUACION versus A, B, C | |||||||
|---|---|---|---|---|---|---|---|
| Estimated Effects and Coefficients for EVALUACION (coded units) | |||||||
| Term | Effect | Coef | SE Coef | T | P | ||
| Constant | 77.500 | 0.4564 | 169.79 | 0.000 | |||
| A | 28.667 | 14.333 | 0.4564 | 31.40 | 0.000 | ||
| B | 5.333 | 2.667 | 0.4564 | 5.84 | 0.000 | ||
| C | 27.000 | 13.500 | 0.4564 | 29.58 | 0.000 | ||
| A*B | -0.333 | -0.167 | 0.4564 | -0.37 | 0.720 | ||
| A*C | -10.667 | -5.333 | 0.4564 | -11.63 | 0.000 | ||
| B*C | -5.333 | -2.667 | 0.4564 | -5.84 | 0.000 | ||
| A*B*C | 0.333 | 0.167 | 0.4564 | 0.37 | 0.720 | ||
| S = 2.23607 | PRESS = 180 | ||||||
| R-Sq = 99.23% | R-Sq(pred) = 98.27% | R-Sq(adj) = 98.90% | |||||
| Analysis of Variance for EVALUACION (coded units) | |||||||
| Source | DF | Seq SS | Adj SS | Adj MS | F | P | |
| Main Effects | 3 | 9475.3 | 9475.33 | 3158.44 | 631.69 | 0.000 | |
| 2-Way Interactions | 3 | 854.0 | 854.00 | 284.67 | 56.93 | 0.000 | |
| 3-Way Interactions | 1 | 0.7 | 0.67 | 0.67 | 0.13 | 0.720 | |
| Residual Error | 16 | 80.0 | 80.00 | 5.00 | |||
| Pure Error | 16 | 80.0 | 80.00 | 5.00 | |||
| Total | 23 | 10410.0 | |||||
The main contribution of this study leads to several important insights for manufacturing firms that participate in complex and dynamic assembling industries such as the automotive one. Faced with the hypercompetitive economic context organized in the automotive networks, it is not only necessary to have better organized logistics processes, but it is also necessary to integrate dynamically the set of differentiated advantages with which local actors (suppliers, manufacturers, logistics providers, etc.) can contribute to the competitiveness of any industrial system (Chopra and Meindl, 2012; Waters, 2003).
Our analysis not only identified the key logistics variables and its relationship, its pertinence was also verified through a DOE analysis. Since our model presents the key variables from a general point of view, manufacturers in emergent markets should identify their specific key operational logistics variables in order to focus their efforts on developing dynamic capabilities from a more global-local approach.
Through a hybrid approach, integrating a broad analysis allowed by system dynamics with the reliability provided by the design of experiments (DOE), it is feasible to analyze complex logistics processes. The ANOVA indicated that the model here proposed had a good fit, and at the same time, during the implementation process, decision makers provided positive feedback about the model as a reliable tool.
As future work, the development of a more robust statistical analysis as well as other conducting tests and validation processes in different industrial systems are planned.
The authors thank Flora Hammer for several useful comments that improved this paper as well as anonymous reviewers for their constructive comments and suggestions.