


The evolutionary game of co-opetition relationship between regional logistics nodes is studied in this paper. A replicator dynamic model is built to obtain the Evolutionary Stable Strategy (ESS) of the game. Then, according to the status and level of logistics nodes, the symmetric and asymmetric game models based on evolutionary game theory are proposed, respectively. The former is used to analyze the changing trends of co-opetition relationship between logistics nodes from a same layer of a logistics network. While the latter can be used to deal with the relationship forecasting problems between logistics nodes from different layers. The result of the case study reveals that the proposed models have good practicability and accuracy in dealing with the relationship forecasting problems within a regional logistics network.
Regional logistics network design plays an important role in logistics research, which will improve the benefit of governments, enterprises and consumers. As we have known, a regional logistics network is mainly composed of many logistics nodes and transport corridors. The study on relationship between logistics nodes is significant for the regional logistics network design. In real world, a logistics node can be a city, a logistics enterprise, a logistics park, a distribution center and so on. Logistics nodes in a logistics network always build logistics infrastructures together and share the transport resources, logistics demands and logistics information. The competition or cooperation development strategy taken by a logistics node will be changed at different times. Thus, the evolutionary game analysis of competition and cooperation relationship between logistics nodes is very important to the development of regional logistics network.
Some achievements on the layout planning of logistics nodes and enterprise logistics network design have been made in recent years. In early studies, Schonsleben [1] proposed partnership strategies towards logistics networks, and revealed that the duration and intensity of cooperation within a logistics network would cause different consequences. Tang et al. [2] discussed the integrated decisions for logistics network in a global manufacturing system based on heuristic algorithms. A two-layer integrated decision model (APLS-M and TOQ-M) was solved by an assignment heuristic and a transportation heuristic, and the simulation results indicated their method was effective. In order to solve logistics node dynamic service range division and the logistics node layout optimization problem, Wang and Feng [3] established a regional logistics node layout optimization model, based on weighted Voronoi diagram and the discrete generation algorithm. They provided a new research idea to the logistics node relationship study. An approach based on the Shapley value concept from cooperative game theory was presented by Reyes [4], which exhibited better effect in maintaining stable conditions in the logistics network. What’s more, this paper showed that the game theory was effective in dealing with logistics network problems. Feng et al. [5] proposed a regional logistics network based on hub-and-spoke network model to strengthen the promotion of the regional logistics towards the regional economic development. In the study, principal component analysis was applied to determine the level of the nodes in the proposed logistics network. A case study from Hubei province was presented to verify the feasibility of the proposed theory. Jenček and Twrdy [6] provided a methodology for transport logistics analysis of regional intermodal transport logistics terminals. By using this method, the accurate location of terminal nodes can be determined. Zheng and Liang [7] built up a planning model of logistics nodes considering the supply chain conditions, and a practical mathematical modeling framework was further suggested. A logistics network nodes planning and development strategy was described by Cao [8], and a logistics network in Henan province was taken as an example. In the work, a four-layer logistics network was designed. Opetuk et al. [9] focused on the energy consumption, materials consumption, pollution and waste caused by logistics activities, and some solutions for how to reduce the emission and increase the efficiency of logistics network were given.
In micro-logistics research field, many researchers conducted investigations in the logistics node development strategy study. Bruzzone et al. [10] focused on the development of a new simulator of micro activities in a logistics node, which could extend the capabilities of a logistics node over its current capabilities effectively. Liu et al. [11] considered the flexibility value of enterprise’s logistics capability, and their model avoided the disadvantages of traditional finance method, such as ignoring the intangible value calculation of logistics capability investment. A seamless intermodal distribution solution to the port hinterland container logistics of a regional logistics system was explored by Lannone [12]. In the paper, numbers of conditions were investigated to achieve private and social cost efficiency in the landside distribution, and the results obtained by the simulations can be used as a helpful reference for public policy makers. A multiagent model of the container terminal event management problem was provided by Lorena et al. [13] and it could reduce the logistics cost and enhance the competitiveness of a container terminal. Cedillo-Campos and Sanchez-Ramirez [14] presented a dynamic logistics performance assessment model on supply chains operating, and their research results could provide a decision support aid to node enterprises of a supply chain. Ding et al. [15] aimed at establishing the analysis and forecast diagnosis models for competitiveness of logistics enterprise based on support vector machine theory. In their investigation, they regarded an enterprise as a node of the logistics network.
In the evolutionary game theory research, Cleveland and Ackleh [16] attempted to find a comprehensive mathematical framework to solve the nonlinear evolutionary game theoretic models, which supported the establishments of our symmetric game model and asymmetric game model. And Veloz et al. [17] illustrated their framework by modeling the repeated prisoners’ dilemma, their model is built from the payoff matrix together with assumptions of the agents’ memory and recognizability capacities. We also use these assumptions in our paper as preconditions.
However, little literatures can be found about the topic of relationship analysis between regional logistics nodes. In the research, we forecast the relationship development tendency of logistics nodes and present a symmetric game model and an asymmetric game model to investigate the competition or cooperation strategy chosen by logistics nodes within a regional logistics network. This paper is organized as follows. As the basic preparation, in section 2, we will construct a replicator dynamic model first. Then in section 3 we will build a symmetric evolution game model and an asymmetric evolution game model of regional logistics nodes respectively. In section 4, a case study of the new Eurasian Continental Bridge logistics network will be given to show the performance of the models proposed in the paper. And in section 5, a conclusion will be made.
2Problem description and evolution game theory2.1The co-opetition relationship of regional logistics nodesCooperation-competition is a strategy combining cooperation strategy with competition strategy. It is a kind of game behavior which will make the player gain more benefits. Brandenburger and Nalebuff [18] combined competition with cooperation into a new area, and named it “co-opetition” in their book Co-opetition. They thought that the business activities were not only a special game, but also a non-zero-sum game which can achieve a win-win situation.
In a multi-layer regional logistics network, the logistics nodes will share the customer requirement, logistics information, logistics income, transport resources, warehousing resources, and so on. A schematic diagram of a regional logistics system is shown in Figure 1. Co-opetition behavior exists between logistics nodes from a same layer (within the shaded area A shown in Figure 1) or from different layers (within the shaded areas B and C). During the development process of the logistics network, some logistics nodes will choose cooperation strategy, some of them will select competition strategy, and others maybe adjust their management strategy constantly. The achievements of this investigation provide theoretical basis for the strategy selection of logistics nodes.
2.2Replicator dynamics model
In early game theory models, players were assumed to be perfect rationality. Although theoretically useful, this behavioral assumption on the other hand is extreme and unrealistic. Significant efforts have been made to improve the realism of behavioral assumptions adopted in game theory models, i.e., the evolutionary game theory (EGT) model. With different status and positions of players in the game, the game theory model can be divided into symmetric game model and asymmetric game model. In 1982, John Maynard Smith introduced the concept of “Evolutionary Stable Strategy (ESS)” in his book Evolution and the Theory of Games to reveal the dynamic mechanism of behavior changes in animal groups. So, in order to find the ESS of the game, we will build a replicator dynamics model first.
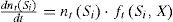
In repeated games, it is assumed that the players are divided into two groups and each of them only can choose one pure strategy at a time (cooperation strategy or competition strategy). The notations throughout the paper are defined as follows: si represents the strategy i chosen by a player; Si, ={s1, s2,..., si} represents the strategy set composed of alternative strategies, where si ∈ Si; nt (si) means the number of players choosing pure strategy si at the moment t; xt (si) is the rate of the players who choose strategy si at the moment t in the group; x = {xt(s1), xt(s2), xt(sj)} represents the status of the group at the moment t.
Then we can get the equation:

The anticipated expense of player i choosing strategy si at the moment t is:

where ft(si,r) represents the anticipated expense of player i who chooses strategy si when other players choose the strategy r. The average anticipated expense of the group is:

In the game, players will make a judgment on their benefits after each game process. Then the players with lower income will learn from the ones with higher income and adjust their management strategies. The proportion of player type is a function of the time which depends on the learning speed. The numerical value of the proportion of player type equals the derivative of player type proportion with respect to t [16]. Then we can get the differential equation:
According to Eq. 1, we can get:
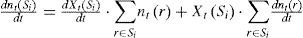
Combining Eq. 4 with Eq. 5, we obtain:

Simplifying Eq. 6 with the combination of Eq. 3, it follows that:

Eq. 7 is the differential form of the replicator dynamic model. Let dXtSidt=0, then all steady states of replicator dynamics can be gained. A steady state Xt∗Si is an ESS only when it has stability to small sample perturbations and satisfies the following conditions: if XtSi
According to the different positions of players, the game theory model can be classified into symmetric game model and asymmetric game model. Based on the assumptions in section 3.1, we will build a symmetric evolution game model and an asymmetric evolution game model of regional logistics nodes respectively, in section 3.2 and section 3.3.
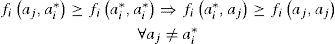
3.1Basic assumptionsIt is assumed that there are two types of groups in the game: group I and group II. Players from group I has i pure strategies s1, s2,..., si, ; while players from group II has j pure strategies s1, s2,..., sj. The strategy spaces can be defined as:Si={(α1,α2,...,αi):∑n=1iαn=1},Sj={(β1,β2,...,βj):∑n=1iβm=1}, in Which αi and βj represent the probability of players will choose corresponding strategies, respectively. The payoff function of group I is fi (αi, βj), and for group II is fj (αi, βj), where fi (αi,βj) and fj(αi, βj) depend on the strategy profile (si,sj). In the symmetric game model, ones obtain that αi = βj, i=j, and n=m. The symmetric game can be described asG = {si;fi (αi, αj)}. Maynard Smith (1982) defined: when the strategy ai∗ meets the optimal reaction conditions (8) and (9), the strategy ai∗ is a symmetric game ESS. In a similar way, we can also get the ESS of the asymmetric game model.

Basic assumptions of these models are as follows:
- a)
The rate of logistics nodes from group I choose cooperation strategies is x (o ≤ x ≤ 1), and the rate of competition strategies is 1-x. The rate of logistics nodes from group II select cooperation strategy is y (o ≤ y ≤ 1), and the rate of competition strategy is 1-y. In the symmetric game model, the logistics nodes come from the same type of group, we have x=y.
- a)
The logistics incomes of logistics node A and logistics node B are I1 and I2 (assuming I1>I2), respectively, when they don’t cooperate with each other. The expected increased logistics income after they using cooperation strategies is ΔI. The parameter “profit sharing rate” ω(0 ≤ ω ≤ 1) is introduced to control the distribution of the additional benefit ΔI. Then, the additional income of node A which caused by cooperation is ωΔI and the one of node B is (1-ω)ΔI.
- a)
We assume that the investments for cooperation of Node A and Node B are M1 and M2 (M1>0, M2>0, M1>M2), respectively. In the symmetric game model, it is assumed that there is only one type of group in the game, and we have αi = βj, fi (αi,βj) = fj(αi,βj), I1=I2, and M1=M2.
The players in the symmetric game come from the one type of group (a same layer in the logistics network), which means that the players are without differences in the activities during the game process. Based on the assumptions above, the symmetric cooperative game payoff matrix between node A and node B is shown in Table 1.
According to Table 1, when the profit sharing rate is ω=1/2, the expected payoff for cooperation strategy is:

The expected payoff for competition strategy is:
The average expected payoff of the group is:

According to Eq. 7, the replicator dynamics equation is:

Let dXdt=0, then X1∗=0,X2∗=1,X3∗=MΔI/2, which means that the imitator replicator dynamics has three steady states at most.
- (1)
When M<ΔI/2,X3∗=MΔI/2∈0,1; for d2Xdt2x=x1∗<0,d2Xdt2x=x2∗<0,x1∗ and x2∗ are asymptotically stable points and x3∗ is the saddle point. The changing trend of imitator dynamic evolution is shown in Figure 2.
If the initial value of x is between x1∗,x3∗ at the beginning of the gambling, the replicator dynamics of the group will tend to the steady state x1∗, and there will be more and more logistics nodes emulating competition strategies. Thus, the relationship between the logistics nodes will trend to competition. If x is between x3∗,x2∗ the replicator dynamics of the group will tend to the steady state x2∗, and there will be more and more logistics nodes emulating cooperation strategies. Therefore, the relationship between the logistics nodes will trend to beneficial cooperation.
- (2)
when M>ΔI/2,X3∗=MΔI/2∉0,1, and x3∗ is insignificance. The system only has two stable states at most: x1∗ and x2∗ According to the stability theorem for differential equation, x1∗ is an asymptotically stable point, while x2* is an instability point. In this case, there is only one stable point x1∗=0, which means that the scale of the logistics nodes selecting cooperation strategies is zero. All the logistics nodes will choose competition strategy. The relationship between logistics nodes will eventually tend to competition.
- (3)
When M=ΔI/2,X3∗=X2∗=1, singularities x3∗ and x2∗ become one point. In this case, the changing trends of the system will be the same as in condition (2). That is, when the investment is equal to the additional benefit earned by the cooperation, the players in two sides will also give up cooperation gradually. Thus, the relationship of them will tend to competition.

Different from the symmetric game model, in the asymmetric one, the logistics nodes come from different layers of the logistics network. Based on the assumptions in section 3.1, the asymmetric cooperative game payoff matrix of node A and node B is shown in Table 2.
According to Table 2, the expected payoff for cooperation strategy of logistics node A from group

The expected payoff for competition strategy of logistics node A is:

The average expected payoff of the group I is:

According to Eq. 7, the replicator dynamics equation of group I is:

The expected payoff for cooperation strategy of logistics node B from group II is:

The expected payoff for competition strategy of logistics node B is:

The average expected payoff of the group II is:

According to Eq. 7, the replicator dynamics equation of group II is:

Let dxdt=0 and dydt=0, then five singularities can be gained: z1∗=0,0,z2∗=0,1,z3∗=1,0,z4∗=1,1,z5∗=(M21−ω⋅ΔI,M1ω⋅ΔI). By solving d2xdt2 and d2ydt2 separately, we have d2xdt2=1−2Xy⋅ω⋅ΔI−M1 and d2ydt2=1−2yX⋅1−ω⋅ΔI−M2. Then, let d2xdt2=0 and d2ydt2=0, we can get the solutions: x1=1/2 and y1=1/2, x2=M2/(1-ω)⋅ΔI and y2=M1/ω⋅ΔI.
- (1)
When ω⋅ΔI >M1,(1-ω)⋅ΔI>M2, we get 0 < M1/ω)⋅Δ < 1,02/(1-ω)⋅Δ I<1, and the point (M21−ω⋅ΔI,M1ω⋅ΔI) locates in the plane φ = {(x,y);0≤x,y≤1}. There are five balance points of the replicator dynamic model: Z1∗~Z5∗. For the point Z1∗=0,0, we have d2Xdt2x∗=0<0 and d2ydt2y∗=0<0. According to the stability theorem for differential equations, the balance point Z1∗ is an asymptotically stable point of the replicator dynamics. Similarly, we can get that Z4∗=1,1 is also an asymptotically stable point; Z2∗=0,1 and Z3∗=1,0 are instability points; Z5∗=(M21−ω⋅ΔI,M1ω⋅ΔI) is a saddle point. The changing trend of the co-opetition relationship in asymmetric game model is shown in Figure 3.
According to Figure 3, we can find that the changing trend of relationship between logistics nodes depends on the initial state of the system. If the initial value of x is less than x* and the initial value of y is less than y*, the initial state of the system will locate in the area A and the system will converge to the asymptotically stable point Z1∗=0,0. The relationship between logistics nodes will gradually end up with competition.
If the initial state of the system locates in the area C, the system will converge to the asymptotically stable point Z4∗=1,1. The relationship between logistics nodes will eventually end with cooperation. For ω⋅ΔI>M1 and (1-ω)⋅ΔI>M2, we can get I1 +ω⋅ΔI-M>I1 and I2 +(1-ω)⋅ΔI-M2>I2. According to Table 2, the income of logistics nodes reaches the best in this case. That is, both sides of the game players can obtain additional benefits by cooperation which is more than the investments for the cooperation. Therefore, the cooperation strategy is the best choice for each logistics node.
If the initial state of the system locates in the area B and D, the changing trend of relationship between logistics nodes is uncertain. It may tend to the area A and converge to the point Z1∗=0,0. Also it may tend to the area C and converge to the point Z4∗=1,1.
- 2)
When one of the conditions ω⋅ΔI1 and (1-ω)⋅Δ I<M2 is true at least, the point (M21−ω⋅ΔI,M1ω⋅ΔI) will locate outside of the plane ϕ = {(x,y);0 ≤ x,y≤1}. There are only four equilibrium points Z1∗~Z4∗ of the system which are shown in Figure 4.
In this case, no matter which condition ω⋅ΔI < M1 or (1-ω)⋅ΔI < m2 is true, there is only one asymptotically stable point Z1∗ and the system will converge to Z1∗=0,0. It means that at least one side of the players’ additional benefits will be less than the investment for cooperation. Thus, the relationship between logistics nodes will end up with competition. In the regional logistics system, the total logistics income of all the logistics nodes can’t reach the maximum.
.")
.")
In order to show the rationality and effectiveness of the proposed models, we test our models by analyzing the logistics system of the new Eurasian Continental Bridge (within Chinese territory). A three-layer logistics network including 42 cities from 10 provinces is shown in Table 3.
The logistics network of the new Eurasian Continental Bridge (within Chinese territory).
| Layer | Logistics Nodes |
|---|---|
| Layer I | Lianyungang, Xuzhou, Zhengzhou, Xi’an, Lanzhou and Urumchi |
| Layer II | Rizhao, Nanjing, Hefei, Taiyuan, Luoyang, Nanyang, Yan’an, Xianyang, Yinchuan, Sining, Jiayuguan, Golmud, Hami, Turpan, Korla and Alataw Pass |
| Layer III | Jiangyin, Huainan, Yanzhou, Jinan, Shangqiu, Fuyang, Changzhi, Yulin, Hanzhong, Baoji, Tianshui, Wuwei, Jinchang, Jiuquan, Yumen, Altai, Karamay, Yining, Kuqa and Aksu |
Two cities in Table 3 are randomly arranged, i.e., Lianyungang and Xi’an. The municipal governments of them signed a cooperation agreement with each other on April 5th, 2012.
According to Table 3, we know that both of them belong to Layer I and have the equal status. So the symmetric game model of logistics nodes provided in section 3.2 can be used to analyze the cooperative behaviors of Lianyungang and Xi’an. It is assumed that the additional logistics income caused by cooperation is 27 million yuan, and the investment for logistics cooperation of each city is 4.2 million yuan. Then, we can get ω=1/2, ΔI =27 and M=4.2. The symmetric cooperative game payoff matrix of Lianyungang and Xi’an is shown in Table 4.
According to Table 4 and based on Eqs. 10 to 13, we can get the replicator dynamics equation between Lianyungang and Xi’an is: x(1 - x)(13.5x - 4.2) = 0. Three singularities can be gained: X1∗=0,X2∗=1 and X3∗=0.31, in which X1∗ and X2∗ are asymptotically stable points, X3∗ is a saddle point. If the initial state of the system x is between X3∗,X2∗, that is, more than 31% of the logistics nodes choose cooperation strategies, the game system will converge to the steady state of X2∗. In this case, more and more logistics nodes will choose cooperation strategies. The co-opetition relationship between logistics nodes in Layer I will tend to cooperation, and vice versa. Based on the development data of the new Eurasian Continental Bridge from 2010 to 2012, the Layer I logistics nodes cities, i.e., Zhengzhou, Lanzhou, Urumchi and Lianyungang already have cooperated with each other. Thus, more than 83% of the logistics nodes in Layer I choose cooperation strategies. The co-opetition relationship will end up with cooperation and the regional logistics system can achieve the maximum logistics benefits.
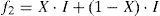
4.2A case study of asymmetric game modelA city from layer I in Table 3 and a city from layer II in Table 3 are randomly arranged, respectively, i.e., Lianyungang and Luoyang. They signed a cooperation agreement with each other on December 18th, 2008. For the cooperation, the government of Lianyungang paid 6.5 million yuan, and the government of Louyang paid 3.5 million yuan. The two cities come from different layers of the regional logistics system, so we can use the asymmetric game model presented in section 3.3. Assuming that: ω=2/3, ΔI=18, M1=6.5 and M2=3.5. The asymmetric cooperative game payoff matrix of Lianyungang and Luoyang is shown in Table 5.
According to Table 5 and based on Eqs. 14 to 21, we can get the replicator dynamics equations between Lianyungang and Luoyang:

Then five singularities can be gained: Z1∗=0,0,Z2∗=0,1,Z3∗=1,0,Z4∗=1,1,Z5∗=0.58,0.54. According to Figure 3, we can find the point (0.58,0.54) locates in the plane ϕ ={(x,y);0≤x,y≤1}. And the historical data show that: the rate of logistics nodes who chose cooperation strategies within layer I was more than 58% (x>0.58), but the rate of logistics nodes who selected cooperation strategy within layer II was less than 54% (y<0.54). So the initial state of the system locates in the area D of Figure 3, the changing trend of relationship between logistics nodes is uncertain. It will tend to cooperation or tend to competition. In this case, the logistics policies instituted by national government will be very important to the development trend of co-opetition relationship between regional logistics nodes.
5ConclusionsAs an important component of the regional logistics research, the study on co-opetition relationship between logistics nodes has an enormous effect on the regional logistics system development. To forecast the regional logistics nodes development tendency and analyze the affecting factors, this paper analyzed the co-opetition relationship between logistics nodes in a regional logistics system. Firstly, the co-opetition between logistics nodes was described, and the cooperation and competition strategy were given. Then, we constructed a replicator dynamic model to determine the strategy sets of the logistics nodes. Secondly, a symmetric game model and an asymmetric game model of logistics nodes were proposed. By solving these models, we could forecast the changing trends of co-opetition relationship between logistics nodes from the same layer or from different layers. Finally, a case study was taken to verify the effectiveness of the models. The calculated results revealed that the models constructed in this paper had good performance in forecasting the relationship development tendency of logistics nodes.
This project supporting by the Science and Technology Development Plan of Ministry of Railways, P.R.C. (Grant no. 2012X012-A). The authors would also thank Dr. W. Wang at Department of Systems Science, Beijing Jiaotong University, for his constructive suggestions and comments.