


This paper presents a novel approach for QRS complex detection and extraction of electrocardiogram signals for different types of arrhythmias. Firstly, the ECG signal is filtered by a band pass filter, and then it is differentiated. After that, the Hilbert transform and the adaptive threshold technique are applied for QRS detection. Finally, the Principal Component Analysis is implemented to extract features from the ECG signal. Nineteen different records from the MIT-BIH arrhythmia database have been used to test the proposed method. A 96.28% of sensitivity and a 99.71% of positive predictivity are reported in this testing for QRS complexity detection, being a positive result in comparison with recent researches.
Cardiovascular diseases are the main cause of death worldwide according to the World Health Organization (Alwan, 2011; Palanivel & Sukanesh, 2013). In 2008, around 17.3 million people have died from cardiovascular diseases, which represent 30% of all worldwide deaths (Alwan, 2011). Thereby, cardiac health research has acquired significative importance for medical researchers, mainly for those focused on technological, preventive and medical advances. Accordingly, traditional technologies for cardiovascular-diagnosis used at home, clinics and hospitals have been of main interest for researchers in order to improve them.
Electrocardiogram (ECG) analysis is the most common clinical cardiac examination, which is a useful detection tool for several cardiac abnormalities, mainly because it is inexpensive, simple and risk-free (Dilaveris et al., 1998; Elgendi et al., 2014). Hence, ECG analysis has been widely investigated during the last two decades. Mostly, because an ECG signal records a vital sign for heart functional investigation because it represents the electrophysiological events that coincide with the sequence of depolarization and repolarization of the atria and ventricles (Elgendi et al., 2014).
The three main events presented in the signal of each heartbeat are: the P wave, the QRS complex, and the T wave (Hasan & Mamun, 2012). Each event contains its own peak, making this important to analyze their morphology, amplitude, and duration for cardiac arrhythmias detection (Bashour et al., 2004; Tran et al., 2004; Tsipouras et al., 2002). Also, their analysis can be critical for detecting breathing disorders such as obstructive sleep apnea syndrome (Trinder et al., 2001; Zapanta et al., 2004) and for studying the autonomic regulation of the cardiovascular system during hypertension and sleep (Trinder et al., 2001). Other functional or structural cardiac disorders can be monitored too.
Computer-based ECG analysis requires an accurate detection of QRS complex, in particular, an accurate detection of the R wave. Nevertheless, this is a non-easy task since a real ECG signal usually faces muscular noise, motion artifacts, and baseline drifts changes (Benitez et al., 2001). Other components of an ECG, such as P and T waves, are also found to be high in some cases, and these waves must be differentiated from the QRS waves. This increases the complexity of QRS detection (Benitez et al., 2001; Köhler et al., 2003). False R-wave detection or the failure to detect R-waves may lead to undesired results in computer-based ECG analysis (Köhler et al., 2003). In addition, the number of false detections significantly increases in the presence of ECG signals from patients with pathologies or by using poor signal-to-noise ratios (SNR) (Burte & Ghongade, 2012; Köhler et al., 2003).
Several QRS detection researches have been developed during decades; these researches have been mainly attained to three categories: time domain detection techniques, transform domain detection techniques, and other methods that include morphologic filtering techniques and template matching (Burte & Ghongade, 2012). These techniques have been utilized into different applications like heart rate variability analysis, arrhythmia classification, heart rate calculation, feature extraction, ECG compression, R-R interval analysis, and P, S, and T wave detection (Burte & Ghongade, 2012).
QRS well-known algorithms are mainly focused on two important stages: QRS enhancement and QRS detection. The stage of QRS enhancement is applied to enlarge the QRS complex with respect to the other QRS features, such as P, T, and noise. In some researches, this stage is described as pre-processing or feature extraction. One of these techniques is the amplitude threshold which has been used by Morizet-Mahoudeaux et al. (1981). With this technique, the signal noise is not properly removed and it is usually followed by the first derivative of the ECG signal (Morizet-Mahoudeaux et al., 1981). Other technique is the first derivative of the ECG signal followed by threshold (Okada, 1979), this technique helps to reduce baseline drifts and motion artifacts (Zhang & Lian, 2007); however it does not remove high frequency noise. Some research work have applied first derivative combined with second derivative of an ECG signal, followed by threshold (Ahlstrom & Tompkins, 1983); although the signal noise is not removed properly. Digital filters have been applied by other authors for QRS enhancement. The applied digital filter can increase the SNR ratio; it depends on the order of the filter and its nature. In Pan and Tompkins (1985), authors applied a bandpass filter to an ECG signal followed by its first derivative, and threshold. In Yongli and Huilong (2005), authors applied mathematical morphology filtering to ECG signal for QRS enhancement followed by threshold. With the mathematical morphology algorithms the signal noise is partially addressed. According to the literature, authors have also been approaching the QRS enhancement by applying Empirical Mode Decomposition (EMD) filtering (Tang et al., 2008). In Tang et al. (2008), the EMD is applied to ECG signal followed by threshold. In this sense, the first several Intrinsic Mode Functions can preserve the QRS content; they are able to filter out the noise, and improve the SNR. Other research work have applied the Hilbert transform for QRS enhancement (Arzeno et al., 2008), also, the first derivative can be used before applying the Hilbert transform, and then be followed by threshold. However, the Hilbert transform does not improve the SNR; hence it is common for investigators to filter the signal before applying the Hilbert transform. Other technique applied for QRS enhancement is the filter banks, which significantly improve the SNR for Gaussian noise and for muscle noise in comparison with the median or mean averaging methods (Afonso et al., 1995). In Afonso et al. (1999), authors applied filter banks to ECG signal followed by threshold. Furthermore, the wavelet transform technique has also been used by other related work. I.e., in Dinh et al. (2001), authors applied wavelet transform to ECG signal followed by threshold; with wavelet transform, the SNR can be improved by selecting the coefficients with the largest amplitude (Alesanco et al., 2003).
Several techniques have been applied in the literature for QRS detection. Matched filters have been applied to ECG signal by Kaplan (1990). Another technique is the syntactic method, which has been applied by Trahanias and Skordalakis (1990) to detect QRS complex in ECG signal; however, the syntactic method is sensitive to noise (Trahanias & Skordalakis, 1990). In Liang-Yu et al. (2004), authors have applied wavelet transform to ECG signal followed by neural networks. It is important to note that neural networks are highly sensitive to noise (Clifford et al., 2006). Other technique is the Hidden Markov Model which has been used by Coast and Cano (1989), where authors applied a bandpass filter to the ECG signal followed by the Hidden Markov Model. However, Hidden Markov Model is sensitive to heart rate variation, baseline wander, and noise (Cheng & Chan, 1998). Singularity method is also applied by researchers for QRS detection (Xing & Huang, 2008). Xing and Huang (2008) applied the EMD filtering to an ECG signal; after that, authors applied the singularity and threshold methods. However, the singularity method is sensitive to noise (Ayat et al., 2009). In addition, zero-crossing technique has been applied in the literature for QRS complex detection. Köhler et al. (2003) firstly applied the bandpass filter to an ECG followed by a zero-crossing; however, this method is also sensitive to noise.
According to related work, methods based on Hilbert transform have the ability to discriminate the dominant peaks from other peaks. These methods have been capable to improve the results for R-wave detection. However, they tend to fail in diseases that cause low-amplitude waves, and in ischemic cases (Köhler et al., 2003). Normally, a threshold is needed for the detection of the R-wave in an electrocardiogram signal; a fixed threshold for detecting R-waves can be efficient and simple for ECG signals with normal beat morphology (Elgendi et al., 2014). However, several researchers have reported that ECG signal waveforms may vary drastically from each other, due to movement of patients, or severe baseline drifting. Accordingly to this, there is a high probability that QRS complexes may be missed. Otherwise, adaptive thresholding has been proven to reduce the probability of missing QRS complex detection (Elgendi et al., 2014; Köhler et al., 2003; Madeiro et al., 2007; Rabbani et al., 2011).
Usually, adaptive thresholding makes empirical use of many thresholds. In Li et al. (1995), authors presented an algorithm based on wavelet transform for detecting QRS complex, as well as P and T waves; a constant threshold has been used, which was determined empirically. Kadambe et al. (1999) used a constant threshold for QRS detection; the threshold has also been empirically determined. Their algorithm is based on wavelet transform too. In Burte and Ghongade (2012), and Xu and Liu (2005), authors have shown that adaptive thresholding provides interesting results for R wave peak detection. In their case, the thresholds have been detected automatically.
Moreover, according to specialized literature, Principal Component Analysis (PCA) has been used for extracting motion artifacts in ECG signals (Castells et al., 2007; Deshpande & Rajankar, 2013; Kher et al., 2014; Romero, 2010), signal compression (Deshpande & Rajankar, 2013), data dimensionality reduction (Rajpoot et al., 2013), and for data classification (Rajpoot et al., 2013) as well as for separating the respiratory and non-respiratory changes in beat morphology beat-to-beat in ECG features (Langley et al., 2010), in all the above mentioned work, PCA has been applied effectively, however, work from Sharma et al. (2013), Sharma et al. (2012), and Sharmila et al. (2013) have shown better results when PCA is applied with other techniques.
This paper is focused on the analysis of ECG signals by applying the Hilbert transform and the adaptive threshold technique to detect the real R-peaks from an ECG signal. In addition, the application of the PCA for feature extraction from electrocardiogram signals is presented as well. Feature extraction is applied to three types of heartbeats (normal heartbeats, premature ventricular contraction, and atrial premature contraction). Obtained results show that the performance of the proposed method reported a sensitivity of 96.28% and a 99.71% of accuracy in QRS complex detection.
The rest of the paper is organized as follows: section 2 presents a brief description of the methodology used for QRS complex detection from an ECG, including the band pass filter, the first derivative differentiation, the use of the Hilbert transform, and the adaptive threshold technique. Section 3 discusses PCA for extracting the feature vector. Section 4 shows the obtained results after applying the proposed methodology. Finally, section 5 presents conclusions and future work.
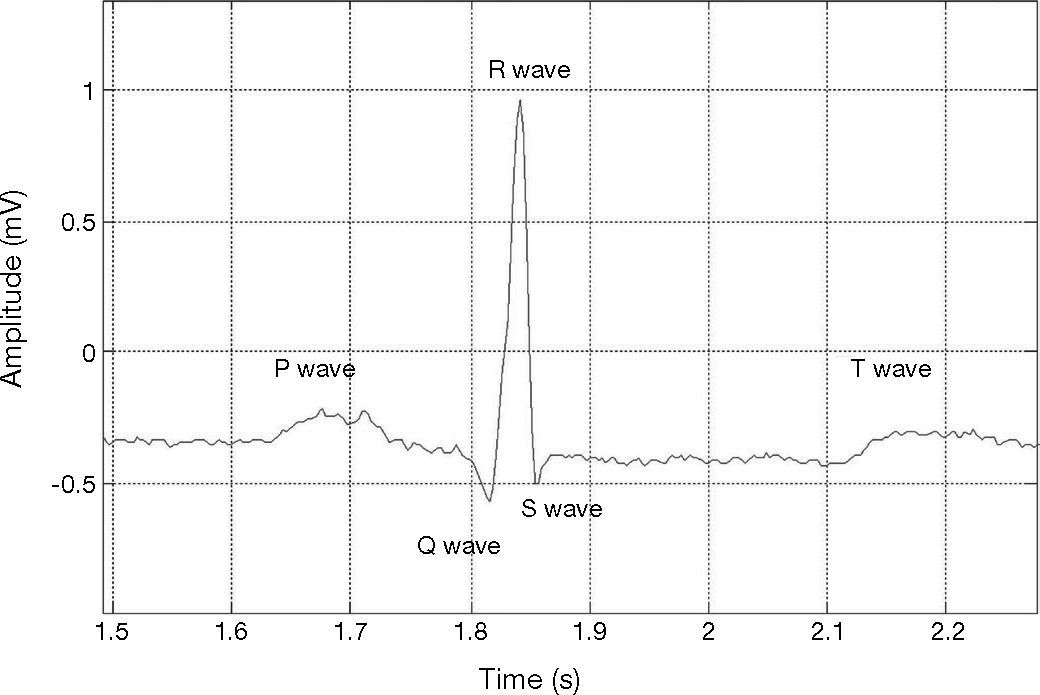
2Detection of the QRS complexElectrocardiogram signal is one of the most important biological signals used to diagnose heart diseases. ECG signals allow the representation of the cyclical contraction and relaxation of human heart muscles. Heart muscle activity is controlled by electrical pulses which are transmitted through a nerve network; such electrical pulses are strong enough to be sensed by electrodes placed on the human skin (Asirvadam et al., 2009; Kotas, 2007). In general, the ECG signal of a single cardiac cycle lies on the P, T, and QRS complex waves as depicted in Figure 1. Sometimes a U-wave may also be present after the T-wave (Elgendi et al., 2009).
.")
ECG for a single cardiac cycle; record 103 in MIT-BIH database (Goldberger et al., 2000).
The QRS complex represents the depolarization of heart ventricles which have greater muscle mass and hence its consumption of electrical activity is higher. The detection of R waves is easier than in other ECG signal wave detection due to its high amplitude and its structural form. There are some difficulties in QRS complex detection. These difficulties can be summarized as follows: a) presence of non-stationarity, i.e., the ECG statistical properties change over the time; b) presence of low QRS amplitudes; c) ventricular ectopics could arise; d) low SNR, i.e., noisy ECG signals, and e) presence of negative QRS polarities.
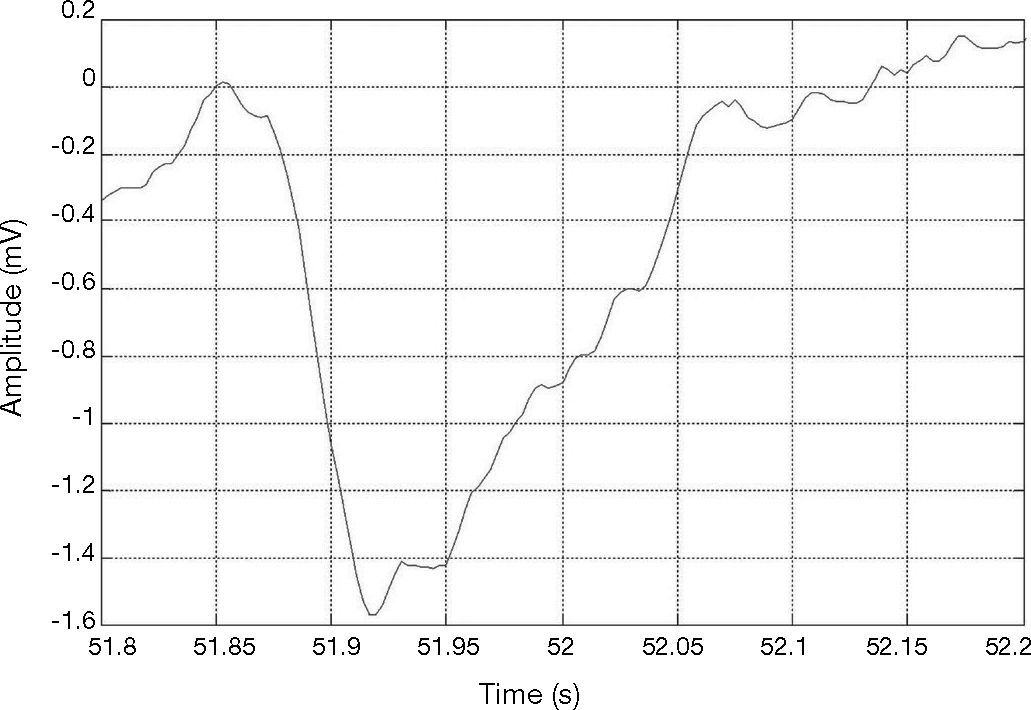
Figure 2 shows an R-peak with negative polarity. This can happen when some extrasystoles lead to a sudden polarity change. However, an algorithm for detecting QRS with R-peaks of both positive and negative polarity is desired.
, record #228.")
QRS of R-peak with negative polarity in the MIT-BIH arrhythmia data base (Goldberger et al., 2000), record #228.
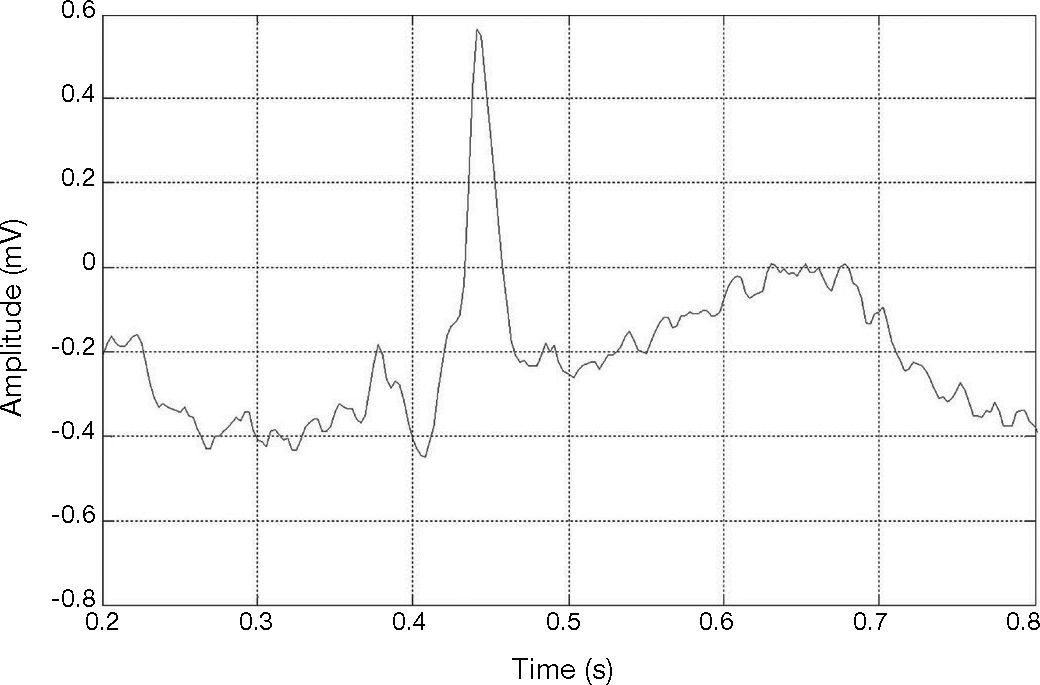
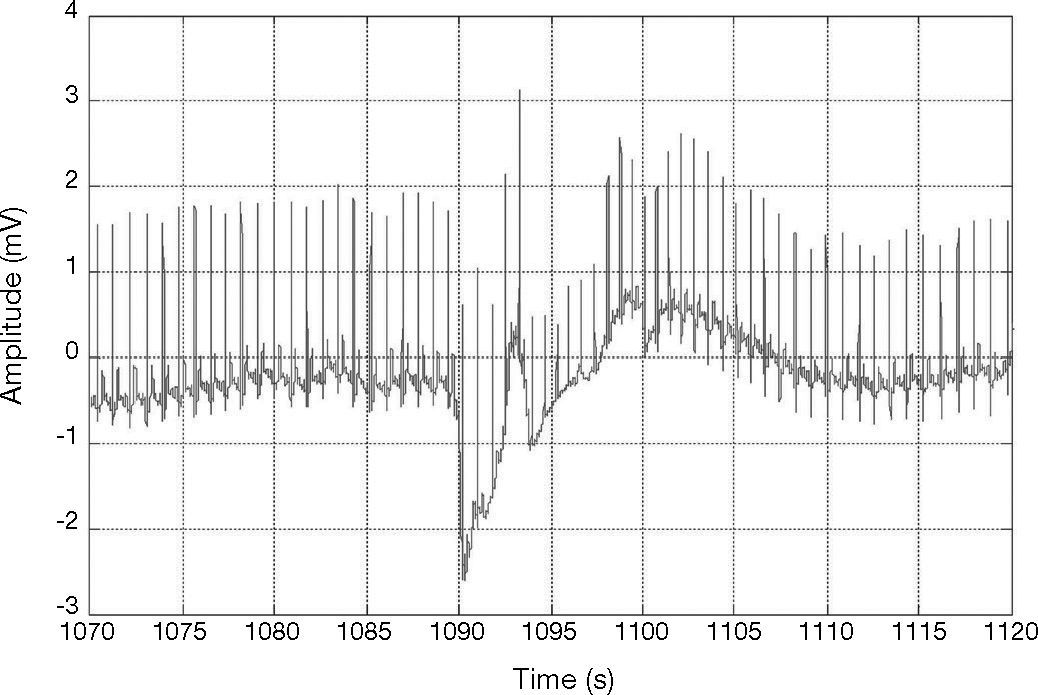
Figure 3 shows an R-peak with low amplitude. Therefore, ECG signals may vary drastically from one heartbeat to the next due to the movement of the patients and to severe baseline drifting, as depicted in Figure 4. Accordingly, it can also be noticed that a big fixed threshold can lead to missing detections. Moreover, a small fixed threshold can easily lead to inaccurate detections. The fixed threshold might also affect the detection of T and P waves. In another case, an adaptive threshold algorithm mainly implements multiple thresholds empirically, decreasing the possibility of missing QRS complexes.
, record #228.")
QRS of R-peak with low amplitude in the MIT-BIH arrhythmia data base (Goldberger et al., 2000), record #228.
.")
ECG signal with wave forms that vary drastically from one heartbeat to the next; record 103 in MIT-BIH database (Goldberger et al., 2000).
Our proposed method for QRS complex detection is based on combining both Hilbert transform and the adaptive threshold technique. The steps of this method are explained next.
2.1ECG filteringThe first stage of our proposed method is the ECG filtering. Firstly, the band pass filter is applied to maximize the QRS complex, and also for removing muscular noise from the ECG signal. A 6th order band-pass Butterworth filter has been applied. The band stop frequencies were set from 5 to 15 Hz. The 5 Hz is the starting frequency and 15 is the stopping frequency. This allows removing high frequencies and baseline wander (Chen & Chen, 2003). It also suppresses the P and T waves, and maximizes the QRS complex.
2.2DifferentiationThe first derivative is applied to indicate the minimum slope of the ECG signal (i.e., the falling of signal from R to S). Also, the first derivative indicates the high slope points (i.e., the rising of signal from Q to R). The first derivative differentiation using 2-point central difference is calculated using Eq. (1).
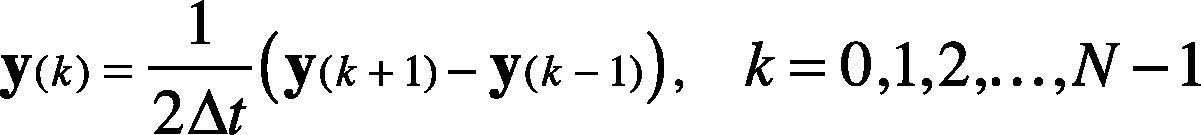
where 2Δt is the sampling frequency and N is the total number of samples. Initial conditions are set to minimize the error at the boundaries, i.e., initial condition is specified for k = 0, and k = N−1. The derivative output of the filtered ECG signal allows removing baseline drifts and motion artifacts.
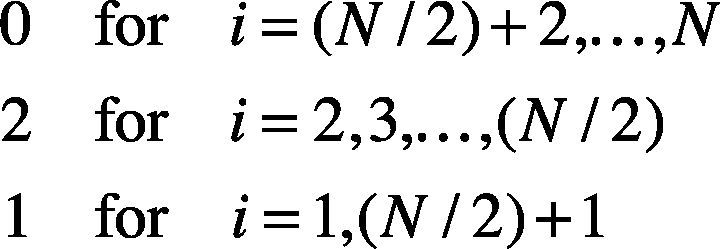
2.3Hilbert transformFor a discrete time series y(k), the Hilbert transform is defined as in Eq. (2).

where the vector h is filled as shown in Eq. (3). The vector f stores the Fast Fourier Transform (FFT) of the y(k) signal, and the FFT−1 is the Inverse Fast Fourier Transform.
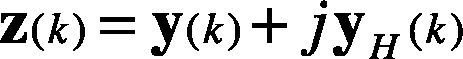
Therefore, the analytic signal z(k) is given in Eq. (4). It is also considered as the pre-envelope of the original signal y(k).
The envelope a(k) of y(k) is described in Eq. (5). It is also considered as the instantaneous magnitude of z(k).
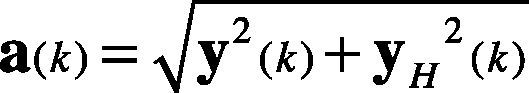
and the instantaneous phase angle in the complex plane is defined in Eq. (6).
2.4Adaptive threshold for QRS detection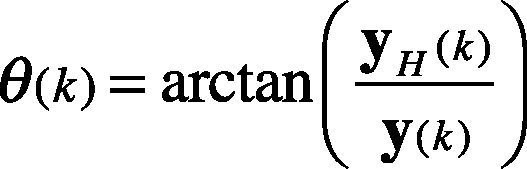
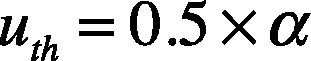
Adaptive threshold is a technique carried out for detecting the R wave peak. This technique is performed by using a pair of threshold limits called upper limited threshold (uth) and lower limited threshold (lth).
The upper threshold is defined by Eq. (7), where α is the maximum value attained y(k) on the point k=1,…,N.
The lower threshold is defined by Eq. (8).
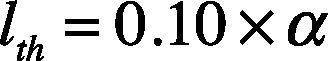
The threshold values are updated in iteration time, where the number of detected peaks above the lth threshold is obtained, and also, the number of detected peaks above uth is calculated. Thus, Nlth is the number of QRS complexes detected by lth, and Nuth is the number of QRS complexes detected by uth. The thresholds are updated per iteration, meanwhile the number of detected peaks by the up and down limits is different. The value of uth is updated using Eq. (9).
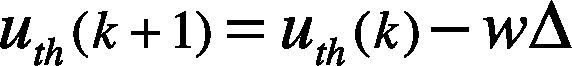
where the error weight w=0.125, and Δ=uth−lth is the difference between the defined two limits. The value of is lth updated by using Eq. (10). We assume w and Δ as the same as defined in Eq. (9).
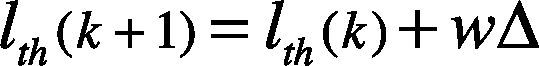
Accordingly to the previous definitions, wΔ=0.05×α. Then the lower threshold limit is increased by wΔ and the upper threshold limit is decreased by as well. This process continues until the same QRS number (i.e., Nlth = Nuth) is obtained.
3Feature extraction3.1Principal Component AnalysisThe PCA is a technique for linear dimensionality reduction that provides projection of the data in the direction of the highest variance (Monasterio et al., 2009). This technique is carried out to extract relevant features from the ECG data set. The signal segment of a heartbeat is represented by y(k), as in Eq. (11).
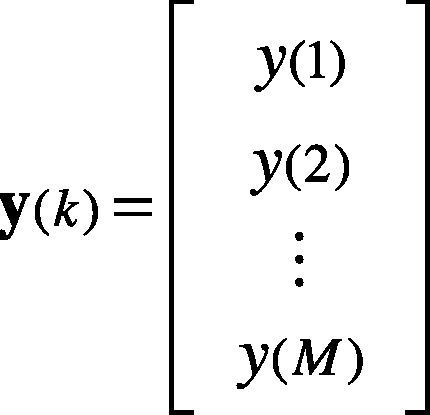
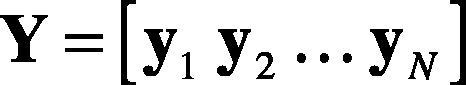
where M is the number of samples of the heartbeat. Thus, the heartbeats y1,y2…,yN are N observations of heartbeats —as in Eq. (12). The entire ensemble of heartbeats is represented by the M×N matrix.
The PCA consists of the following steps:
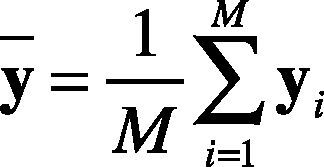
1. Calculate the mean vector. The mean vector of each heartbeat is calculated as in Eq. (13).
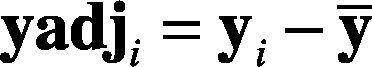
2. Compute the mean adjusted data —see Eqs. (14) and (15)— as follows:

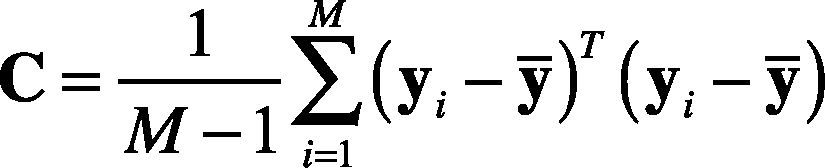
3. Compute the covariance matrix, as shown in Eq. (16).
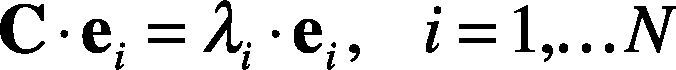
4. Calculate the eigenvectors and eigenvalues of the covariance matrix. The eigenvalues λi and eigenvectors ei, correspond to Eq. (17).
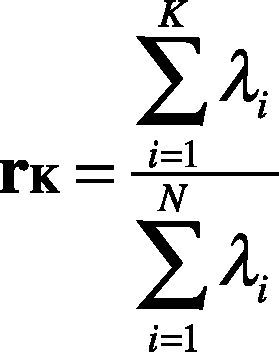
5. Choosing components and forming a feature vector. The eigenvector with the highest value is the principal component. Then, the eigenvectors are ordered by eigenvalues from highest to lowest, which returns the components in order of significance. Subsecuently, the dimensionality is reduced by selecting K-principal components that retain the physiological information. Thus, the percentage of variance, rk, of each eigenvalue is obtained by applying Eq. (18).
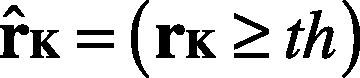
Furthermore, we select the principal components whose percentage of variance is higher than the percentage threshold,, that is 0.9 or 0.95 as shown in Eq. (19).
6. Deriving the new data set. The final dataset is obtained by Eq. (20).
4Results and discussion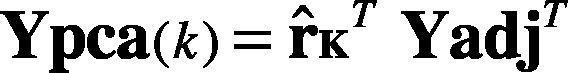
The QRS automatic detection and extraction methods have been validated using the MIT-BIH arrhythmia database (Goldberger et al., 2000; Moody & Mark, 2001). The MIT-BIH arrhythmia database contains records sampled at 360 Hz, with 11-bit resolution over 5 mV range. Each record contains a duration of 30 min with 5.556 s. For QRS detection, only the first channel of each record has been considered. A total of 19 records have been considered. These records contain inverted QRS polarity, low amplitude QRS, ventricular ectopic beats with low SNR, premature ventricular beats, and premature atrial beats. The performance of the proposed algorithm has been essentially evaluated by two parameters: Sensitivity (Se), and positive predictivity (+P), given them by Eqs. (21) and (22).
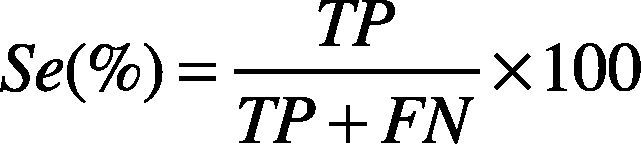
where TP (True Positive) is the number of heartbeats properly detected (i.e., QRS complexes properly detected), FN (False Negative) indicates the number of heartbeats that were not detected by the method (i.e., QRS complexes that were not detected), and FP (False Positive) indicates the false heartbeats detected (i.e., QRS complexes detected by the method when no QRS complexes are present). The sensitivity parameter (Se) indicates the percentage of heartbeats that were correctly detected by the algorithm. The positive predictivity (+P) indicates the percentage of heartbeats detections which were real true heartbeats.
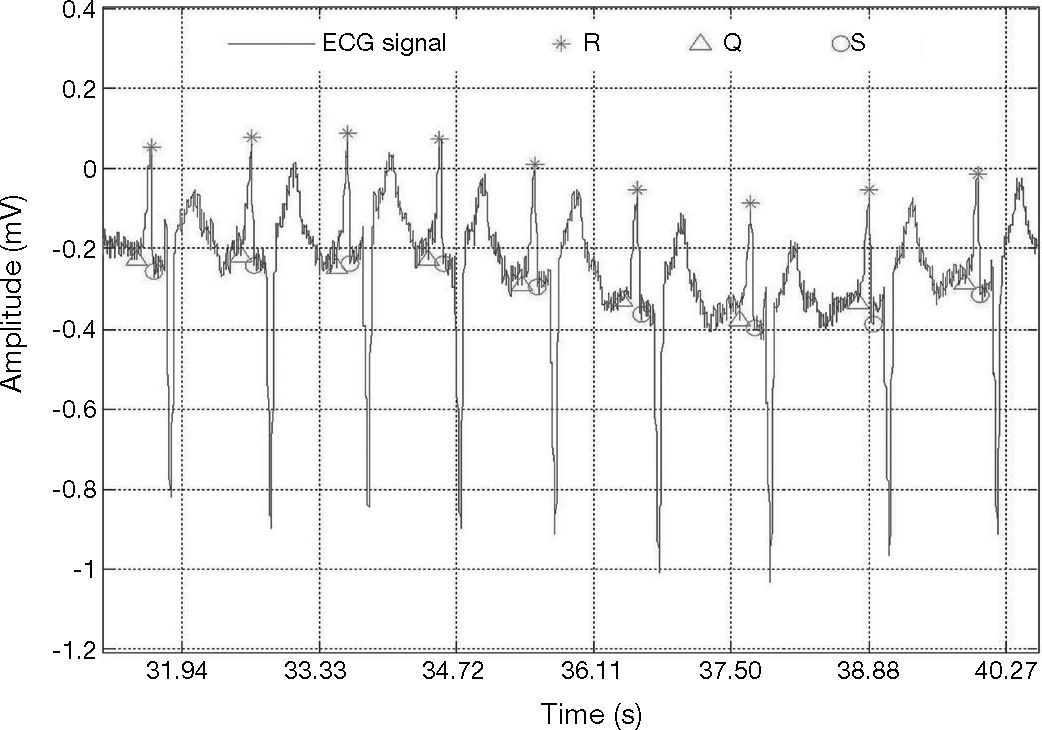
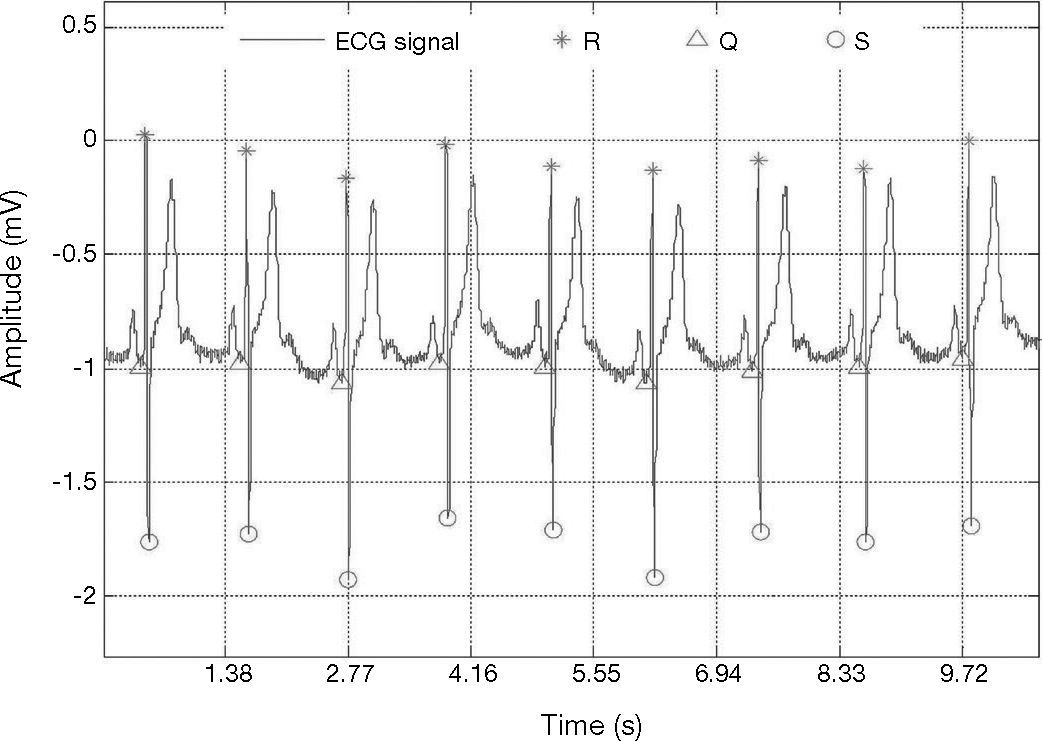
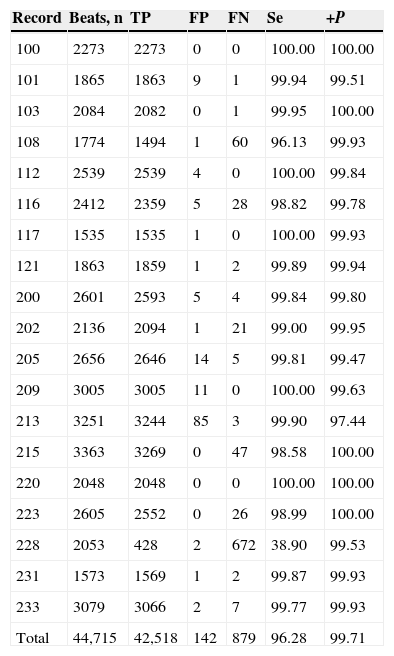
A beat is considered as detected within a window of ±13 samples around the true temporal beat detection. Table 1 presents the results of the adaptive threshold method applied to the nineteen records extracted from the MIT-BIH arrhythmia database. The algorithm detects the R-wave that is even very close to the end of the record, e.g., record 100. The method achieved fairly good results also for very noisy records, e.g., record 108 (Fig. 5). In addition, the method detected precise results for record 117 which has a low amplitude R-peaks and low SNR (Fig. 6).
Performance of QRS complex detection method on MIT-BIH arrhythmia database.
| Record | Beats, n | TP | FP | FN | Se | +P |
|---|---|---|---|---|---|---|
| 100 | 2273 | 2273 | 0 | 0 | 100.00 | 100.00 |
| 101 | 1865 | 1863 | 9 | 1 | 99.94 | 99.51 |
| 103 | 2084 | 2082 | 0 | 1 | 99.95 | 100.00 |
| 108 | 1774 | 1494 | 1 | 60 | 96.13 | 99.93 |
| 112 | 2539 | 2539 | 4 | 0 | 100.00 | 99.84 |
| 116 | 2412 | 2359 | 5 | 28 | 98.82 | 99.78 |
| 117 | 1535 | 1535 | 1 | 0 | 100.00 | 99.93 |
| 121 | 1863 | 1859 | 1 | 2 | 99.89 | 99.94 |
| 200 | 2601 | 2593 | 5 | 4 | 99.84 | 99.80 |
| 202 | 2136 | 2094 | 1 | 21 | 99.00 | 99.95 |
| 205 | 2656 | 2646 | 14 | 5 | 99.81 | 99.47 |
| 209 | 3005 | 3005 | 11 | 0 | 100.00 | 99.63 |
| 213 | 3251 | 3244 | 85 | 3 | 99.90 | 97.44 |
| 215 | 3363 | 3269 | 0 | 47 | 98.58 | 100.00 |
| 220 | 2048 | 2048 | 0 | 0 | 100.00 | 100.00 |
| 223 | 2605 | 2552 | 0 | 26 | 98.99 | 100.00 |
| 228 | 2053 | 428 | 2 | 672 | 38.90 | 99.53 |
| 231 | 1573 | 1569 | 1 | 2 | 99.87 | 99.93 |
| 233 | 3079 | 3066 | 2 | 7 | 99.77 | 99.93 |
| Total | 44,715 | 42,518 | 142 | 879 | 96.28 | 99.71 |
.")
Detection of QRS in noisy record 108; from MIT-BIH arrhythmia database (Goldberger et al., 2000).
.")
Detection of the QRS with low amplitude and low SNR, record 117, in MIT-BIH arrhythmia database (Goldberger et al., 2000).
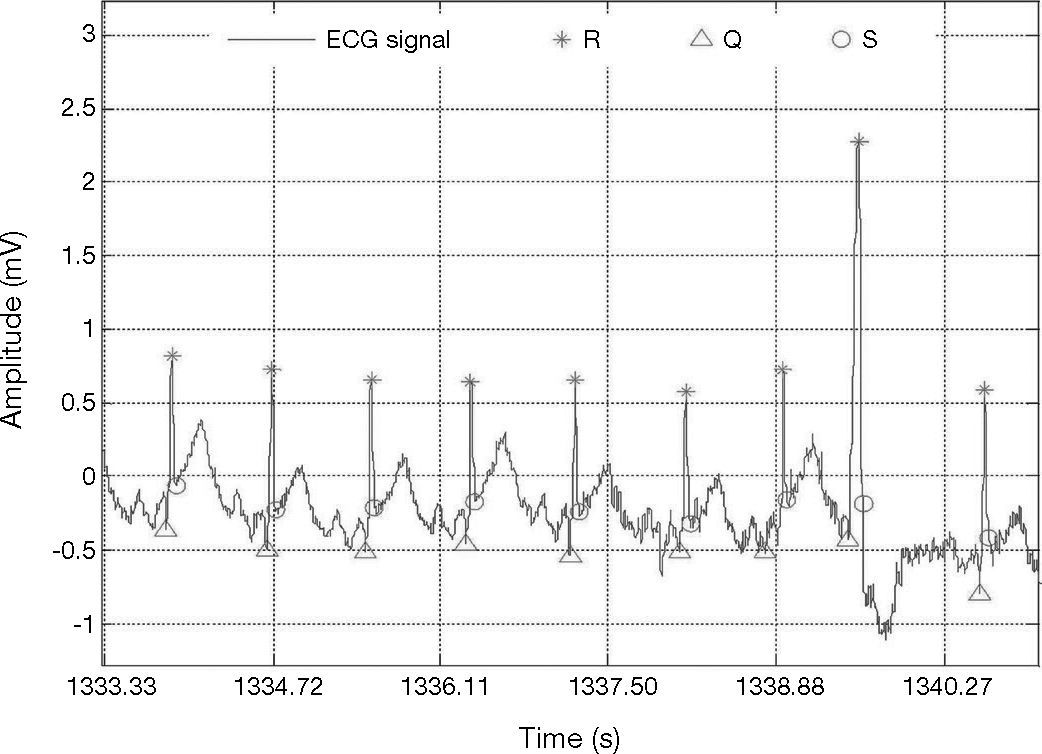
The results of our method to detect QRS complexes are significantly precise. Our method scored Se = 96.28% and +P = 99.71 over 44,715 heartbeats, as shown in Table 1. It is necessary to mention that our method achieved not so good sensitivity rate for record 228 which presents negative QRS polarities and ventricular ectopics (Fig. 7); this could explain the high number of FN beats, as can be seen in Table 1.
.")
Detection of the QRS with ventricular ectopics, record 228, in MIT-BIH arrhythmia database (Goldberger et al., 2000).
After the QRS detection, 90 samples were selected from the left side of R-peak and 90 samples after the R-peak point. Then, the PCA technique presented in section 3 has been applied to select useful features which can be used for further ECG recognition.
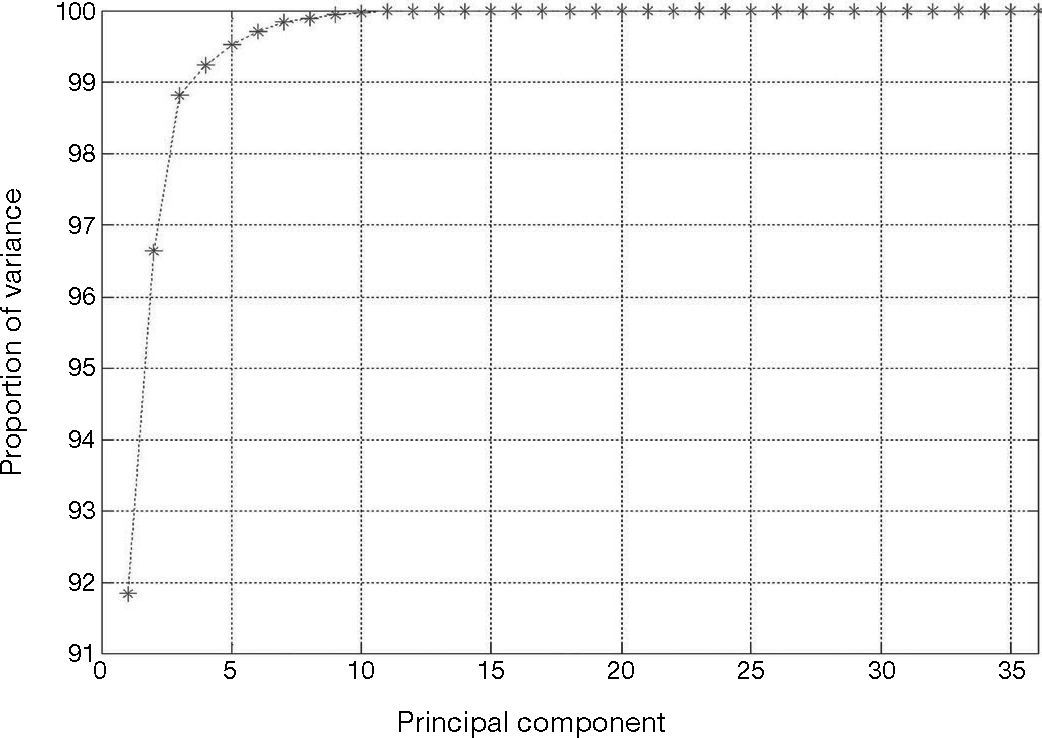
The heartbeats in Y(k), Eq. (12), are the normal beats, premature ventricular contraction, and atrial premature contraction. The total number of heartbeats is N = 36. Every heartbeat has been chosen with M = 180 samples. The linear dimensionality reduction of the input patterns Y(k) is obtained by the PCA technique. This technique provides projection of Y(k) in the direction of highest variance. Figure 8 shows the fraction of total variance in the data as explained by each principal component. As it can be seen the first four principal components account for around 99% of the variance.

Accordingly to the cumulative variance proportion, K = 4 principal components of the input patterns were extracted, with M = 180 components corresponding to the dimensionality of the input pattern, as shown in Eq. (12). Therefore, the number of input patterns in Ypca(k) is K < N. The selected components contribute about 90% —th ≥ 0.90, as shown in Eq. (19)— of the total energy of the signal. These K principal components are used in the next step of the classification as inputs to the neural network.
4.1Discussion of QRS detectionAfter applying the QRS complex detector and obtaining its results from the MIT-BIH arrhythmia database further research is required, especially for improving the detection of negative QRS complexity. However, to compare the performance of previously published algorithms with the proposed algorithm is challenging. This is mainly because algorithms are not tested on the same conditions, nor using the same data or using the same heartbeats even. To illustrate this idea it can be noticed that the performance of any QRS complexity detection algorithm will score higher detection rate (e.g., sensitivity, and positive predictivity) by excluding certain records or by excluding a number of heartbeats. Table 2 compares the performance of the proposed approach among other recent researches for the QRS detection over the MIT-BIH arrhythmia database.
QRS detection performance comparison on MIT-BIH arrhythmia database.
| Work | Beats, n | Se (%) | +P (%) |
|---|---|---|---|
| Proposed | 44,715 | 96.28 | 99.71 |
| Elgendi et al. (2009) (Method I) | 44,677 | 87.90 | 97.60 |
| Pan and Tompkins (1985) | 109,985 | 90.95 | 99.56 |
| Chouakri et al. (2011) | 109,488 | 98.68 | 97.24 |
Several research works use resampling for the ECG signal to improve QRS detection. In our proposed method we do not consider resampling of the ECG signal; however, Pan and Tompkins algorithm (1985) requires resampling for signals not sampled at 200 Hz.
In this work, 5-15 passbands have been used to maximize the QRS energy. However, different researches use different passbands. Pan and Tompkins (1985) achieved passband of about 5-11 Hz by cascaded low-pass and high-pass filters.
In addition, this work uses a first derivation before applying the Hilbert transform which helps to reduce motion artifacts and baseline drifts. According to our results, combination of Hilbert transform and adaptive threshold has a significant effect in the detection of QRS complex (as can be seen in Tables 1 and 2). Also, in the literature, other authors have used threshold step as the last stage for QRS complex detection. This is the case of Pan Tompkins algorithm (Pan & Tompkins, 1985) as well. Also, Elgendi et al. (2009) (Method I) applied adaptive quantized threshold.
Therefore, our proposed QRS complex detection method overcomes the use of fixed thresholds by adapting the upper and lower limited thresholds as presented in section 2.
5ConclusionsThis paper has presented a novel approach for QRS detection of electrocardiogram signals by applying the Hilbert transform and the adaptive threshold technique. In addition, PCA has been implemented for feature extraction of QRS complex.
Our approach for QRS complexes detection introduces an adaptive threshold technique to improve the accuracy of QRS complexes detection in records with ventricular ectopics, negative QRS polarities, low signal-to-noise ratio, and low amplitude R-peaks. Our experiments showed that our proposed approach achieves precise detection rates with an overall positive predictivity of 99.71% and a sensitivity of 96.28% for the performed test case.
As future work we propose to automate the classification of cardiac arrhythmias using multilayer perceptron neural network with a backpropagation learning technique.
This work was supported by PROMEP, grant No. PROMEP/103.5/13/9045, and by Technological University of Ciudad Juarez.