


Detection of failures in induction motors is one of the most important concerns in industry. An unexpected fault in the induction motors can cause a loss of financial resources and waste of time that most companies cannot afford. The contribution of this paper is a fusion of the Empirical Mode Decomposition (EMD) and Multiple Signal Classification (MUSIC) methodologies for detection of multiple combined faults which provides an accurate and effective strategy for the motor condition diagnosis.
Induction motors are the most commonly used prime movers for many equipment in industrial applications; thus, they are popular because of their reliability and simplicity of construction. Several approaches have been proposed for monitoring and diagnosis of induction motors, unfortunately most of them focus on single fault or multiple faults that are not present at the same time [1–2]. However, in a real rotary machine, two or more faults can be present at the same time, so one faulty condition could affect the detection of a differing fault and a wrong decision about the operational condition of the motor could be made. Several techniques have been developed for the diagnosis and monitoring of motors, the classic method used for detection of motor faults is based on the Fast Fourier Transform (FFT) [3]. Unfortunately, the disadvantage of the classic method is that the FFT diagnosis considers the signal linear and stationary, but it is common that numerous natural phenomena have a stringent tendency to behave in a nonlinearly and nonstationary way. Therefore, in recent studies, several advanced signal-processing techniques such as the high-resolution spectral analysis and wavelet analysis have been applied for detection of motor faults. For instance, Grili et al. [4] use de Discrete Wavelet Transform (DWT) to detect a broken bar in squirrel cage motor under speed-varying condition. Antonino-Daviu et al. [5] present a methodology based on the application of the DWT to the stator startup current for detection of four faults (rotor bar breakages, torque fluctuations, mixed eccentricities and inter-coil short-circuits). However, one of the main problems with the wavelet methods is the Wavelet Transform (WT) is not a self-adaptive method. Therefore, it is necessary to choose properly and carefully the mother wavelet, where the contents of her daughter wavelets are largely similar to that of the analyzed signal to ensure suitable results. Further, the multiple signal classification (MUSIC) method provides a high-resolution, improving the diagnosis by detecting frequencies characteristics. Garcia-Perez et al [6], use a bank of filters with a specific frequency band in combination with the MUSIC algorithm, for analysis of the related frequencies with the different faults of the induction motor.
In recent years, the use of the techniques such as the Hilbert Huang Transform (HHT) and the Empirical Mode Decomposition (EMD), introduced by Huang [7], have been used for different applications in sciences and engineering. The EMD method whose function is to decompose signals in their intrinsic mode functions (IMF), where each IMF represents the natural oscillatory mode embedded in the signal. The EMD method has several advantages, such as: it is an adaptive method and it can deal with nonlinear and non-stationary signals [8]. The EMD method is used for detection of different motor faults, as bearings [9–10], short circuit fault [11] and broken rotor bars [12–13]. The works mentioned analyze a single fault; however, it is common to find two or more faults at the same time, as result, a methodology to detect multiple faults is needed. The contribution of this paper is a fusion of the EMD and MUSIC methods for detection of multiple combined faults that provides an accurate and suitable strategy for the motor condition diagnosis.
2Background2.1EMD methodThe EMD is an adaptive method introduced by Huang [7], to decompose nonlinear and non-stationary signals, where each signal obtained by the decomposition is called Intrinsic Mode Function (IMF). The process of obtaining IMF follows the steps below:
- (1)
Extract the local maxima and minima to create the upper and lower envelopes
- (2)
Designate the mean of the upper and lower envelope as m1 and the difference between the signals x(t) and m1 as the first component (h1=x(t)-m1).
If h1 satisfy the conditions of the IMF, take it as the first IMF of x(t). But if h1 is not an IMF; then take it as original signal and repeat the first two steps until h1k satisfies the conditions of IMF, and designate it as c1=h1k.
- (3)
Subtract c1 from the original signal x(t) and let r1=x(t)-c1
- (4)
Treat r1 as the original signal and apply the same process again as above to obtain the others IMFs, c2, c3, .…cn
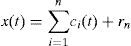
The decomposition process can be stopped when rn becomes a monotonic function from which no more IMF can be extracted. At the end of the process, the resulting formula is shown in Eq. 1.
- (5)
Then, the signal x(t) is decomposed into n intrinsic modes ci(t) and a reminder rn.
The MUSIC algorithm estimates the frequencies of the complex sinusoids that best approximates a noisy signal by using an eigen-based decomposition method. First, consider the signal c(t) as a sum of P complex sinusoids and white noise as Eq. 2.
where Ik, fk, and ϕK are the amplitude, the frequency and the phase of the k-th current-space vector, respectively, j is −1 and cn(t) is white noise. The MUSIC pseudo-spectrum Q of the current space vector follows the orthogonality of the noise and signal subspaces and is given by Eq. 3.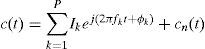
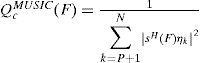
Where skH(Fk) is the signal vector given by skH(Fk)=1s−j2πFi…s−j2πFi(N−1) and ηk is the noise eigen-vector. Expression (3) exhibits the peaks that are exactly at the frequencies of the principal sinusoidal components where the projection of signal and noise subspaces are zero skH(Fk)ηk=0.
2.3Treated FaultsThree different induction motor faults are considered in this work: unbalance, bearing defect and one broken rotor bar.
Broken rotor bar (BRB) fault is possible to detect by locating the frequency components of the current due to the broken rotor bar in the frequency spectrum, which can be determined by Eq. 4.
where fs is the electrical supply frequency, s is the per-unit motor slip, p is the number of poles of the motor, and k/p=1, 3, 5,… denotes the characteristic values of the motor. When a rotor bar breakage takes place, the amplitudes of these components are significantly increased, making their use feasible for the diagnosis of the breakage. Several works [14] focus on the sideband components around the supply current frequency fs as Eq. 5.
Unbalance fault (UNB) is present when the mechanical load of the induction motor is not uniformly distributed, which produces the center of mass, which is not on the center of rotation, if this fault is not looked at early, the condition of unbalance will increase and will cause some components to fail with disastrous results for the machinery.
Bearing defect (BD) occurs by corrosion, unsuitable lubrication or when the bearing is improperly force into the shaft or into the housing. The theoretical ball pass outer raceway frequency (fBPOF) can be calculated by Eq. 6.
where fr is the rotor speed frequency at which the inner raceway rotates, which must be the frequency of the shaft, θ is the contact angle between the bearing surfaces, Dc is the cage diameter of the bearing and it is measured from a ball center to the opposite ball center, Db is the ball diameter, and NB is the number of balls in the bearing.3Experimental setup
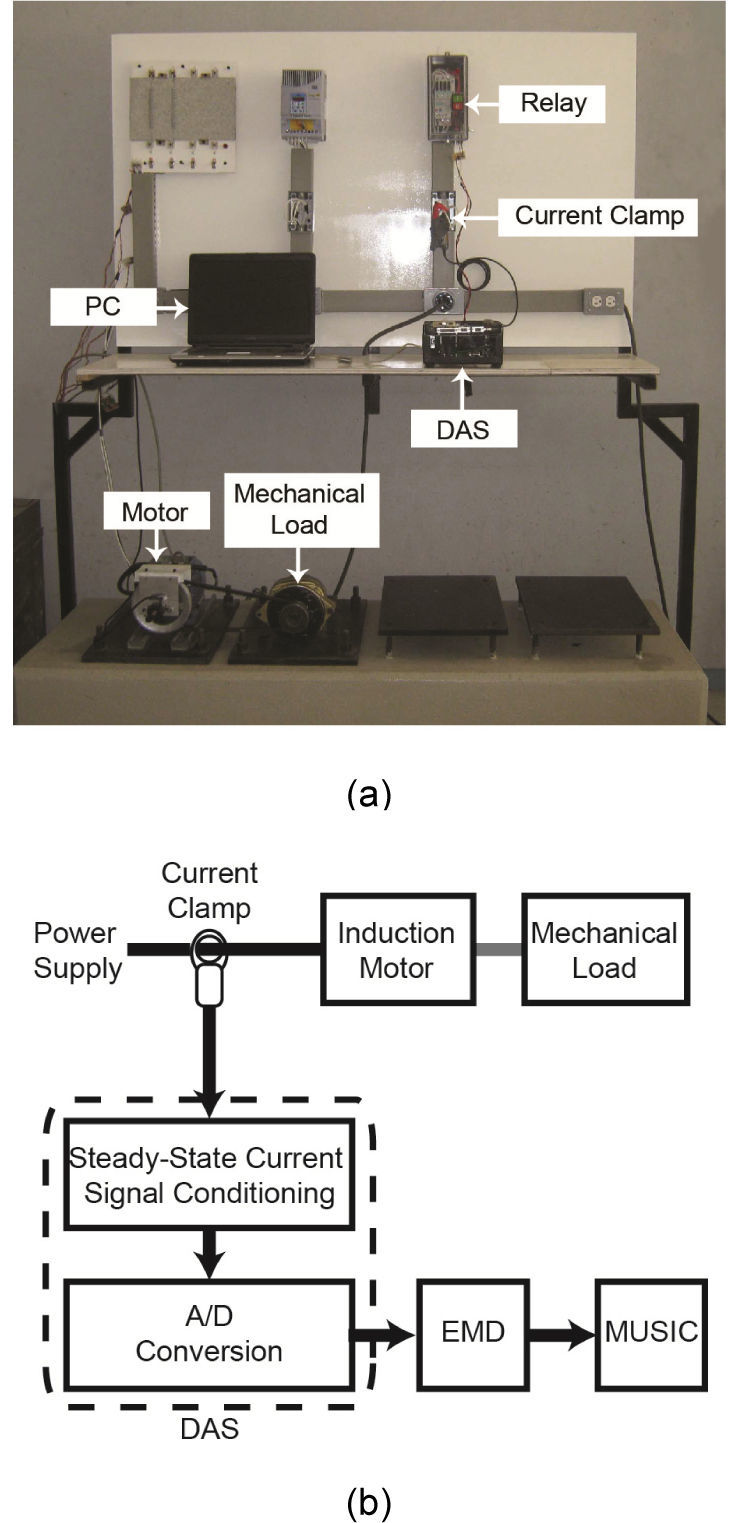
The steady-state current signal is used to find single and multiple combined faults and classify the conditions since this signal describes the dynamic characteristics of the induction motor. Fig. 1 shows the experimental setup where different 1-hp three-phase induction motors (model WEG 00136APE48T) are used to test the performance of the proposed methodology. The tested motors have two poles and 28 bars and receive a power supply of 220 V ac and 60 Hz, and the applied mechanical load is that of an ordinary alternator. The current signal is acquired by using an AC current clamp model i200s from Fluke. A 12-bit four-channel serial-output analog-to-digital converter (ADS7841) is used for data acquisition (DAS). The instrumentation system uses a sampling frequency f0 of 1500 Hz, obtaining 4096 samples during the induction motor steady state. Afterwards the DAS stage, the signal is decomposed in IMFs by the EMD method, where each IMF is analyzed by the MUSIC algorithm that identifies the related fault frequencies and this methodology is implemented in Matlab.
 Test bench used during the experiment. (b) Block diagram of the proposed multiple combined fault diagnosis system for induction motors.")
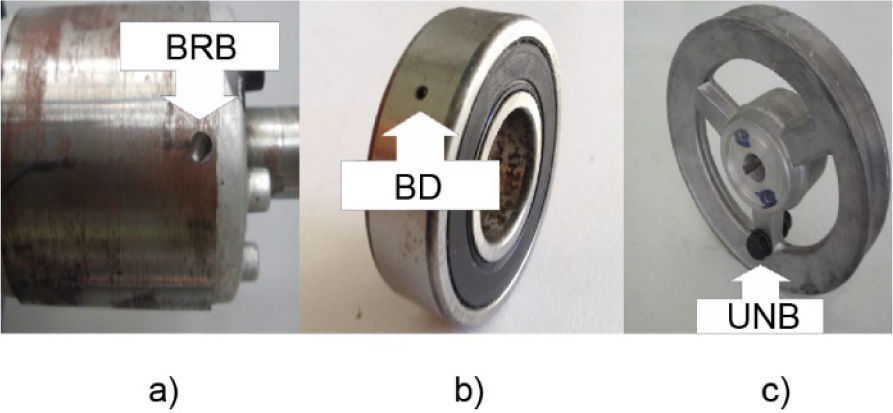
The condition of one broken-rotor-bar (BRB) is produced artificially by drilling one hole with 7.938mm of diameter without damaging the rotor shaft. Fig. 2. (a) shows the rotor with one broken bar used during experimentation. To carry out the faulty bearing defect (BD) test, the bearing is artificially damaged by drilling a hole with 1.191mm of diameter on its outer race using a tungsten drill bit. Fig. 2. (b) shows the artificially damaged bearing model 6203-2ZNR used in this paper.
 One broken bar (BRB). (b) Outer race damaged bearing (BD). (c) Unbalanced pulley (UNB).")
Finally, to test the condition of unbalance (UNB) is produced by drilling a hole of 8mm in one of the pulley arms, where a two-sided screw is inserted and fixed with female screws on each side of the pulley arm as shown in Fig. 2.(c) The added mass (i.e. the screw and female screws) causes the unbalance condition.
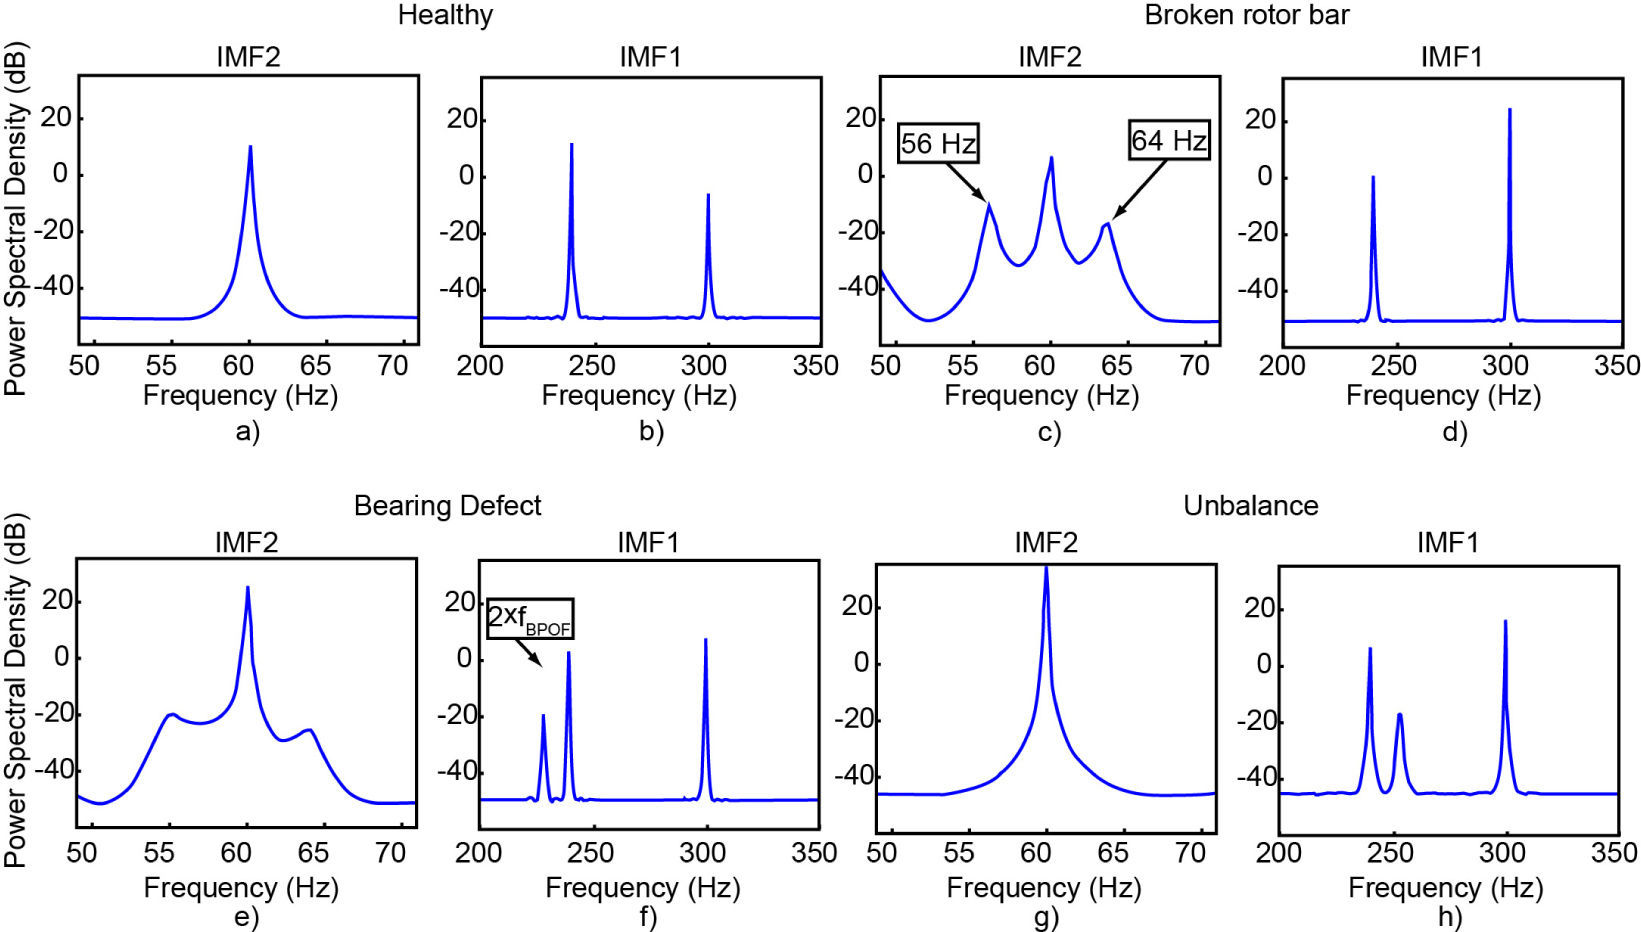
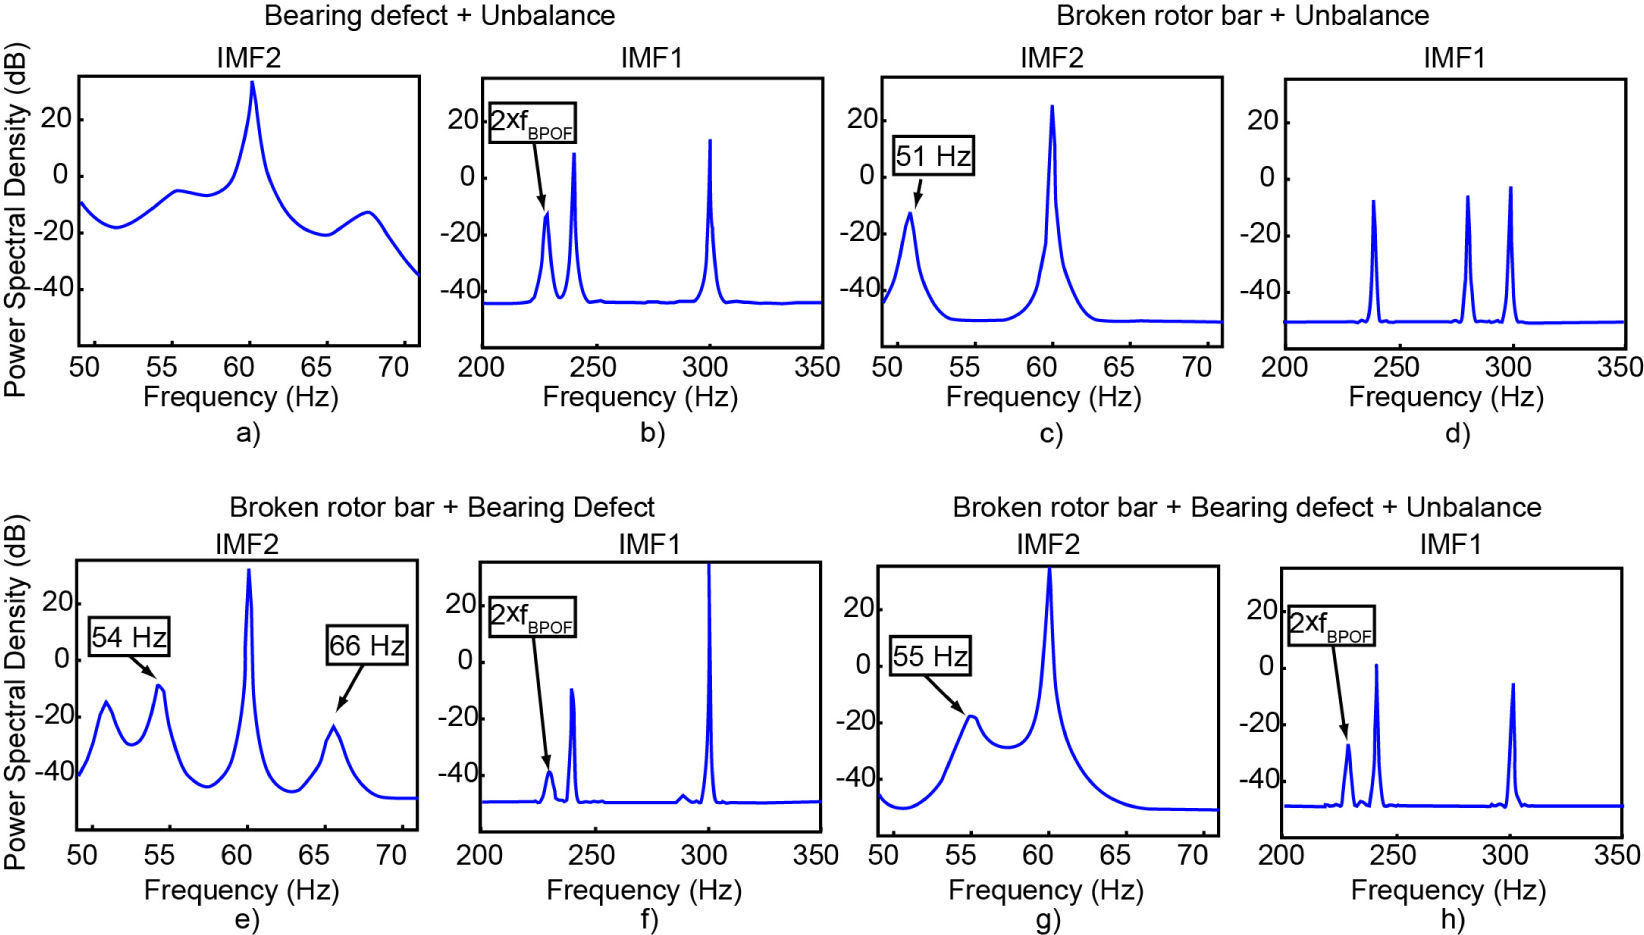
4ResultsThe application of the proposed methodology is verified in several cases in which a single fault (BRB, BD and UNB) or combinations of them are present in the motor. The methodology is analyzed for all the possible healthy and faulty cases, where the steady-state current signal is processed by the EMD algorithm and only the first two IMF are used to analyze the signal with the MUSIC algorithm, because these have the interest regions where faults are located; the first IMF gives information of the BRB and UNB faults, and the second IMF indicates the BD. Thus, the obtained spectra are from the application of low- order MUSIC to the first two IMF as are shown in Figures 3 and 4. The order of the MUSIC algorithm implemented in this work is 8, and it is important to remark that this is a low order and implies a short computation time to obtain the results. The single MUSIC algorithm by itself is unable to detect the related frequencies when a low order is used 8. However, the MUSIC algorithm with a higher order 18 is able to detect the single and the multiple combined faults [6]; but this implies a higher computation time to obtain the results. Figure 3(a-h) consider the healthy and the three single faults spectra treated in this work. Fig. 3(a-b) shows the IMF spectra for a healthy motor. Fig 3(c) shows the spectrum of the broken bar where it is identified when the sidebands appear around the fundamental frequency. These sidebands, which are found in 56 and 64 Hz respectively, are the results of the fault created by the broken-rotor-bar. The presence of the bearing defect according to (6) is verified with the presence of the faulty frequency in 114 Hz, but due to the empirical behavior of the EMD method, this frequency does not appear in the frequency spectrum. However, it is possible to identify the second harmonic of the frequency related to the bearing defect (2xfBPOF) in 228 Hz; which appears in the first IMF spectrum (Fig. 3(f)), where the identification of BD fault is clearly detected. The spectrum for the unbalance fault is presented in Fig. 3(g), and it can be detected by an increase in the fundamental frequency in comparison to the healthy condition; also, the empirical decomposition in the IMF1 shows a fault frequency at 254 Hz. Figure 4(a-h) considers the spectra of three combined faults treated in this work. The combination of the unbalance and bearing defect is detected by an increased fundamental frequency in 60 Hz (UNB) in the IMF2 spectrum show in Figure 4(a) in comparison with the fundamental frequency in 60 Hz for the healthy case (Fig 3(a)) and the 228 Hz frequency component (BD) in the IMF1 spectrum presented in Fig 4 (b). The case of one broken rotor bar with unbalance fault is illustrated in Fig. 4(c) where the left sideband (BRB) is observable, appearing in 51 Hz and an increased fundamental frequency (UNB); also in the Fig. 4 (d), the IMF1 spectrum shows the presence of the left sideband in the fifth harmonic. Fig. 4(e) shows the spectrum for BRB with BD; which is detected by the presence of the frequency components in 54 and 66 Hz that appear in IMF2 spectrum and the bearing defect is detected by the presence of the 228 Hz frequency component in the IMF1 spectrum (Fig. 4(f)). The spectrum in the case of the three combined faults studied in this work, BRB-UNB-BD, is shown in the Fig. 4(g), where the left sideband is emerging in 55 Hz, and the Fig. 4(h) shows the presence of the frequency component in 228 Hz in the IMF1 spectrum.
 IMF2 HLT b) IMF1 HLT c) IMF2 BRB d) IMF1 BRB e) IMF2 BD f) IMF1 BD g) IMF2 UNB h) IMF1 UNB.")
 IMF2 BD-UNB b) IMF1 BD-UNB c) IMF2 BRB-UNB d) IMF1 BRB-UNB e) IMF2 BRB-BD f) IMF1 BRB-BD g) IMF2 BRB-BD-UNB h) IMF1 BRB-BD-UNB.")
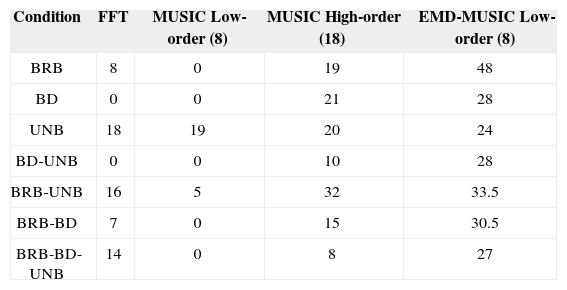
Table I is obtained by comparing the proposed methodology (EMD-MUSIC) in decibels against the traditional Fast Fourier Transform (FFT) method, the single low-order MUSIC algorithm (the same order as the proposed methodology) and the single high-order MUSIC as it is proposed in [6]. The detectability is calculated as the amplitude ratio (in decibels) between the faulty and healthy conditions. The detectability values are obtained from Fig. 3 and 4 in the following way: regarding the cases with one broken bar; the peak value of the left sideband (Df) is compared to the value in decibels of the frequency in the healthy motor (Dh), for the case of BRB the left sideband frequency is -2 dB and the value of the amplitude in the healthy condition is -50 dB; therefore, the detectability value (Dv= Df - Dh) is 48 dB. The case with bearing defect uses the value of the amplitude of the frequency in 228 Hz, for the case of BD the value of the peak is -22 db and the value of amplitude in 228 Hz in the healthy condition is - 50 dB, so the detectability value is 28 dB. The cases in which there is an unbalance fault, the peak of the fundamental frequency increases; therefore the detectability is calculated by comparing the amplitude of the fundamental frequency peak, in this way, the UNB case shows the value of the fundamental frequency peak is 35 dB and in the healthy condition is 11 dB, thus, the detectability is 24 dB.
Making reference to the cases of multiple combined faults, where the different amplitudes of the related fault frequencies are compared, for example, for the BD-UNB case, the fundamental frequency is compared with an amplitude of 35 dB and the frequency of 228 Hz with an amplitude of -18 dB, with the respective amplitude in such frequencies in the healthy condition, hence; the detectabilities calculated of both peaks are 24 dB and 32 dB, thus the mean is calculated, and the resulting detectability is 28 dB. Now, for BRB-UNB case the amplitude value of the left sideband frequency is -11.5 dB and the fundamental frequency amplitude is 29 dB, following the same process above the detectability is 33.5 dB. In the BRB-BD case has a value of -9 dB in the left sideband frequency and in the peak of 228 Hz the amplitude is -30 dB, so the detectability is 30.5 dB.
Finally, for the BRB-BD-UNB case the three frequencies are used for calculating the detectability, the amplitude of the fundamental frequency peak is 35 dB, in the left sideband frequency is -15 dB and in the peak in 228 Hz is - 28 dB, therefore the detectability is 27 dB.
6ConclusionsThe contribution of this work is a methodology to identify multiple combined faults in induction motors through a combined technique of the EMD method and the MUSIC algorithm. The combination of these techniques allows satisfactory results for this challenging task, by analyzing the PSD of the IMF's of steady-state current signal from the induction motor. The EMD method provides an automatic way to decompose the signal, and the combination with a high-resolution spectral analysis (MUSIC algorithm); it makes a suitable methodology to detect faults in induction motors. Results show high agreement with the analytically predetermined fault frequency for single faults and even under the effect of two or three combined faults. The results verify the feasibility and advantage of the proposed approach, which can identify the characteristic frequencies related to the fault.
This work was supported in part by the National Council on Science and Technology (CONACYT), Mexico, under Scholarship: 229594, SEP PIFI-2014 Universidad de Guanajuato grant, and UAQ-FOFI 2012 projects.