


This paper investigates how to control cost of inventory by analyzing the impact of speculation in a dual-supply chain. Manufacturers’ exploit both traditional channel and direct channel independently to deliver goods. A four view Markov chain model was used to formulate total cost performance, with replenishment of inventory in accordance to Poisson process. Our numerical calculations divulge these findings, in the long run; (i) increasing speculation with increasing foreign search rate, rises warehouse lost sales (ii) increasing speculation, increasing local and foreign search rate with increasing total cost components results in holding cost diminishing aiding collapse of manufactures’ product, (iii) as local, foreign or both search rate increase; (a) holding cost at warehouse and retailer remains constant but diminishes in its percentage contribution to total cost, (b) lost sales cost at warehouse keeps rising, and (c) our proposed two-echelon dual-supply chain may perform better than single supply chain, and (iv) increasing local and foreign search rate against increasing total cost components, escalate total cost. According to the authors, the issue at hand is: speculation impact on total cost not only creates opportunities for manufacturers to expand their products and gain profit but also produces a hazardous side-effect for it can collapse the product.
Friedman et al. defined a speculator as one who invests with the anticipation that an event or series of event will occur to increase the value of the investment [1]. For example, if the value of a product (stock, textiles, fashion goods, luxurious product, food stuffs etc.) has being appreciating rapidly in recent times, a speculator will purchase several units in anticipation that the appreciation of the value will continue. The motive behind financial speculation is to secure capital gain (arbitrage) simply by buying cheap, holding and then selling the product at higher price. The activities of speculators leads to several market sways like: (i) collapsing a product market, Pornchokchai & Perera, (ii) destabilizing market prices [2], Chang et al., (iii) exerting a stabilizing influence on markets [3], Friedman, (iv) have no impact on marker volatility [4], Radalj, Du and Kaufmann using different strategies, (v) devaluing a nations’ currency and collapsing its exchange rate regime [5-7]. This paper researches on the speculation impact of total cost of inventory.
Some research have touch on financial constraint (firms having internal capital constraint: i.e. not having sufficient capital to install the ideal inventory level) on supply chain. Pires examines the impact of financial constraint on the choice of supply chain modes and constraint base on stackelber game [8]. Li studied multi-item IRP model with considering lateral transhipment and financial decisions is proposed as a business model in a distinct organization [9].
Buzacott and Zhang investigate a firms optimal production decision in multiple period with financial constraint and asset-based financing [10], Berman et al. studied on how operational decision of a firm manager depends on his/her own incentives, the capital structure, and financial decision in the context of the newsvendor framework [11] and Xu explained that facing bankruptcy risk due to demand uncertainty, a newsvendor-like firm will reduce inventory investment under capital constraint [12]. This paper differ from all these paper in these areas; (i) it considers a two-echelon dual-channel supply chain under two different market segments, (ii) speculators’ speculation on manufacturers products originates from foreign market, and (iii) no financial constraint.
There are several researches on dual supply chain: Chiang and Park examined a price-competition game in a dual channel supply chain [13-14], Yao considered a dual channel supply chain in which a retailer uses prices and services to attract customers [15], Lei et al. worked on return product after rework in a dual-channel supply chain [16], Huang et al. modeled a dual supply chain were manufactures action to operate direct channel is counteracted by retailers introducing their store brand products and others papers [17]. Zhao et al. proposed the commitment contracts for the drop shipping supply chain. In drop shipping supply chain, if the retailer’s order quantity achieves decentralized level, the profit of the supply chain can be maximized [18].
To overcome these problems, Chaing & Monahan [19] proposed a two-echelon dual-channel inventory model in which stocks are kept in both manufacturer warehouses (upper echelon) and retail stores (lower echelon); furthermore, the product is available in two supply channels, namely a traditional retail store and an internet-enabled direct channel. According to their findings, the dual-channel strategy outperforms the other two channel strategies in most cases; additionally, the cost reductions realized by the flexibility of the dual-channel system may be significant in some cases. To further develop this model, Takahashi et al. [20] proposed a setup of production and delivery and created a new inventory control policy for the supply chain. In this paper, we intend to go beyond the proposals of Chaing & Monahan as well as the further developments of Takahashi et al. because we are aware that in times of stockout in either channel, customers search for options and cannot shift to the other channel, due to high direct channel demand of product coupled with speculation activities. Our goal is to create opportunities for manufacturers to expand their products and gain profit while preventing the hazardous side-effect of collapsing the product.
The rest of the paper is structured as follows. The subsequent section gives the model descriptions, assumptions and inventory control policy of two-echelon dual-channel supply chain. Next a Markov chain model and flow balance equation with its total cost performance measures are described and formulated. The following section presents the numerical calculated total performance under various conditions like speculators actions, demand variations, etc. the paper concludes with its findings.
2Two-echelon dual-channel supply chain modelWe discuss a two echelon dual-channel supply chain model (see figure 1) and its assumptions are:
- 1.
Products are available to customer via two channels, a traditional and an internet direct channel; the traditional channel (serves local market) and the direct channel (serves foreign markets) is two different market segments;
- 2.
The inventory at the retailer is used to satisfy the demand from traditional channel, and the inventory at the warehouse is used to satisfy the demand from the direct channel;
- 3.
The product price is different for both channel and the system receives stochastic demand from two customers segment. Each customer segment has an independent demand arrival;
- 4.
Demand through the retailer channel arrives in accordance with a Poisson process at constant rate Ar and is met with inventory at the retailer;
- 5.
Demand through the direct channel arrives at the manufacturer directly in accordance with a Poisson process at constant rate Ad and is met through direct delivery with the inventory at the manufacturer. The inter-arrival time between successive demand follows an exponential distribution with mean 1/λ;
- 6.
The total demand arrival rate is λ (=λr + λd), in a 1:2 ratio (i.e. λr =1: λd =2). The traditional channel preference is a, so λr = αυ and that of direct channel is β, so λd = βv; Backorders are not allowed, implying backorders equals zero;
- 7.
The lead time from releasing an order to starting inventory replenishment to make up for orders is neglected; the inventories at the retailer and manufacturer are replenished from the warehouse and the manufacturer, respectively, in accordance with a Poisson process at constant rates ur and uw respectively. That is, there is two-echelon supply system. The replenishment times for the retailer and the manufacturer follows and exponential distribution with means 1/ μr and 1/ μw, respectively;
- 8.
Financial speculation pressure if felt at the direct channel increasing the direct channel demand from v to 0 (i.e. product gains value each day on the foreign market). As speculator’s participations increases the direct channel demand rises from λd = βv to λd =βθ (v + θ ≈ θ) and no financial constraint.
- 9.
The total demand arrival rate is λ(= λr + λd) in a 1:2ratio (i.e. λr = 1, λd = 2). The traditional channel preference is a, so λr= αυ and that of direct channel is β so λd =βv. As speculator’s participations increases direct channel demand rises from λd =βv to λd =βθ (v + θ ≈ θ).
- 10.
Local search rate a and foreign search rate p is defined as customers preference (desire) to consume (exploit) manufacturer’s product. As α or β increases from (0.1 to 1) customer desire increases.

This paper studies the impact of speculation on total cost of inventory in a two-echelon dual-supply chain. The traditional channel and the direct channel are two different market segments; the traditional channel focus on the local market whiles the direct channel focus on foreign market. The inventory control policies are:
- (i)
Total Cost = inventory cost + lost sales cost + production setup cost + delivery Setup Cost+ (shortage cost=backorder cost=0);
- (ii)
No matter speculator pressure, the inventory policy intends to reduce inventory and minimize total cost;
- (iii)
Maximum inventory at warehouse is x and that of the retailer is y, minimum inventory at warehouse and retailer are xm and ym respectively.
The state (x, y) changes with demand arrival through the direct channel λd and λr for traditional channel and production and delivery rate to warehouse and retailer are μw and μr respectively.
Reducing lost sales, timing is controlled. Let td and tr defines the state of production and delivery to the manufacturer and the retailer respectively, set at 1 when production or delivery continuous and 0 when its stopsi.e.iftd=1⇒Sw
To enable us to analyze the performance policy for our study, we developed a four view Markov chain model. Markov chain model is used due to its memory less or the Markovian property, which states that the state transition from a given stat depends only on the current state, but not the history or how we reached that particular state.
3.1Markov chain modelThe total cost performance policy under the Markov chain model is expressed in four planes of two dimensions; representing state 0 and 1 of production td and delivery tr as in figure A.1.
Four variables x,y,td and tr defines our system state as explained in our inventory control policy point four. In fig. A.1, if demand of one unit arrives through the direct channel / retailer at a rate λd / λr the inventory at the warehouse / retailer decrease one unit and the state (x, y) changes to (x-1, y) / (x, y-1) respectively.
Besides if one unit is produced and delivered to the warehouse / retailer at rate μw / μr the inventory at the warehouse / retailer increases by one unit (x+1, y) / (x-1, y+1).
In times of speculators intense speculation, the demand arriving through the direct channel increases the demand to θ leading to a decrease at the warehouse by (x-θ, y) while the production and delivery rate at the warehouse is (x+1, y).
The four total cost performances improved Markov chain planes are define as: (i) producing, deliveringtd=1,⇒Sw=x,andtr=1,⇒Sr=y
(ii) producing, delivery stoppedtd=1,⇒Sw=x,andtr=0,⇒Sr (iii) production stopped, deliveringtd=0,⇒Sw and (iv) production and delivery stoppedtd=0,⇒Sw
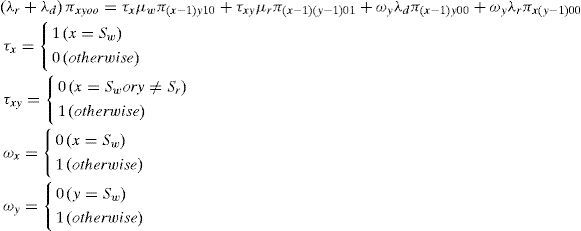
Let πxytdtr be the steady-state probability of the state x, y being inventory at the warehouse and retailer respectively and the state of producing and delivering td and tr.
The flow balance equation was first developed by Takahashi et al [20] where customers can access manufacturer products from both cannel but in this paper we extend it.
Customers can access product from only one channel with speculation activities invovled. The flow balances according to our four Markov chain are:
- (i)
Production and delivery stopped; for the state (x, y), the flow balance equation is;
- (ii)
Producing, delivery stoppedtd=1,⇒Sw=x,andtr=0,⇒Sr
- (iii)
Production stopped,td=0,⇒Sw
For the state (x, y) the flow balance equation is;
- (iv)
Producing, deliveringtd=1,⇒Sw=x,andtr=1,⇒Sr=y
The flow balance equation for the state (x, y) is;
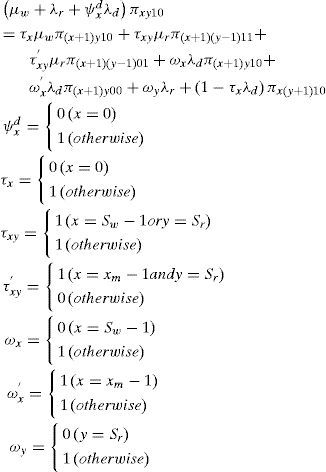
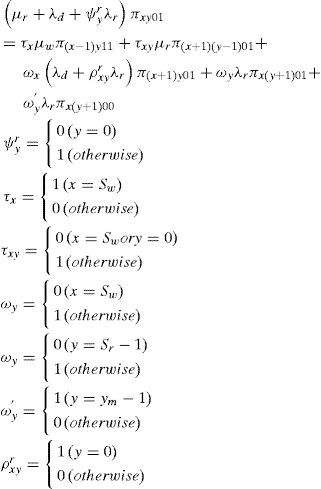
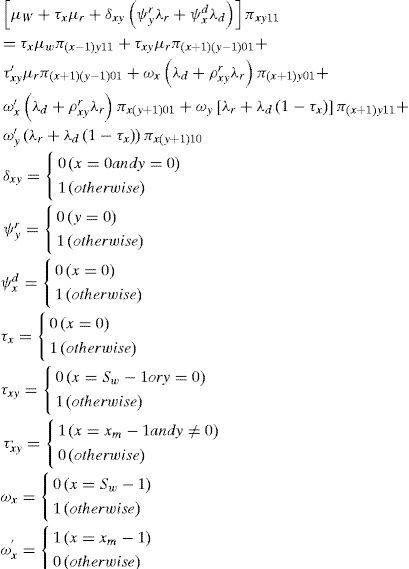
The sum of the steady-state probabilities of all the state equals to one, and a flow balance equation is added to the above equation.
3.3Performance measures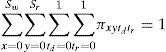
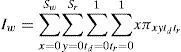
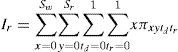
The performance measured used in this paper has being stated clearly in our inventory control policies in section 2.1 point 1. It is calculated by calculating the following expectation after calculation the steady-state probability πxytdtr The steady state probability is calculated simultaneously solving equation (1) to (5). The expected inventory at the warehouse Iw and the retailer Ir are calculated, respectively, using the calculated steady-state probabilities:
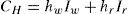
Let hw and hr be the unit inventory holding cost at the warehouse and the retailer respectively. Inventory holding cost CH is:
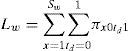
The probability of stockout only at the warehouse and only at the retailer Lw, and Lr are calculated using:
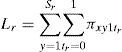
Let cm be the unit lost sales cost. Lost sales cost CL is calculated using

Production starts when the inventory at the warehouse is at the upper limit Sw and demand for a unit arrives through the direct channel at rate λd when manufacturer’s products are not under any speculator’s attack but increase to θ if it is or a unit is delivered to the retailer at rate μr. Production is stopped when the warehouse inventory is one unit less than Sw and a unit is produced and delivered to the warehouse at rate μw. Let Cd be the unit setup cost to start and stop production. Delivery to the retailer is started when the retailer inventory is at Sr and demand for a unit arrives through the retailer channel at rate λr.
Delivery to the retailer is stopped when the retailer inventory is at one unit below Sr and a unit is delivered to the retailer at rate μr. Let cr be the unit setup cost to start and stop delivery to the retailer. The performance policy for production and delivery setup costs and are calculated as;

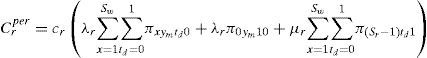
Finally the total cost of the setup and improved policies are calculated respectively using:
4Numerical calculations
To gain managerial insight into our performance policy on speculators activities on production we perform qualitative investigation. The parametric values used for the numerical analysis are given in table 1. METLAB program was written to do the parametric analysis of the two-echelon dualchannel inventory with production and delivery setup costs.
Base Parametric Values.
| Base Parametric Definition | Values |
|---|---|
| 1. Warehouse replenishment rate (μw) | 10 |
| 2. Retailer replenishment rate (μr) | 5 |
| 3. Total Demand λ = 15 | 15 |
| 4. Demand arrival direct channel λd=10 Demand arrival traditional channel λr =5 | |
| 5. Speculator participations increasing demand from (v) to θ →λd | 100 |
| 6. Holding cost warehouse (hw) | 5 |
| 7. Holding cost retailer (hr) | 10 |
| 8. Lost sales cost (cm) | 5 |
| 9. Production setup cost (cd) | 2 |
| 10. Delivery setup cost (cr) | 1 |
As local α search rate increase, total cost composition experiences constant holding cost retailer and warehouse, warehouse lost sales while production and delivery setup cost and retailer lost sales experience gradual escalation as displayed in figure 2 and table A.1.

The percentage contribution of constant holding cost at warehouse, retailer, lost sales warehouse and rising production setup cost to total cost keeps declining, but that of escalating lost sales at retailer and delivery setup cost keeps surging. Manufacturers’ dilemma in times of increasing local search rate lies with delivery setup cost and lost sales at retailer. This can be improved by improving delivery rate system and assisting retailers’ with good supply contracts.
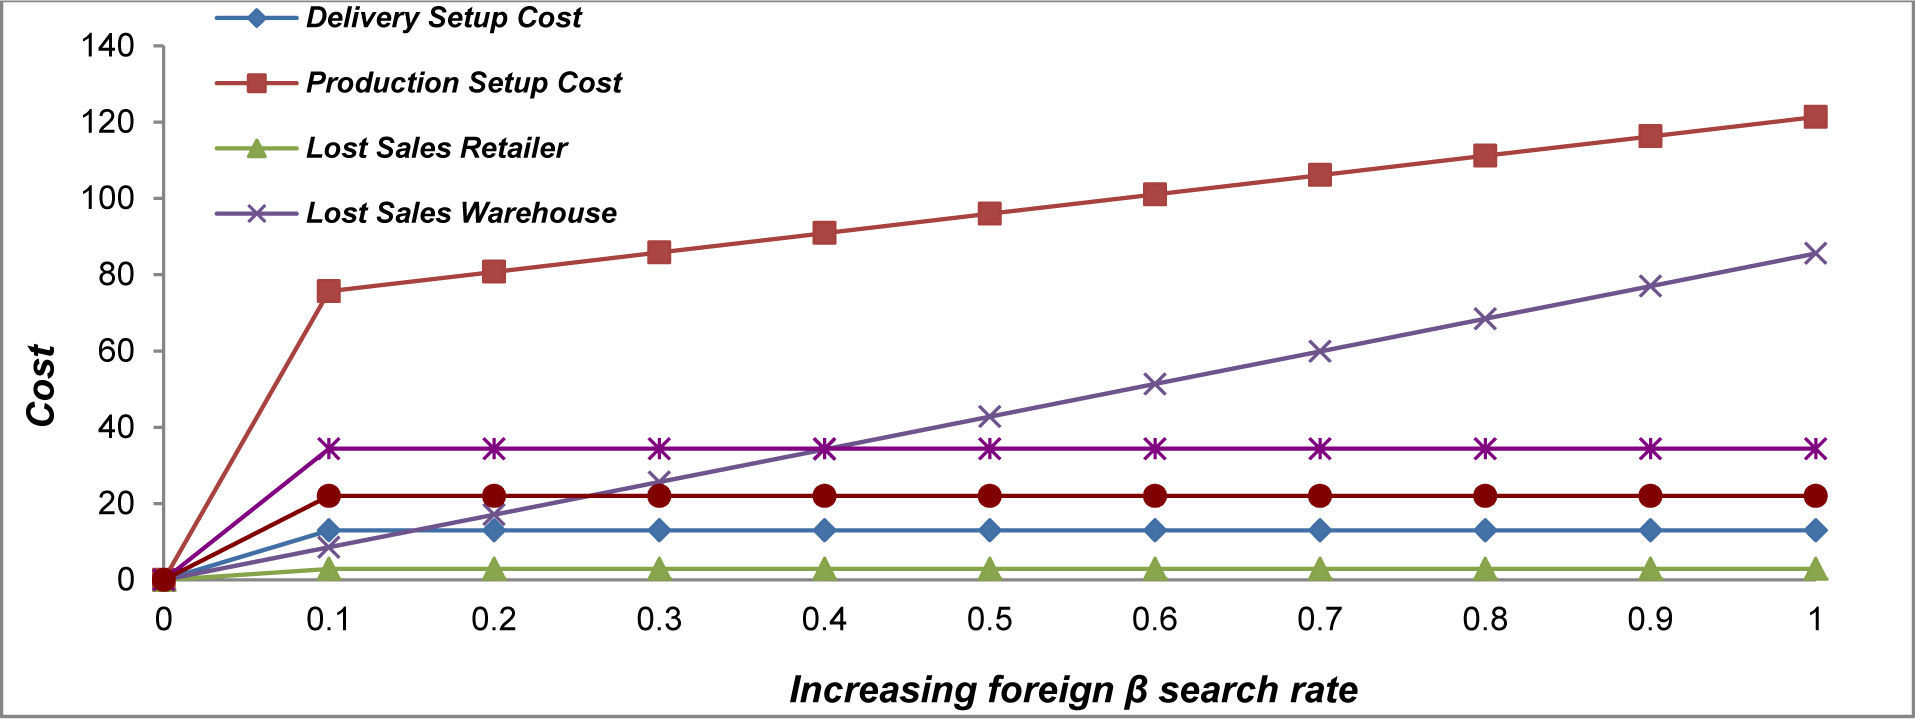
4.1.2Holding local α search rate constant and varying foreign β search rate:In times of increasing foreign β search rate, holding cost at warehouse and retailer, lost sales cost retailer and delivery setup cost result in constant input to total cost but warehouse lost sales cost and production set up cost escalate total cost as display in figure 3 and table A.2.

The percentage contributions of all the constant cost contributors’ to total cost plus production setup cost diminishes leaving lost sales cost at warehouse growing total cost.
As foreign β search rate increases manufacturer’s holding policy does not keep up with demand leading to high lost sales at warehouse coupled with tarnishing company’s goodwill though warehouse holding cost is cheaper compared to that of retailers’.Management in tackling such happening can improve production rate, delivery rate of receiving goods and enlarging holding cost capacity since they operated under no financial constraint.
4.1.3Varying local α and foreign β search rate:Holding cost at warehouse and retailer are constant, but lost sales cost warehouse and retailer and production and delivery setup cost rise total cost as local α and foreign β search rate increases as shown in figure 4 and table A.3. Comparing table A.3 to table A.1 and A.2 we observe same value for all components of total cost expect production setup cost. Holding cost at warehouse and retailer plus production and delivery setup cost impact of contribution to total cost diminishes leaving lost sales at warehouse and retailer to escalate total cost.

This outcome equips management to keep keen eyes on lost sales cost in times of intense local and foreign demand of product. We may say our two-echelon dual-supply chain performance is better than single supply chain.
We may conclude that as local α, foreign β or both search rate increase; (i) holding cost at warehouse and retailer remains constant but diminishes in its percentage contribution to total cost, (ii) lost sales cost at warehouse keeps rising, and (iii) our proposed two-echelon dual-supply chain may perform better than single supply chain.
4.2Scenario analysisFigure 5 and table A.4 shows the effect of varying local α and foreign β search rate against increasing warehouse holding cost hw, retailer holding cost hr, unit lost sales cost cm, production setup cost cd and delivery setup cost cr. As cost of holding at warehouse hw and retailer hr raises its percentage increment to total cost keeps depreciating.

This puzzle may be traced to demand and supply of product why? Increasing cost of holding hw and hr manufacturers’ and retailers’ are forced to hold few products since they cannot tie all their investment up. Besides the situation forced management to research into factors like (material handling, storage, damages, obsolescence, insurance, taxes and all other variable cost) that inflate holding cost.
Percentage lost sales warehouse and retailer rises gradually as unit lost sales cost cm rise.
That of lost sales at warehouse is greater than that of retailers which is attributed to high foreign demand. High lost sales at both ends runs to holding cost principles, since holding cost is high. High stockout affects product goodwill in the long run. A backlogging practice can minimize high stockout which our assumption does not support.
Besides, as unit cost of production cost cr increase production setup cost increases. This is traced to direct demand of product λd, retailers demand λr, warehouse delivery rate μw, and production setup cost (like administration cost, transportation cost, labor, material handling etc.). Manufacturers are faced with several challenges controlling demand, since demand varies very often.
Warehouse delivery rate μw can be improved by reducing high production cost components, ordering goods in batches, influencing retailers with good supply contract etc. Finally, as unit cost to start and stop delivery cr augment, delivery setup cost increases with its percentage of increment fluctuating.
This augment is attributed to retailer demand channel rate λr, which poses high challenge in terms of its control and delivery to retailer rate μr, easy to improve by improving delivery rate channels. In sum increasing local α and foreign β search rate against increasing total cost component cost keeps total cost rising.
4.3Speculator’s participationSpeculators invest with the anticipation that an event or series of event will occur to increase the value of their investment, collapse a product market, destabilizing market, exerting a stabilizing influence on market, etc. Their motive is to secure capital gain (arbitrage) simply by buying cheap, holding and then selling the product at high price. This section analyzes speculators’ demand activities impact manufacturer’s operations.
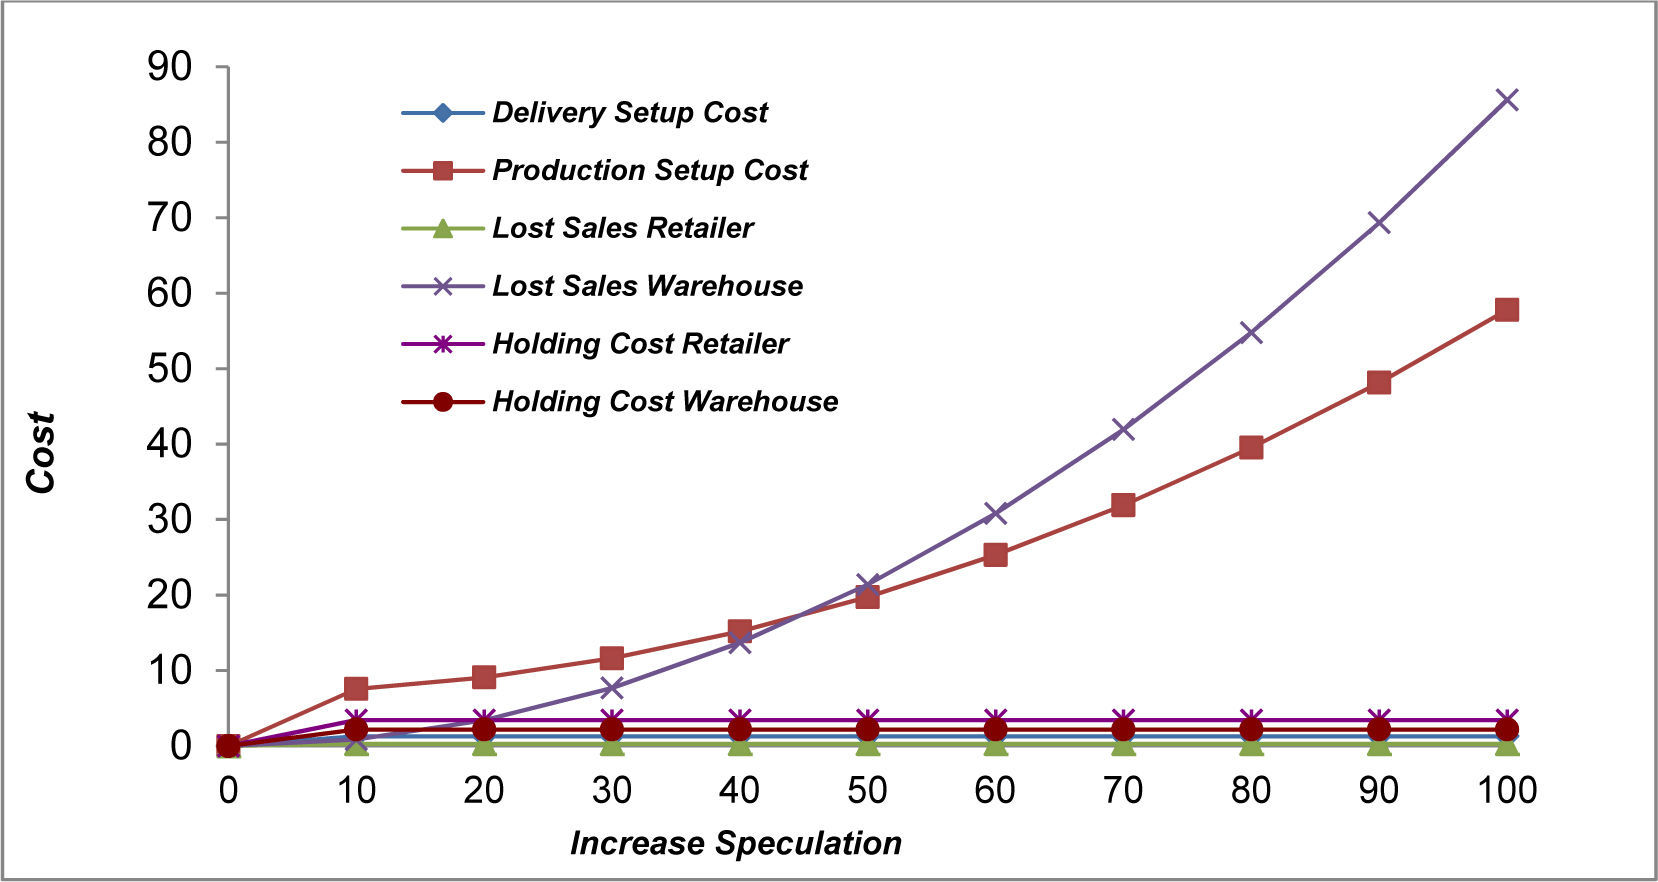
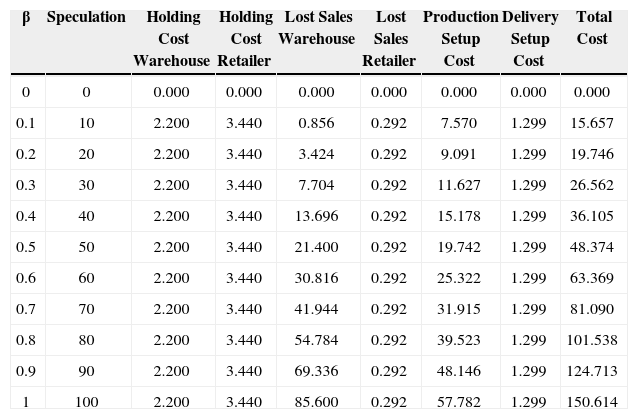
In figure 6 and table A.5, as speculation increases, with increasing foreign β search rate with constant cost, we observed a constant holding cost at warehouse, retailer, lost sales retailer and delivery setup cost. All cost components contributing to total cost decreases as speculation increases expect lost sales at warehouse which appreciates. Per our assumption of no financial constraint, management can improve its production to reduce lost sales. Increasing production is directly proportional to reducing lost sales cost and increasing profitability of manufacturer product depending on management risk taking ability. High profit may lead to product collapse in the long run: as manufacturers’ product keeps multiplying spuriously in the market, its tendency of reaching it bubble is very high in the long run. A three dimensional graph was plotted with total cost with speculation table A.5 against total cost without speculations table A.2, as shown in figure 7. Total cost kept rising gradually given it a bent like kite shape with total cost gradual increment been attributed to large cost of warehouse lost sales.


Increasing speculation, increasing warehouse holding cost hw, retailer holding cost hr, unit lost sales cost cm, production setup cost cd and delivery setup cost cr and increasing local α and foreign β search rate are depicted in figure 8, table A.6.

Holding cost at warehouse and retailer escalate but it percentage contribution to total cost fades away drastically but that of lost sales cost warehouse and retailer, and production and delivery setup cost ascend and rises percentage to total cost. In conditions of intense speculation coupled with increasing unit cost, holding cost vanishes since its costive and does not contribute a large amount to total cost which leads to high lost sales cost at warehouse and retailer and high production and delivery setup cost. Manufacturers’ may be tempted to scrap off holding cost. No holding of manufacturers’ product endangers product since speculators’ may be achieving their intentions of collapsing the product.
Such phenomenon can be minimize by manufacturers’ by introducing holding stock band (say 3000 for lower band and 12000 for higher band) as shown in figure 10.

As far as holding cost fall within the band manufacturers’ are safe but beyond such band triggers awareness. Figure 9 display how total cost grow uncontrollably with speculation increase and increase cost, and without speculation with increase cost. Another way of combating speculator impact on total cost of inventory is to increase holding inventory capacity. Increasing holding inventory increases holding cost and opportunity cost which minimizes manufacturer’s lost sales in times of speculator activities. But manufacturer uncertainty about speculators’ phenomena defeats increasing inventory capacity. We can then conclude that keeping a lost sales band may help detect and protect manufacturer from speculators activities.
5Conclusions
This paper studied the impact of speculation on total cost of inventory in a two-echelon dual-supply chain. Manufacturers’ delivers product via two channel, traditional channel (serve local market) and direct channel (serving foreign market) independently with speculation activities originating from foreign market. Manufacturers’ product is experiencing high demand on foreign market (i.e. 1 local demand: 2 foreign demand) and management operates under no financial constraints.
A four view Markov chain model was developed to formulate total cost performance, with replenishment of inventory in accordance with Poisson process. Our numerical calculation divulge the findings: in the long run (i) as local, foreign or both search rate increase; (a) holding cost at warehouse and retailer remains constant but diminishes in its percentage contribution to total cost, (b) lost sales cost at warehouse keeps rising, and (c) our proposed two-echelon dual-supply chain may perform better than single supply chain, (ii) increasing local and foreign search rate against increasing total cost components, total cost keeps escalating, (iii) increasing speculation with increasing foreign search rate, warehouse lost sales rise, and (iv) increasing speculation, increasing local and foreign search rate with increasing total cost components results in holding cost diminishing aiding collapse of manufactures’ product. In a word, our paper proves that speculation impact on total cost of not only creates opportunities for manufacturers to expand their products and profit but also poses a threat as it can collapse the product.
This work is partially supported by the National Natural Science Foundation of China (71172174) and Ph.D Programs Foundation of Ministry of Education of China (20110075110003), Shanghai Pujiang Program (12PJC020), Innovation Program of Shanghai Municipal Education Commission (12ZS58). We are thankful for the financial support.
Figure
.")
Tables
Increasing Local α Search Rate.
| α | Holding Cost Warehouse | Holding Cost Retailer | Lost Sales Warehouse | Lost Sales Retailer | Production Setup Cost | Delivery Setup Cost | Total Cost |
|---|---|---|---|---|---|---|---|
| 0 | 0.000 | 0.000 | 0.000 | 0.000 | 0.000 | 0.000 | 0.000 |
| 0.1 | 22.000 | 34.400 | 8.560 | 1 1.460 | 75.424 | 11.896 | 153.740 |
| 0.2 | 22.000 | 34.400 | 8.560 | 1 2.920 | 75.696 | 12.992 | 156.568 |
| 0.3 | 22.000 | 34.400 | 8.560 | 4.380 | 75.968 | 14.088 | 159.396 |
| 0.4 | 22.000 | 34.400 | 8.560 | 5.840 | 76.240 | 15.184 | 162.224 |
| 0.5 | 22.000 | 34.400 | 8.560 | 1 7.300 | 76.512 | 16.280 | 165.052 |
| 0.6 | 22.000 | 34.400 | 8.560 | 1 8.760 | 76.748 | 17.376 | 167.844 |
| 0.7 | 22.000 | 34.400 | 8.560 | 10.220 | 77.056 | 18.472 | 170.708 |
| 0.8 | 22.000 | 34.400 | 8.560 | 1 11.680 | 77.328 | 19.568 | 173.536 |
| 0.9 | 22.000 | 34.400 | 8.560 | 1 13.140 | 77.600 | 20.664 | 176.364 |
| 1 | 22.000 | 34.400 | 8.560 | 14.600 | 77.872 | 21.760 | 179.192 |
Increasing Foreign β Search Rate.
| β | Holding Cost Warehouse | Holding Cost Retailer | Lost Sales Warehouse | Lost Sales Retailer | Production Setup Cost | Delivery Setup Cost | Total Cost |
|---|---|---|---|---|---|---|---|
| 0 | 0.000 | 0.000 | 0.000 | 0.000 | 0.000 | 0.000 | 0.000 |
| 0.1 | 22.000 | 34.400 | 8.560 | 2.920 | 75.697 | 12.992 | 156.569 |
| 0.2 | 22.000 | 34.400 | 17.120 | 2.920 | 80.768 | 12.992 | 170.200 |
| 0.3 | 22.000 | 34.400 | 25.680 | 2.920 | 85.840 | 12.992 | 183.832 |
| 0.4 | 22.000 | 34.400 | 34.240 | 2.920 | 90.912 | 12.992 | 197.464 |
| 0.5 | 22.000 | 34.400 | 42.800 | 2.920 | 95.984 | 12.992 | 211.096 |
| 0.6 | 22.000 | 34.400 | 51.360 | 2.920 | 101.056 | 12.992 | 224.728 |
| 0.7 | 22.000 | 34.400 | 59.920 | 2.920 | 106.128 | 12.992 | 238.360 |
| 0.8 | 22.000 | 34.400 | 68.480 | 2.920 | 111.200 | 12.992 | 251.992 |
| 0.9 | 22.000 | 34.400 | 77.040 | 2.920 | 116.272 | 12.992 | 265.624 |
| 1 | 22.000 | 34.400 | 85.600 | 2.920 | 121.344 | 12.992 | 279.256 |
Increasing Local α and Foreign β Search Rate.
| α & β | Holding Cost Warehouse | Holding Cost Retailer | Lost Sales Warehouse | Lost Sales Retailer | Production Setup Cost | Delivery Setup Cost | Total Cost |
|---|---|---|---|---|---|---|---|
| 0 | 0.000 | 0.000 | 0.000 | 0.000 | 0.000 | 0.000 | 0.000 |
| 0.1 | 22.000 | 34.400 | 8.560 | 1.460 | 75.424 | 11.896 | 153.740 |
| 0.2 | 22.000 | 34.400 | 17.120 | 2.920 | 80.768 | 12.992 | 170.200 |
| 0.3 | 22.000 | 34.400 | 25.680 | 4.380 | 86.112 | 14.088 | 186.660 |
| 0.4 | 22.000 | 34.400 | 34.240 | 5.840 | 91.456 | 15.184 | 203.120 |
| 0.5 | 22.000 | 34.400 | 42.800 | 7.300 | 96.800 | 16.280 | 219.580 |
| 0.6 | 22.000 | 34.400 | 51.360 | 8.760 | 102.144 | 17.376 | 236.040 |
| 0.7 | 22.000 | 34.400 | 59.920 | | 10.220 | 107.488 | 18.472 | 252.500 |
| 0.8 | 22.000 | 34.400 | 68.480 | 11.680 | 112.832 | 19.568 | 268.960 |
| 0.9 | 22.000 | 34.400 | 77.040 | 13.140 | 118.176 | 20.664 | 285.420 |
| 1 | 22.000 | 34.400 | 85.600 | 14.600 | 123.520 | 21.760 | 301.880 |
Increasing Speculation.
| β | Speculation | Holding Cost Warehouse | Holding Cost Retailer | Lost Sales Warehouse | Lost Sales Retailer | Production Setup Cost | Delivery Setup Cost | Total Cost |
|---|---|---|---|---|---|---|---|---|
| 0 | 0 | 0.000 | 0.000 | 0.000 | 0.000 | 0.000 | 0.000 | 0.000 |
| 0.1 | 10 | 2.200 | 3.440 | 0.856 | 0.292 | 7.570 | 1.299 | 15.657 |
| 0.2 | 20 | 2.200 | 3.440 | 3.424 | 0.292 | 9.091 | 1.299 | 19.746 |
| 0.3 | 30 | 2.200 | 3.440 | 7.704 | 0.292 | 11.627 | 1.299 | 26.562 |
| 0.4 | 40 | 2.200 | 3.440 | 13.696 | 0.292 | 15.178 | 1.299 | 36.105 |
| 0.5 | 50 | 2.200 | 3.440 | 21.400 | 0.292 | 19.742 | 1.299 | 48.374 |
| 0.6 | 60 | 2.200 | 3.440 | 30.816 | 0.292 | 25.322 | 1.299 | 63.369 |
| 0.7 | 70 | 2.200 | 3.440 | 41.944 | 0.292 | 31.915 | 1.299 | 81.090 |
| 0.8 | 80 | 2.200 | 3.440 | 54.784 | 0.292 | 39.523 | 1.299 | 101.538 |
| 0.9 | 90 | 2.200 | 3.440 | 69.336 | 0.292 | 48.146 | 1.299 | 124.713 |
| 1 | 100 | 2.200 | 3.440 | 85.600 | 0.292 | 57.782 | 1.299 | 150.614 |
Increasing Local α and Foreign β Search Rate with Increasing hw, hr, cm, cd, and cr.
| α & β | Holding Cost hw | Holding Cost hr | Unit Lost Sale cm | Production Setup Cost cd | Delivery Setup Cost cr | Total Cost |
|---|---|---|---|---|---|---|
| 0 | 0 | 0 | 0 | 0 | 0 | 0.000 |
| 0.1 | 5 | 10 | 5 | 2 | 1 | 153.740 |
| 0.2 | 6 | 15 | 7 | 4 | 2 | 293.576 |
| 0.3 | 8 | 18 | 8 | 7 | 3 | 488.872 |
| 0.4 | 12 | 22 | 10 | 8 | 4 | 635.200 |
| 0.5 | 13 | 24 | 14 | 9 | 5 | 797.040 |
| 0.6 | 15 | 28 | 16 | 11 | 5 | 1003.37 |
| 0.7 | 20 | 29 | 17 | 14 | 6 | 1289.48 |
| 0.8 | 21 | 33 | 20 | 15 | 6 | 1490.20 |
| 0.9 | 22 | 35 | 23 | 17 | 7 | 1781.17 |
| 1 | 25 | 38 | 24 | 18 | 8 | 2007.44 |
Increasing Speculation, Local α and Foreign β Search Rate with Increasing hw, hr, cm, cd, and cr.
| α & β | Holding Cost hw | Holding Cost hr | Unit Lost Sale cm | Production Setup Cost cd | Delivery Setup Costcr | Total Cost |
|---|---|---|---|---|---|---|
| 0 | 0 | 0 | 0 | 0 | 0 | 0.000 |
| 0.1 | 5 | 10 | 5 | 2 | 1 | 15.374 |
| 0.2 | 6 | 15 | 7 | 4 | 2 | 33.783 |
| 0.3 | 8 | 18 | 8 | 7 | 3 | 67.756 |
| 0.4 | 12 | 22 | 10 | 8 | 4 | 108.410 |
| 0.5 | 13 | 24 | 14 | 9 | 5 | 173.288 |
| 0.6 | 15 | 28 | 16 | 11 | 5 | 266.202 |
| 0.7 | 20 | 29 | 17 | 14 | 6 | 400.302 |
| 0.8 | 21 | 33 | 20 | 15 | 6 | 553.789 |
| 0.9 | 22 | 35 | 23 | 17 | 7 | 772.031 |
| 1 | 25 | 38 | 24 | 18 | 8 | 981.368 |