


This paper proposes a combinatorial evaluation method for the effectiveness of supplies assessed on the basis of optimal route connections between warehouses and receivers (customers) with usage of rough sets theory in multidimensional approach. Effectiveness is evaluated as the difference between the value of orders and their implementation costs resulting from transportation. The uncertainty concerns the assortment and the level of orders. Among various order alternatives using the proposed methodology one can observe the most and least effective configuration. One can use it to support trade policy, create service areas adapting them to the location structure of supply, and receive nodes.
Transportation problem in a deterministic version is, on the one hand, widely described [1,2,3], on the other hand, however, issues connected with full optimization are still not solved [4,5,11]. Therefore, our proposal regards the return to combinatorial methods based on permutation (variation). Processing time, even if it includes several minutes, is not an important indicator, because while planning a strategy or policy we operate off-line [6,9]. The combinatorial solution combines a classical transportation task, traveling salesman problem, Hamilton cycles, etc. A form of a final diagram allows us to select solutions with extreme values of effectiveness. This will permit us to create positive and negative areas of approximation for different structures of orders and to develop heuristics for the policy and strategy of orders and inventory, and even the location of warehouses. The opportunity to study the distribution of orders, stocks and warehouse locations, suggests the possibility of using rough sets theory in the multidimensional approach [17,12,15]. This also results in the possibility of building a reasoning mechanism [8,17,10,12]. The most convenient research organization relies on a successive increase of individual orders. For each product, we obtain the areas of approximation; next we can gradually increase the range of orders. The multidimensional inference is rather difficult and requires great discipline in the organization of the research. Hence, we observe the need for systematic and progressive changes in parameters [16]. The permutation approach should not discourage us, since as the final result, we obtain optimally organized transport route with loadings and deliveries. The main motivation of our investigation consists in searching for the guarantee of an optimal solution. The complexity of the research itself is connected with a strategy for choosing the set of data, and relating them to the real situation in a particular provider company (or a corresponding department) [7,13]. The proposed approach is the combination of a number of logistical problems, so that brings us closer to reality.
2The permutation method for testing the route of supplies from warehouses to receiversSequences of procedures in the method implementation are as follows:
- 1.
An introduction of data: customer orders, storage resources, distances from the warehouses, distances between warehouses and receivers, distances between warehouses, distances between the receivers, the priorities of receivers.
- 2.
Generating the permutation element (receiver or warehouse).
- 3.
Checking if loaded commodities (products) are sufficient for orders of the generated element, if it is the receiver, and unhandled receivers with a higher priority. If so, then unloading at the receiver and erasing from the waiting list should be performed. If not, return to step 2. If this is the warehouse then the loading is to be supplemented.
- 4.
Saving the code of the generated element in the sequence of the supplier route and checking whether all orders were delivered. If not, return to step 2.
- 5.
Correction of the shortest (the cheapest) line to provide orders.
- 6.
Presentation of the shortest (the cheapest) route, loading and unloading with respect to warehouses and receivers.
The procedures presented in the above points are complex and require the use of multi-dimensional structures of intermediate results. In order to describe them, specified designations should be made: S (i; j) - the resources of the i-th commodity in the j-th warehouse, P(i; k) - the quantity of the i-th commodity order by the k-th receiver, D(a; b) - the distance between elements (stores or receivers) a and b, CM(j) - the codes of warehouses, CR(k) - the codes of receivers, PR(k) - the priorities of receivers, V R(k) - the element of an order realization vector 1; 0 for the k-th receiver, V C(i) - the element of a load vector 1; 0 of the i-th commodity, ST(i; j) - the size of a delivery vehicle load by the i-th commodity in the j-th warehouse, SM(i; j) - the supplies of the i-th commodity in the j-th warehouse, DT(t) - the actual length of the route t, FT(t) - the final length of the route t, NT(r; t) - the r-th node (element: warehouse or recipient) of the route t, MDT - the length of the shortest (the cheapest) route of all deliveries, CMT - the number of the MDT route.
The strategy of the algorithm implementation consists of applying the verification rules of the current situation connected with the transfer of the delivery vehicle. Among the various selected elements we have to make a decision characteristic for the type of the next node of the route. And so if that is the recipient, who ordered a supply larger or equal to the capacity of the delivery vehicle, the heuristic hint will be to deliver products and refer to the warehouse to get further loading for the next delivery (fig.1a).
 The heuristics imposing complete loading and unloading at each time, b) the heuristics imposing the collection of the sum of supplies and their further realization, c)mixed heuristics that are further, consecutive loadings and deliveries and loadings and interspersed deliveries, where M-warehouse, R-receiver.")
a) The heuristics imposing complete loading and unloading at each time, b) the heuristics imposing the collection of the sum of supplies and their further realization, c)mixed heuristics that are further, consecutive loadings and deliveries and loadings and interspersed deliveries, where M-warehouse, R-receiver.
When supplies are small and portions of the load are incomplete we use the heuristics of collecting the commodities (goods) and recipient detour (fig.1b). Mostly, however, we use mixed heuristics (fig.1c). In this example, we make the loading in two consecutive warehouses, then the delivery to two recipients is conducted, and at the end further loading and delivery is performed. The permutation generator can be represented in the form of nested cycles, where each nesting excludes previous generations. That means we do not come back either to the warehouse, where we already were, or to the recipient, where ordered goods were delivered. This way we eliminate the part of the solutions that we consider to be ineffective. If the suspicion appears that the return to previously generated elements provides effective solutions, we can use the variation generator (with the possibility of repetitions of generated elements). Let us assume, however, that the number of permutations equals le!, and the number of variations equals lele. The concept of the method presented graphically is shown in fig.2. In the proposed methods, we are going to use only intermediate results. In order to evaluate them, we use the following parameters and formulas:
- a.
The aggregated order of the i-th commodity (product):SPi=∑k=1lriPi,k; where lr(i)- the number of clients ordering the i-th commodity.
- b.
Aggregated supplies of the i-th commodity:SSMi=∑j=1lmSMi,j; where lm- the number of warehouses.
- c.
The corrected aggregated order after ld deliveries of the i-th commodity:CSPi=SPi−∑r=1ldPi,kr
- d.
The loading of the i-th commodity after lu loadings:STi=minSSMi−CSPi−∑S=1luSTi,js, Where SC(i)
- acceptable loading capacity determined for the i-th commodity,while:STi=minSSMi−CSPi−∑S=1luSTi,js>0.
- e.
The current length of the route t after lt parts:DTt=∑r=1lttDar,br
- f.
The correction of the state of the i-th commodity in the j-th warehouse after loading:CSMi,j=SMi,j−STi

The procedure of permutation or variation generating can be represented as in fig.3. There we have lm + lr mutual nested loops. On each level of nesting, elements from the previous level are excluded [11]. Additionally, an analysis connected with loading and delivering corrections is realized.
 of the delivery route.")
During the route creation, nodes for which no loading or delivery operations were carried out are not participating. These nodes are treated as if they had never been visited by the supplier. As a result of the method implementation, some warehouses may be completely disregarded, as already equipped with all the commodities.
The problem of approaching all receivers with a full load can also be seen in terms of its costs, for example, by adding a factor (1 - (1 - u) * d), where u - the loading degree, d- the factor of transport costs reduction resulting from the underloading of the delivery vehicle.
3The presentation and evaluation of results concerning the shortest (cheapest) route of supply in terms of uncertain data regarding ordersBy following this study we obtain different configurations of supply routes at the permanent location of warehouses and receivers, changes in the size of supplies and assortment orders and customer priorities. The results can be presented as diagrams, where an axis of arguments is a sequence of steps, and an axis of a function is a code of the route node. A comparison of routes for different orders is shown in fig.4 (in variant 2, orders are approximately 10 percent larger and the order assortment increased from 4 to 5). The change in the route organization is the result of the change in the size of deliveries. Each unchanged route organization remains the distance between nodes and the possibility of the delivery vehicle loading, although in future studies it can be regulated. In order to systematize information we can state that the analysis may be changed, for example, with respect to the size of one product order, leaving other orders at a stable level.
 routes for different orders - example.")
Unitary transportation costs can be evaluated by converting them into pieces or by currency units of the commodity (product) value:

or

where c(i; j; k) - the cost of transferring a single piece of the commodity i between nodes j; k, cost(j; k) - the cost of the transit between nodes j; k, n(i)- the maximal possible number of pieces of the delivered commodity i, cc(i; j; k) - the cost of the currency unit transportation of the value of the commodity i between nodes j; k, ve(i) -the value of the commodity unit i.
Financial effectiveness of the transportation can be evaluated at the time of delivery in the node r that is accomplished during the route t:

where:
n’ - the corrected assortment of commodities which may be larger than the basic assortment when the loading of one type of commodities is accomplished in several warehouses, part(i; j; k)-the confirmation of the commodity i transportation at the distance j; k, takes values 0; 1.
The effectiveness of the entire delivery to all receivers is defined in the following way:
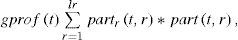
where partr(t; r) - the delivery confirmation in the node r on the route t : {0; 1}. The real costs of the transportation along the route t can be evaluated primarily by its length. Secondly, we consider the degree of loading the vehicle on each of the route sections. The real cost of the transportation can be estimated as follows:

where:
fl - the individual (for the unit distance) costs of fuel consumption at full load of the delivery vehicle, ur - the degree of the delivery vehicle loading on the r-th section of the road.
Ultimately, the effectiveness of supplies connected with route t with defined loadings and deliveries (u) is defined as follows:

where:
u - the vector of loadings. For comparative data we have to separate single orders related to specific products and receivers P(i, k). The change of the size of the single order will change the effectiveness of the transportation. It can also change the transport organization which additionally affects the effectiveness. Ultimately, an important dependence that can be observed is the dependence of the effectiveness resulting from the size of the order ef ~ P(i, k). In general, we can say that the order increase should, in the rational case, lead to increased effectiveness of our operations. However, the necessity of visiting an additional warehouse can increase costs and reduce effectiveness. Apart from the impact of the size of a load (mostly because, the coefficient d has relatively very low value), we can illustrate configurations of the general effectiveness dependencies on the size and order assortment. The effectiveness coefficient can be presented in a standardized form, for instance in relation to the maximal amount of supplies undertaken by the shortest route with a minimal number of loadings:

For optimal routes the maximal value of the effectiveness coefficient usually corresponds to maximal orders. The necessity for intermediate loadings, which may result from the limited capacity and the unbalanced distribution of products assortment, leads to the reduction in the effectiveness level. The research methodology can therefore be presented as follows:
- 1.
The preparation of the real data concerning: orders, the location of warehouses, receivers and parameters of the transport fleet.
- 2.
The use of permutation algorithm for finding optimal routes of supplies real sets.
- 3.
The construction of positive and negative areas of supplies according to the coefficient of efficiency.
- 4.
The prognostic analysis of supplies located in the positive approximation area.
- 5.
The preparation of structured sets of data changes for individual orders or assortment incrementing.
- 6.
The use of permutation algorithm for results detailing used in the comparative analysis.
- 7.
The creation of a reasoning mechanism concerning strategies and policies of orders, changes in stock size or even warehouse location based on detailed schedules of delivery realization.
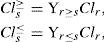
A date table with the information about the preference can be presented as a 4-touple DD(U; Q; V; f) which contains U = {t1, t2,…,t10}; that means the set of optimal supply routes is treated as decisions components, Q = C ∪ D, where C is the set of restrictions criteria, D - is the set of decision criteria, and f : T×Q → V representing function f(x; q) ∈Vq for q ∈ P, regarding the preference and represented by the function of the supply effectiveness. The dominance - based rough approximations is used to induce entities assigned to upward union classes Cl≥ or downward union classes Cl≤, where Cl is the set of the group of data containing ordered classes Clr, r ∈ R,R = {1, 2,..., lo}. For every pair r, s ∈ R and r ≥ s, each element from Clr is preferred at least as each element from Cls, which is defined:
P - dominating and P - dominated sets are the rough approximations of route t with respect to P, P⊆C..
P - the dominating set :Dp+t=y∈T,yDpt,
P - the dominated set:

Where y≻~qtforD+pt,t≻~qyforD−pt,q∈P.
The description of decision classes is defined as follows:

Where
tprof_min = {tprog, min (ef (tprog, u))} - the optimal route for the prognostic modification of the efficiency growth, U⊆C.

where tprog_max = {tprog, max (ef(tprog; u))} is the optimal route for the prognostic modification of the efficiency loss, u ∈ C,

Where
BnpCls≥ and BnpCls〈 are P- areas of an uncertain characteristic, belonging to the classes. The supply effectiveness ef(t; u) (or ef(t; *) is associated with each optimal route t (without regard of loading impact). For the presentation of the classification strategy, which exploits the dominance-based rough set approach (DRSA [14]), we can use diagrams in polar coordinates.
An angle αi will represent supply effectiveness and a radius will correspond to the route length ri. Researched routes give us the base for the creation of the class union. The set of the criteria on membership to the class Cls≥ or Cls〈 concerns the equivalence of deliveries of the i-th commodity to the k-th recipient. The criteria table I×K = W has its corresponding coefficient in the form of the criteria norm:
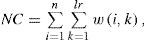
where:
n- the commodity assortment, lr - the number of potential recipients, w(i; k) ∈ 0; 1 - the coefficient of the compatibility of the delivery, whether the order takes place or not, this means we are checking the condition w(i; k) ={ut (i; k) = us (i; k)}; w(i; k) = 1 when the nature of delivery of the i-th commodity to the k-th recipient is corresponding to the route plan s : us(i; k), and 0 otherwise. The membership criterion is accomplished when the condition CO = NC = n *lr = 1 is fulfilled.
5SummaryThe permutation (or variation) method of searching for the optimal route with loading and supplies receiving is characterized by a great complexity, but for typical transport conditions (a few warehouses and a few customers) simulations do not take longer than 10 minutes. Its advantage is the optimal solution and the possibility of including a wide range of real constraints. It also provides a number of intermediate data and allows us to sort and track the transport process up to date. The research methodology can be divided into two stages: the stage of recognition and the stage of particularization based on systematized forecasting procedures. The future direction of investigation will be concentrated on the simplification of the algorithm complexity by, for example, elaboration of additional heuristics or preference advises, without losing the feature of optimal results [11, 12].