


In this paper we report optical damage as a bulk glass recording process. We used a 10Hz, 35picoseconds, 5mJ polarized Nd:YAG pulse laser focused using a 25mm lens to create 50μm average optical damage spots to record a computer generated hologram embedded in stress free BK-7 glass. It was observed that for the recording conditions the material surrounding the damage spot was induced birefringence altered producing a 70μm pixel optimal separation.
Using high intensity laser pulses for locally confined permanent modifications inside transparent materials, like changes in the refractive index, are possible by nonlinear absorption mechanisms. If the energy falling into the material is sufficient, plasma formation sets in and material damage can occur (Loeschner et al., 2008; Wood, 1986). Laser optical damage refers to material processing by laser ablation on a material. In some cases it can be controlled to produce artwork or optical devices. Femtosecond laser processing has recently been used to produce material micromaching (Zoubir, Shah, Richardson, & Richardson, 2001), drilling (An, Li, Dou, Yang, & Gong, 2005), or diffraction gratings recording (Park, Cho, Kim, & Kang, 2011). Laser optical damage is produced by controlling the operational parameters, such as beam intensity, spatial and temporal pulse shape, wavelength, as well as the material characteristics. Depending on the material properties we can have either energy dependence for absorbent materials or peak energy dependence for transparent materials. In any case the ablation produces a local refractive index change and depending on the pulse duration we can observe shock wave effects depending on the mechanical properties of the material.
On a customarily uncorrelated field, holography involves the recording and reconstruction of waves (Goodman, 1996, chap. 9). The coded record of a wave is called a hologram. In optical holography, a wave front diffracted by the object propagates to the hologram plane, where it interferes with a reference beam. The resulting intensity pattern is recorded on photographic film or plate to form the hologram. To decode the information from the hologram and reconstruct the object wave, the reference wave is again used to illuminate the hologram. Computer generated holograms (CGH) provide a more flexible process (Juárez-Pérez, Olivares-Pérez, & Berriel-Valdos, 1997). A computer digital hologram (CGH) is the numerical representation of the interference pattern observed in a hologram obtained by the superposition of a reference beam and an object beam. On CGH a physical object is not needed, it is sufficient to have a mathematical description of the object. Customary the fabrication CGHs is performed by an enlarged sample of a plotted computed hologram followed by a photographic reduction with the desired final size. Supported by modern computational tools, it is a mature area and has displaced up to some extend the traditional holographic film recording procedure.
Combining both optical induced laser damage and CGH is possible to conceive optical damage as a recording mechanism. Similar recording methods are found on the literature (Fauzi, Kim, Kim, Jun, & Lee, 2012; Li, Dou, An, Yang, & Gong, 2005; Waedegaard & Balling, 2010; Waedegaard & Balling, 2011; Zhao et al., 2005). For instance, on Fauzi et al. (2012) the recording is done in the glass bulk using Lohmman CGH code (Brown & Lohmann, 1966) in which each pixel is composed by an array of dots and the codification is done by the number of points recorded (amplitude) and position (phase). An advanced CGH code is found on Waedegaard and Balling (2011) but the recording is performed only on the surface.
In this paper we use optical damage using long laser pulses as a recording mechanism for writing an advanced CGH generation code inside bulk glass.
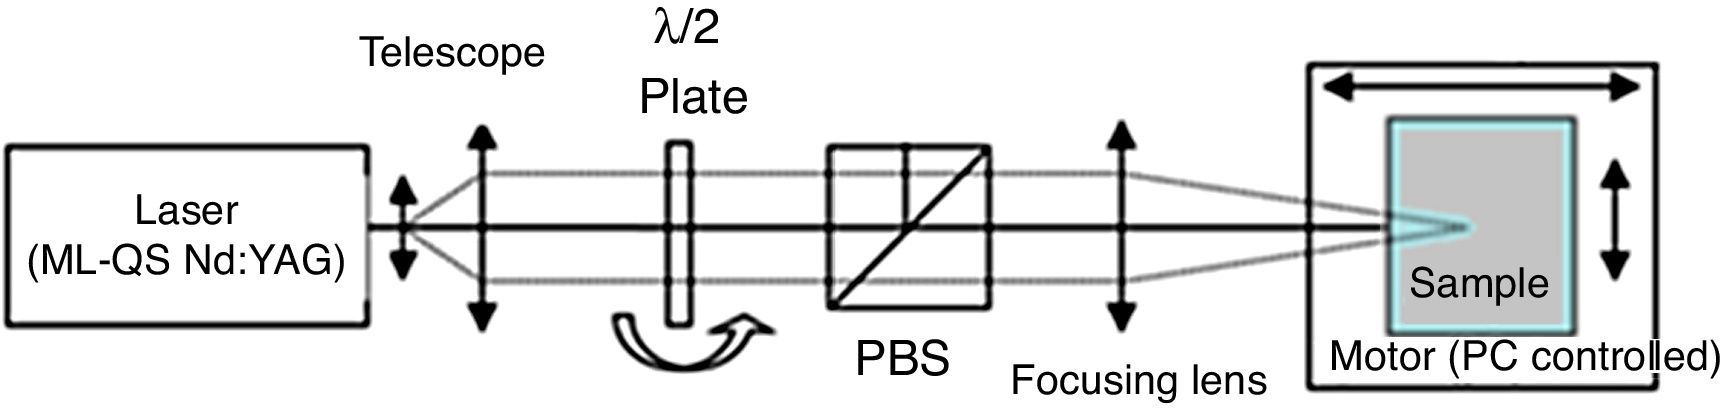
2Optical damage experimental setupIn order to investigate optical damage in glass we used the setup shown in Figure 1. A Quantel 416 mode-locked-Q-switch Nd:YAG vertically polarized laser operating at 10Hz producing 35picosecond pulses delivering up to 35mJ at 1064nm is used to produce a small spot within the material. We used different lenses placed after a telescope to focus inside a solid 2×2×2cm3 cube of BK7 stress free optical glass. The intensity was controlled by a variable attenuator made by a quartz polarizing beam splitter (PBS) and a half wavelength retardation plate. The sample was moved by a computer controlled XYZ stage with controlled 200nm resolution step motors (Newport ESP300).

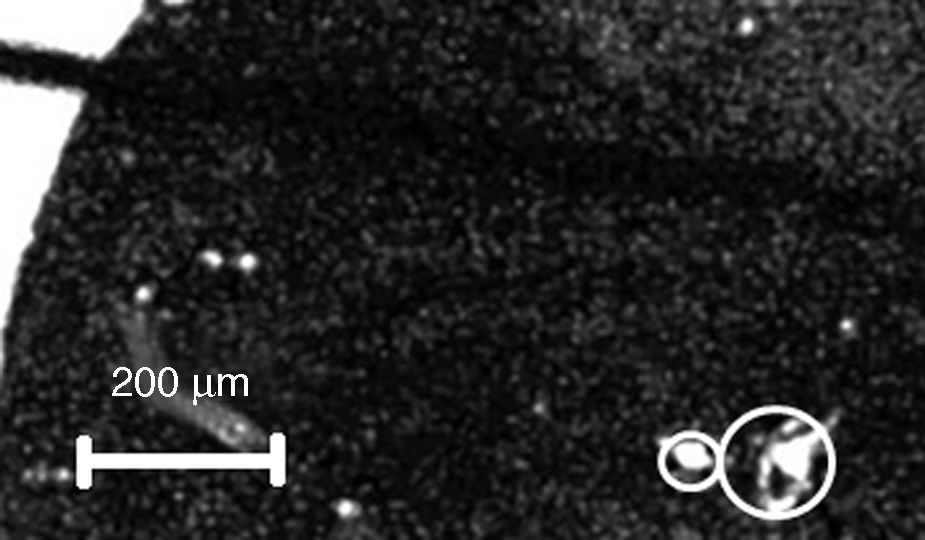
We observe catastrophic optical damage using pulse energies larger than 3mJ per pulse using a 25mm focal length focusing lens, in accordance with similar observations (Loeschner et al., 2008). Because of shot-to-shot fluctuation, the large energy per pulse and the relatively large pulse duration, the shot-to-shot damage was not uniform. We observed these fluctuations for individual damage spots with differences in shape and size under the microscope (Fig. 2).
 and 80±10μm (right point). Notice the non-uniformity in the spots shape.")
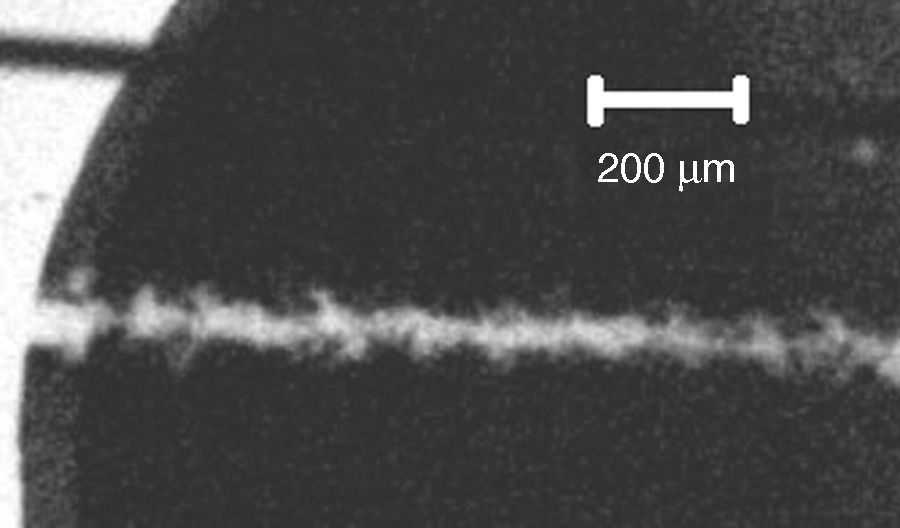
In most of the cases the damage was not localized and produced long strips in the material. Using long focal length lenses (f=250mm) we were able to produce lines as long as 3mm due to a combination of ablation and temperature distribution (Fig. 3).
. Notice the fluctuations in width along the line.")
After the single spot average size was obtained, which was actually a line-hole in the material, a series of lines were recorded on the glass by laterally displacing the glass with respect to the beam direction. With the characterization in size and shape of the damage we decided to keep a 10cm focal length lens which produce a 50μm spot (on average) observed under a microscope. Keeping the glass for 5–10 shots we observed a line depth between 1 and 5mm.
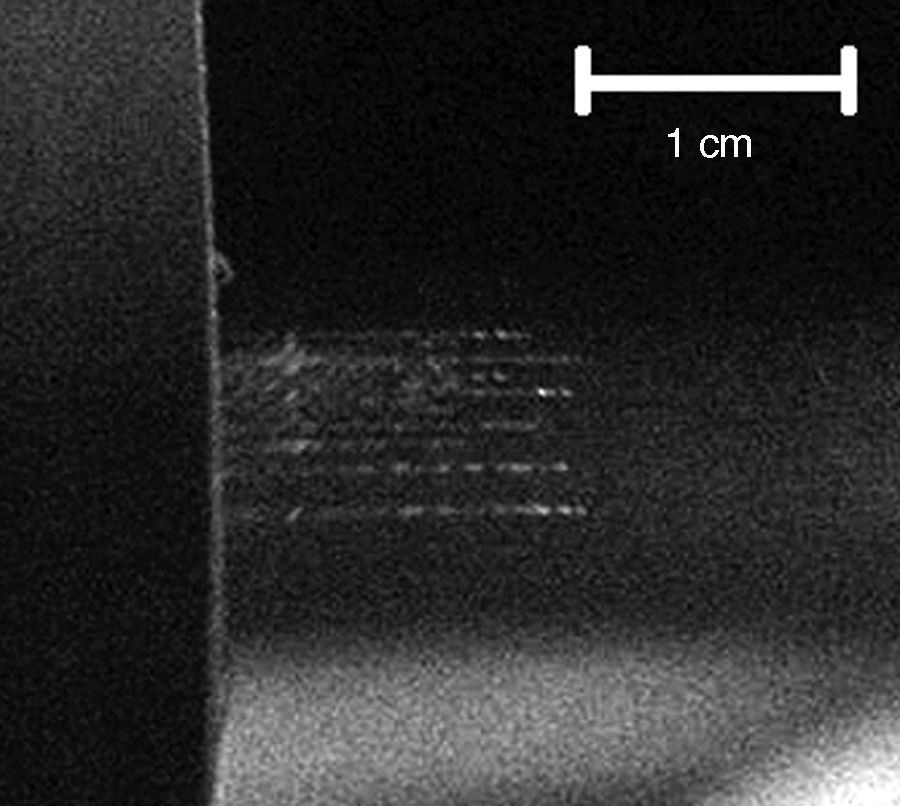
With the single damage points characterized, using a mechanical shutter to select the number of shots we recorded between 10 and 20 lines. Between each line we laterally displaced the glass cube by a given distance. For example in Figure 4 we observe a series of 11 lines separated by 100μm.

The resulting damage recorded is a series of regular lines which irregularities both in length and width. These lines were illuminated using a He-Ne laser and observed in a screen 2m away. The obtained result is a diffraction pattern produced by the damaged induced lines which behaved as a diffraction transmission grating. Additional scattered light filled the screen produced by the recording nonuniformity in line size and shape of the lines. Calculating the separation of the diffracted spots we obtained that it corresponded with the recorded lines separation. The effective diffraction efficiency was not possible to determine because the excess scattered light. Although we observed up to 15 diffraction orders on each side of the central spot for lines separated by more than 80μm (Fig. 5).
 in a BK7 glass separated 100μm. We can observe up to 9 diffraction orders on each side of the central lobe")
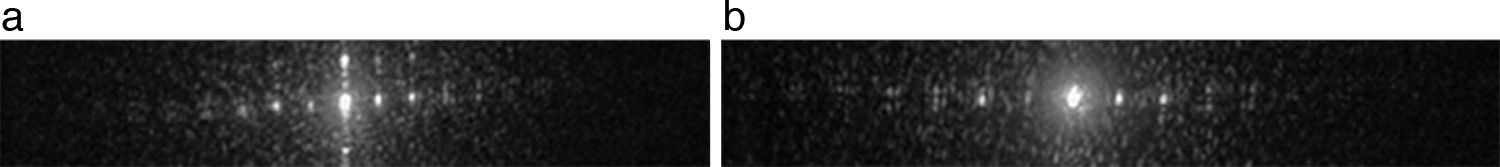
If the separation between the lines was less than 80μm the number of diffracted orders diminish, and the amount of scattered light increased. In Figure 6, we observe the diffraction pattern of lines separated 80μm and 70μm. For separations below this we were unable to detect diffracted light in the shape of a defined spot and only observed scatted light.
 in a BK7 glass. The lines were separated (a) 80μm and 7 diffraction orders were observed on each side of the central lobe, and (b) 70μm and 4 diffraction orders were observed on each side of the central lobe.")
Diffraction pattern produced by a diffraction grating (11 optical damage lines) in a BK7 glass. The lines were separated (a) 80μm and 7 diffraction orders were observed on each side of the central lobe, and (b) 70μm and 4 diffraction orders were observed on each side of the central lobe.
Considering that the average spot has 50μm in diameter we expected that the diffraction grating response of the lines disappeared close to a 50μm separation, not at 70μm.
These experiments had the purpose of determining the minimum separation needed to observe diffraction. The reason for the optimum 70μm optical damage point separation will be clarified in Section 4.
3Computer generated hologram recordingFor the process of recording and reconstruction of a hologram we calculate the numerical intensity distribution using the equations that represent the physical process of interference and diffraction in a hologram (Juárez-Pérez et al., 1997). The result is a matrix with the correspondent numerical values with the amplitude and phase information. It can be reproduced in a monitor, liquid crystal display or a plotter. We must take into account the differences among the different displays in the modern CGH calculation algorithms to produce an optimized code (Juárez-Pérez et al., 1997). After the CGH has been fabricated we reconstruct the hologram in an optical system with coherent illumination.
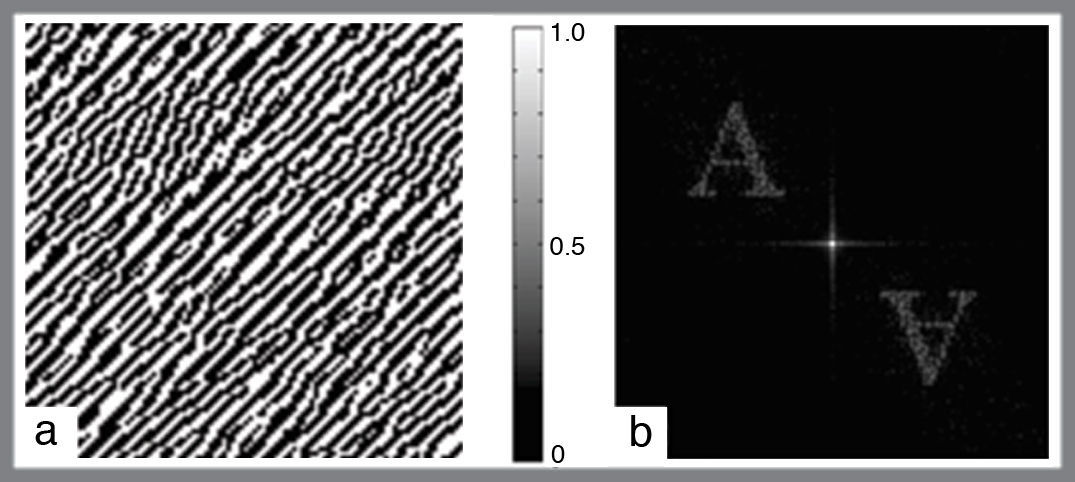
The CGH is based on an amplitude binary hologram h(x,y) (Brown & Lohmann, 1966) which codifies a specified intensity pattern I(x,y) which are related by Fourier transformation (Born & Wolf, 1980). This type of hologram exhibits on the Fourier plane three diffraction orders: a DC noise on the zero order, the orthoscopic intensity pattern (I(x,y)) and its pseudoscopic conjugated (I*(x,y)). Figure 7a shows h(x,y) the calculated CGH codification of the letter “A” produced on a 100×100 point array. The numerical diffraction pattern obtained by the Fourier transforming this distribution or CGH reconstruction is shown in Figure 7b.
4Results Binary amplitude hologram h(x, y) that codifies the letter “A” (b) CHG reconstruction by Fourier transform h(x, y).")
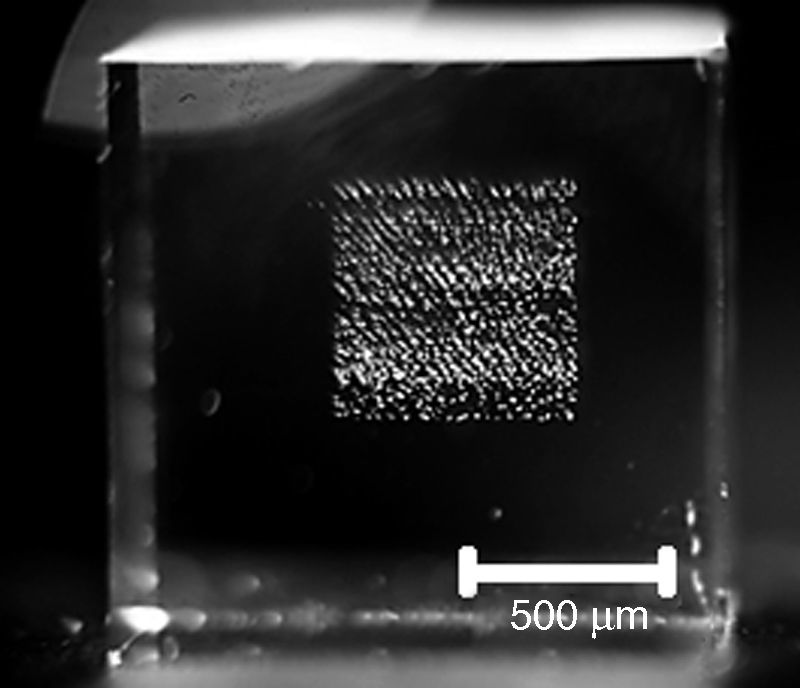
The CGH code calculated for the letter “A” was transferred on a 2×2×2cm3 BK7 stress free glass cube by catastrophic optical damage using 5mJ per pulse, 10Hz repetition rate and a 70μm separation between recording points, or pixels. The resulting recorded pattern is shown in Figure 8. We placed the BK7 glass cube in such a way that the recorded CGH was placed close to the middle of the cube. In the recording process we lost around 5% of the pixels due to laser fluctuations which were unable to produce the necessary conditions for damage. The recording lasted approximately 6h.

Each point produced a line with a depth between a few microns up to 2mm observed laterally. The average size of the spot is 50μm. Additional CGHs were recorded with 80μm and 60μm pixel separation.
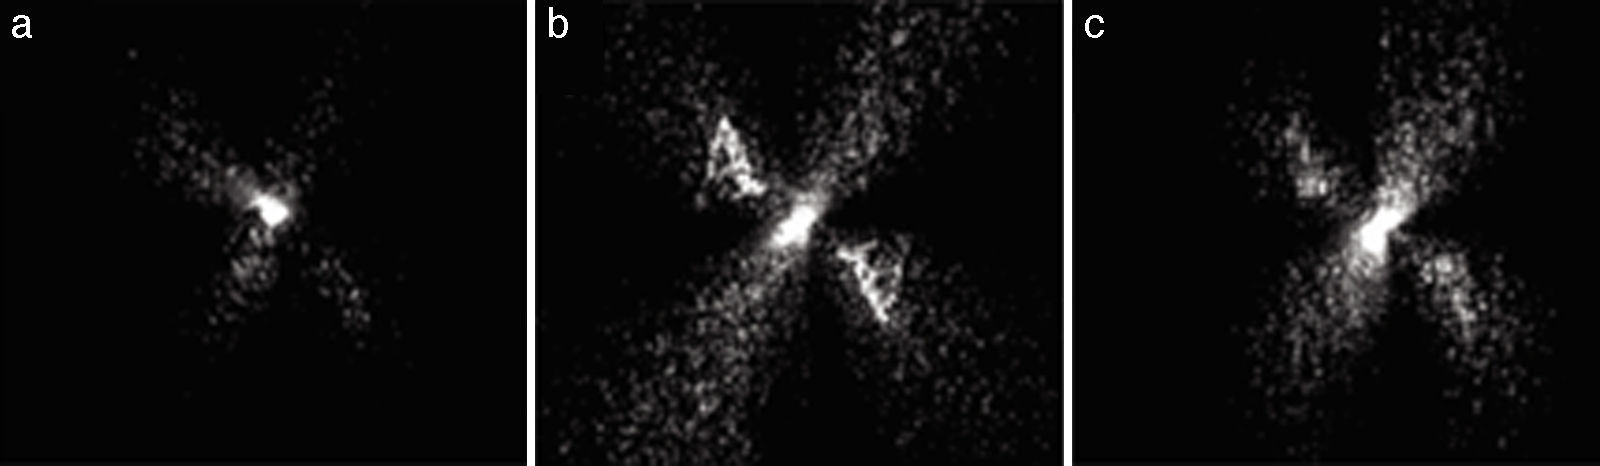
Reconstructed images for three CGHs (50μm, 60μm and 80μm), reconstructed using He-Ne laser illumination, are shown in Figure 9. The pictures were observed in the far field region over a white screen placed 2m away from the CGH and recorded using a Sony Mavica camera adjusting the sensitivity to avoid saturation. The 70μm separation CGH (Fig. 9b) presents a well-defined orthoscopic and pseudoscopic reconstruction of the letter “A” on the central lobe of the diffraction pattern; considering that the shape of shot-to-shot spot is highly irregular, that each pixel recorded a line rather than a localized spot and the loss of approximately 5% of the pixels, the reconstruction is reasonable. Whereas for the other two recorded CGHs (80μm and 60μm pixel separation) there is not a defined reconstruction (Fig. 9a and c, respectively). Undefined traces of the reconstruction were observed and the presence of a diffracted pattern from a square lattice was also observed. On these two cases we observe an array of spots well localized but without the expected hologram reconstruction.
 60μm, (b) 70μm, and (c) 80μm spot separation.")
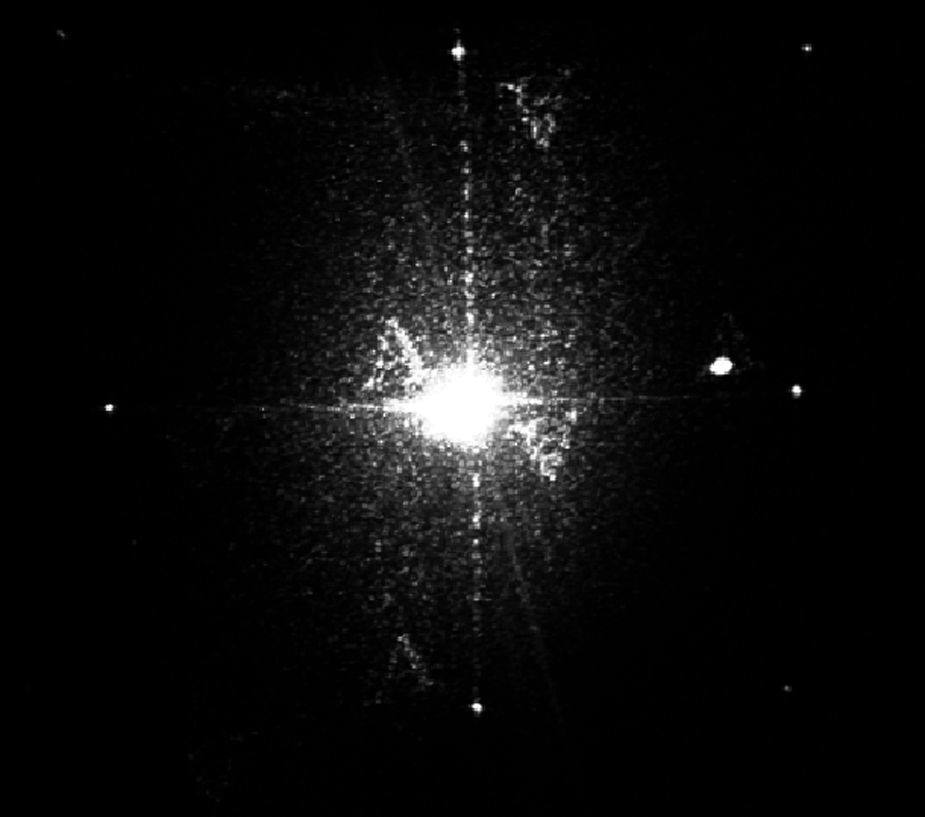
If we observe with more detail on an overexposed image of the successfully recorded case (80μm) we can see up to 9 diffracted orders arising from the squared discretization matrix with their correspondent orthoscopic and pseudoscopic images of the letter “A” at each diffracted center (Fig. 10).

Overexposed reconstruction of the optical damage CGH shown in Figure 9 with 70μm recording pixel separation.
Therefore we could experimentally determine that the 70μm recording separation for the CGH embedded in glass is the optimal recording distance. This is an apparent contradiction with the measured 50μm damage average size. The lack of reconstruction with different pixel separations other than the 70μm one required a further exploration of the recording process.
On one side, the larger and smaller pixel separation was explained by the requirements for CGHs. If the separation is smaller than the optimal separation, there is an overlap and subsequent loss of information due to the numerical nature of the process. For larger separations, there is an excess of information in which apparent new code appears. After a closer look, traces of the reconstruction were observed on this case in Figure 9a and c. Both observations are in accordance to the CGH theory. But the difference between the damage spot size and the adequate separation is not yet explained.
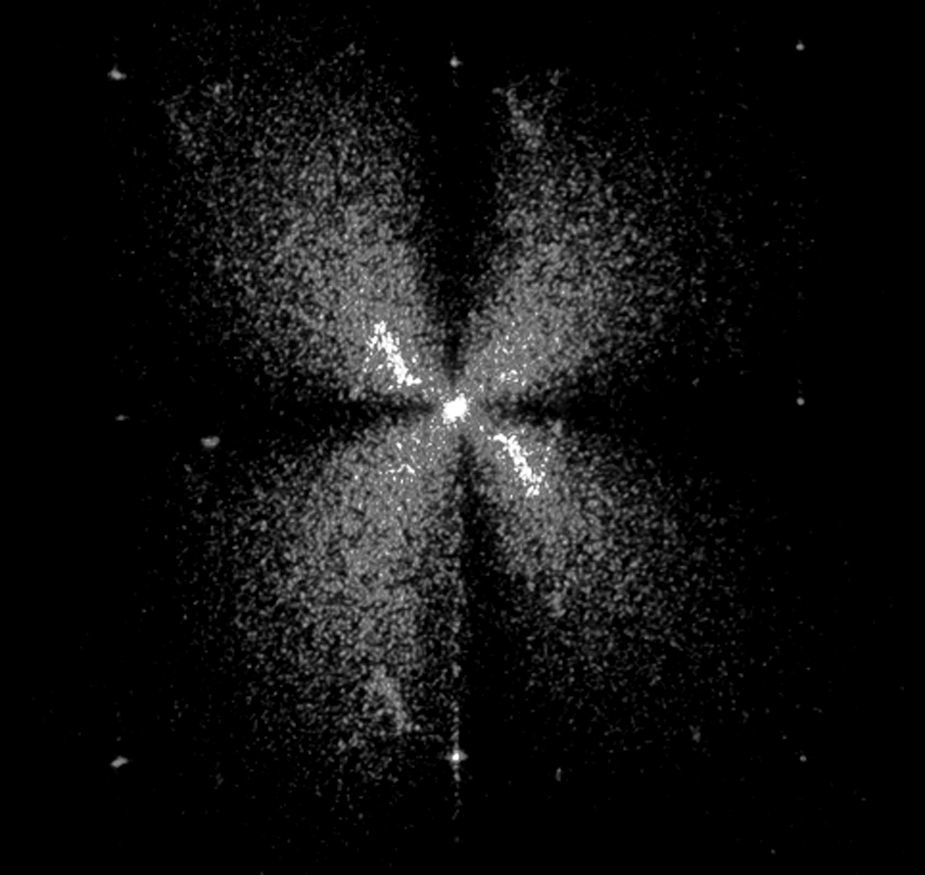
To explain the differences between the damage spot size and the optimal pixel separation we observe the reconstruction under crossed polarizers (Fig. 11) and obtained an isogyre pattern (Treviño-Palacios, Olivares-Pérez, & Zapata-Nava, 2007). The presence of a well-defined isogyre pattern provides us with the key information for the optimum pixel separation apparent disparity. Due to the mechanical shock after the ablation has taken placed using long polarized pulses for the recording process, there is an induced birefringence on the glass extending beyond the catastrophic optical damage (Loeschner et al., 2008). Therefore, under the recording parameters this additional birefringence was responsible of the additional 20μm needed separation, or a 40% increase in the pixel size from the optical damage alone.

For different recording parameters (beam intensity, spatial and temporal pulse shape, wavelength, as well as the material characteristics) the optical damage-induced birefringence pixel separation distance should be determined a priory before recording.
5DiscussionFollowing the previous experimental observations we determined that the CGH is not actually recorded by the induced optical catastrophic damage alone, but by the combination of optical damage and induced birefringence produced by the material laser processing (Loeschner et al., 2008). Final pixel size is thus determined by the extent of the induce birefringence. In Figure 11 we can observe that the central lobe intensity is much smaller than the one in Figure 10, which provides an insight about the importance of the induced birefringence in the recording/reconstruction process. Based on the robustness of the CHG code we previously proposed that this could be used as a transparent optical key (Treviño-Palacios et al., 2007).
6ConclusionIn this work we have shown that catastrophic optical damage can be used as a bulk CGH recording process. The recording mechanism is found to be a combination of optical damage and induced birefringence. The separation between pixels is the key parameter for an optimal reconstruction, which is larger than the damage spot due to induced birefringence. Based on to the robustness of the holographic code, the spot size fluctuation and the depth of the damage do not destroys the reconstruction process.
Conflict of interestThe authors have no conflicts of interest to declare.
The authors would like to dedicate this paper in memory of Prof Roberto Ortega-Martinez. One of the authors (C.G. Trevino-Palacios) started the study of the laser damage problem as part of his undergraduate thesis under Prof. Ortega-Martinez supervision.
Peer Review under the responsibility of Universidad Nacional Autónoma de México.