
In Spain over the last two decades, cesarean section (CS) rates have increased from 15 to 25% in the Public Health Sector and from 28 to 38% in the private sector. There are multiples causes for this rise, which are often unclear. The aim of our study is to collect and analyze all the CS rates data from a hospital network of the 42 Quirónsalud Hospitals (private sector) and to assess its distribution regarding the different types of hospitals and patient characteristics.
Material and methodsAn observational retrospective study between 2017 and 2018 was performed. Hospitals are classified into three groups: large hospitals (11), medium hospitals (17) and small hospitals (14). The cesarean section rate was measured by patient categorization into three groups: total deliveries, low risk cesarean sections and low risk cesarean sections without previous cesarean delivery.
ResultsWe analyzed 62,685 deliveries: 42,987 were vaginal deliveries (68.6%) and 19,698 CS (31.4%). The mean age for the total number of deliveries was 34.18 years old, whilst the mean age for the low-risk group was 34.12. Of the 19,698 CS, 18.36% (3618) were in high-risk population and 81.63% (16,080) in low risk population. 69.54% (11,183) of the low-risk CS were in patients without a previous CS.
ConclusionsThe overall rate of CS in the Quirónsalud group is slightly higher than the one from the Public Healthcare. The older maternal age as well as the hospital resources involved in the delivery attendance can explain this difference.
En España durante las últimas dos décadas, la tasa de cesáreas ha aumentado del 15 al 25% en el sector público de salud y del 28 al 38% en el sector privado. Hay múltiples causas de este aumento y a menudo no están claras. El objetivo de nuestro estudio es recoger y analizar todos los datos de tasas de cesáreas de los 42 Hospitales de Quirónsalud (sector privado) y evaluar su distribución respecto a los diferentes tipos de hospitales y características de los pacientes.
Material y métodosSe realizó un estudio retrospectivo entre 2017 y 2018. Los hospitales se clasifican en tres grupos: hospitales grandes (11), hospitales medianos (17) y hospitales pequeños (14). La tasa de cesáreas se midió mediante la categorización de las pacientes en tres grupos: partos totales, cesáreas de bajo riesgo y cesáreas de bajo riesgo sin cesárea previa.
ResultadosSe estudiaron 62.685 partos: 42.987 fueron partos vaginales (68,6%) y 19.698 fueron cesáreas (31,4%). La edad media del total de las pacientes fue de 34,18 años, mientras que la edad media del grupo de bajo riesgo fue de 34,12. De las 19.698 cesáreas, el 18,36% (3.618) correspondían a población de alto riesgo y el 81,63% (16.080) a población de bajo riesgo. El 69,54% (11.183) de las cesáreas de bajo riesgo fueron en pacientes sin cesárea previa.
ConclusionesLa tasa bruta de cesáreas en el grupo Quirónsalud es ligeramente superior a la de salud pública. La mayor edad materna así como los recursos hospitalarios involucrados en la atención del parto pueden explicar esta diferencia.
Cesarean section (CS) rates in Spain have progressively increased over the last years.1 WHO has historically stated the optimal CS rate around 10–15%.2 Additionally, Molina et al., estimated that a 19% of CS rate is associated to a lower maternal and fetal mortality rate.3 To establish an optimal CS rate is challenging because studies that compare populations only consider mortality data. In 2015, the WHO changed its statements and proposed that a CS should be performed to all women who need it, rather than attempting to achieve a certain rate.4 Subsequently, the Robson classification has been proposed. It compares stratified women according to their obstetrics conditions in order to avoid confusion factors and the variability of CS indication.5
CS increases maternal mortality from 1.6/100,000 to a 5.6/100,000, compared to vaginal delivery.6 In Spain, between 1997 and 2016, the cesarean section rates have increased from 15 to 25% in the Public Health Sector and from 28 to 38% in the private sector, the latter with historically higher rates. There are multiples causes for this rise, which are often unclear.
The total number of deliveries in Spain during 2017 was 386,133.7 8.4% (32,358) of them were attended in maternities of the Quirónsalud Grupo Hospitalario (QGH). The private sector attended 24% of deliveries during 2017.
The role of the private sector in Obstetrics in Spain is growing, with an increasing number of patients attending private doctors each year. Therefore, we consider crucial to analyze the causes of the increasing CS rate in the Spanish private medical care. To our knowledge, published literature about CS rate in the private sector in Europe is scarce.
The aim of our study is to collect and analyze all the CS rates data from our hospital group and to assess its distribution regarding the different types of Hospitals and patient characteristics.
Material and methodsAn observational retrospective study including 42 Quirónsalud Hospitals between 2017 and 2018 was performed. The clinical and demographic data was obtained from the Conjunto Mínimo Básico de Datos (CMBD), which collects every obstetric episode from each hospital.
Hospitals are classified into three groups: large hospitals (11), medium hospitals (17) and small hospitals (14). The hospital assignation into each group is established by a non-hierarchical cluster analysis, which consists in a multivariate technique that seeks to group elements or variables trying to achieve maximum homogeneity in each group and the biggest difference between them, using a hierarchical structure to decide which hierarchical level is most appropriate for the classification. The SPSS program offers three types of cluster analysis: hierarchical cluster analysis, two-stage and K-means. The hierarchical method is the most suitable to determine the optimal number of clusters existing in the data and the content of the same for our case study.
Variables of the studyIn this analysis, the following data are analyzed for each hospital: technological dotation, activity, structure (beds, operation theatres, intensive care unit), complexity of the cases measured by the mean APRGRD 35 (All Patient Diagnosis Related Group), service portfolio and billing.
Outcome measuresThe cesarean section rate was measured by patient categorization into three groups:
- •
Total deliveries
- •
Low risk cesarean sections (IQI 21)
- •
Low risk cesarean sections without previous cesarean delivery (IQI 33)
The total deliveries group included all pregnancies. High-risk pregnancies were excluded in the other two groups, because these high-risk pregnancies have a more elevated risk of CS and this could be a confounding factor in analyzing the reasons for a higher rate according to the different variables studied.8 The hospitalization quality indicators (IQIs), defined by the Agency for Healthcare Research and Quality (AHRQ), determined these two lower risk groups:
- •
IQI 21 (CS rates without complications): Percentage of cesarean section deliveries out of the total number of deliveries. Abnormal fetal position, preterm labor, multiple pregnancy, etc. were excluded.
- •
IQI 33 (CS rates without previous cesarean delivery and without complications): Percentage of cesarean deliveries without a previous cesarean section out of the total number of deliveries. Abnormal fetal position, preterm labor, multiple pregnancy, etc. were excluded.
The low risk CS indicator measured the adequacy of this intervention, excluding high risk factors of CS.
Statistical analysisThe statistical analysis was performed using IBM_SPSS_Statistics V18.0 software.
We used ANOVA test for mean comparison, and the Chi square test for proportion comparison. Likewise, a regression logistic model was performed to assess the odds ratio of cesarean section delivery.
Ethical considerationsThis study is exempt from ethical approval. All data was integrated into the QGH corporate database and it did not include any patient identification downloaded for analysis purposes.
ResultsWe included 62,685 deliveries attended at the Quirónsalud Group in 2017–218: 42,987 were vaginal deliveries (68.6%) and 19,698 CS (31.4%). 56.2% of all deliveries were performed at the large hospitals group.
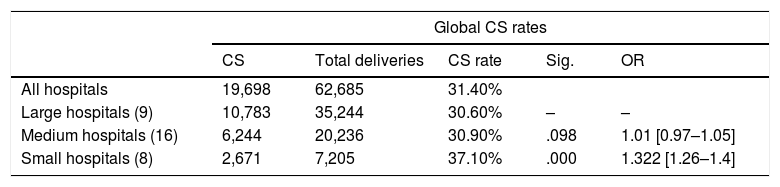
Of the 19,698 CS, 18.36% (3618) were in high-risk population and 81.63% (16,080) in low risk population, according to the IQI 21 indicator. 69.54% (11,183) of the low risk CS were in patients without a previous CS (IQI 33). Global rate of CS in low risk population was 28.4% (Table 1).
Global CS rates by type of hospital.
| Global CS rates | |||||
|---|---|---|---|---|---|
| CS | Total deliveries | CS rate | Sig. | OR | |
| All hospitals | 19,698 | 62,685 | 31.40% | ||
| Large hospitals (9) | 10,783 | 35,244 | 30.60% | – | – |
| Medium hospitals (16) | 6,244 | 20,236 | 30.90% | .098 | 1.01 [0.97–1.05] |
| Small hospitals (8) | 2,671 | 7,205 | 37.10% | .000 | 1.322 [1.26–1.4] |
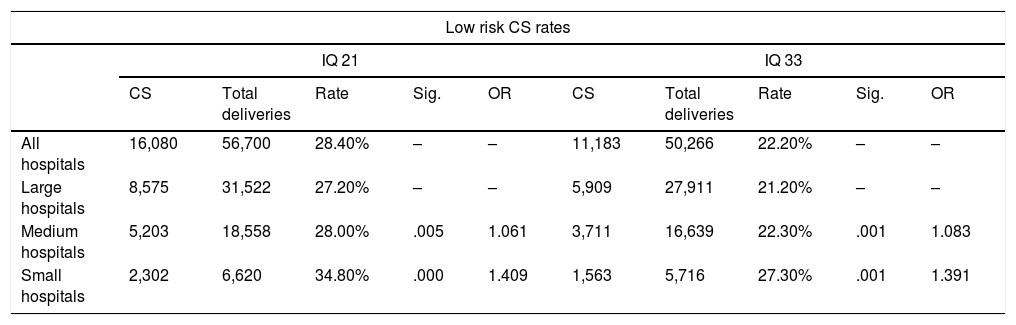
The relationship between the CS rates and the hospital types for each patient categorization (total, low risk and low risk with no previous cesarean delivery) were analyzed. All groups reported statistical differences in the cesarean delivery rates (chi square test p<0.05). The rates of CS were higher in the small hospitals compared to the other two groups (Tables 1 and 2).
Low risk CS and low risk first CS by type of hospital.
| Low risk CS rates | ||||||||||
|---|---|---|---|---|---|---|---|---|---|---|
| IQ 21 | IQ 33 | |||||||||
| CS | Total deliveries | Rate | Sig. | OR | CS | Total deliveries | Rate | Sig. | OR | |
| All hospitals | 16,080 | 56,700 | 28.40% | – | – | 11,183 | 50,266 | 22.20% | – | – |
| Large hospitals | 8,575 | 31,522 | 27.20% | – | – | 5,909 | 27,911 | 21.20% | – | – |
| Medium hospitals | 5,203 | 18,558 | 28.00% | .005 | 1.061 | 3,711 | 16,639 | 22.30% | .001 | 1.083 |
| Small hospitals | 2,302 | 6,620 | 34.80% | .000 | 1.409 | 1,563 | 5,716 | 27.30% | .001 | 1.391 |
IQ 21: low risk CS; IQ 33: low risk CS without previous cesarean delivery.
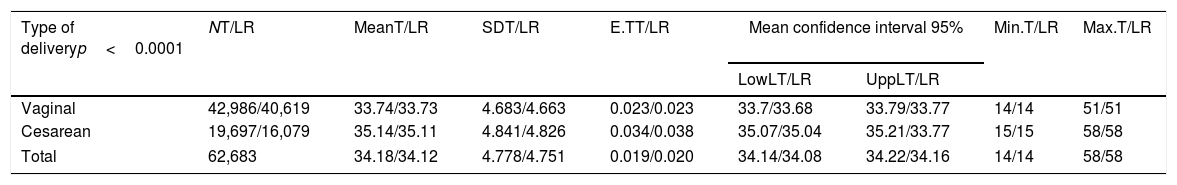
The mean age for the total number of deliveries was 34.18 years old (Table 3), whilst the mean age for the low risk group was 34.12, without differences in the range of ages (14–58 years).
Maternal age according to type of delivery in total (T) and low risk group (LR).
| Type of deliveryp<0.0001 | NT/LR | MeanT/LR | SDT/LR | E.TT/LR | Mean confidence interval 95% | Min.T/LR | Max.T/LR | |
|---|---|---|---|---|---|---|---|---|
| LowLT/LR | UppLT/LR | |||||||
| Vaginal | 42,986/40,619 | 33.74/33.73 | 4.683/4.663 | 0.023/0.023 | 33.7/33.68 | 33.79/33.77 | 14/14 | 51/51 |
| Cesarean | 19,697/16,079 | 35.14/35.11 | 4.841/4.826 | 0.034/0.038 | 35.07/35.04 | 35.21/33.77 | 15/15 | 58/58 |
| Total | 62,683 | 34.18/34.12 | 4.778/4.751 | 0.019/0.020 | 34.14/34.08 | 34.22/34.16 | 14/14 | 58/58 |
SD: standard deviation; E.T: standard error; LowL: lower limit; UppL: upper limit; Min: minimum; Max: maximum.
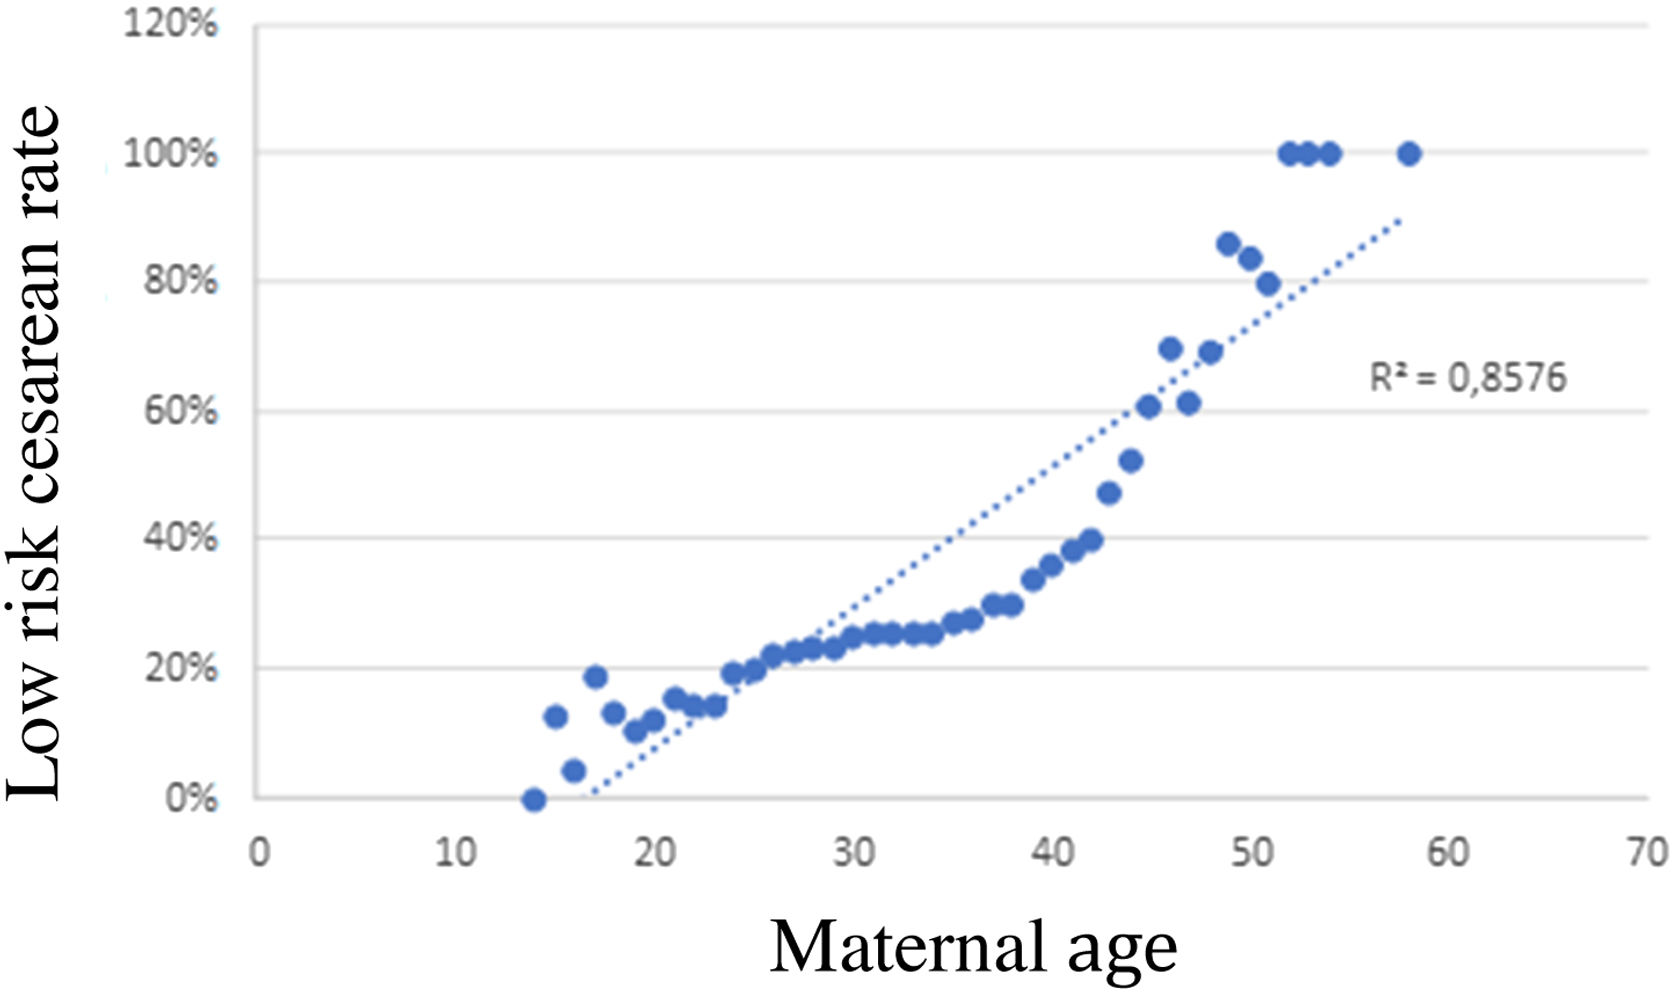
Maternal age and type of delivery showed statistically significant differences (p<0.05). In Fig. 1 we depict the correlation between maternal age and CS rate. The CS rate increases with maternal age, especially in patients older than 40 years old: patients older than 50 years old have a 100% CS rate, whilst CS rate decreases to 20% in patients younger than 25 years old. Logistic regression shows an association between maternal age and CS rate: OR: 1.065 (1.061–1.070), with statistically significant differences.
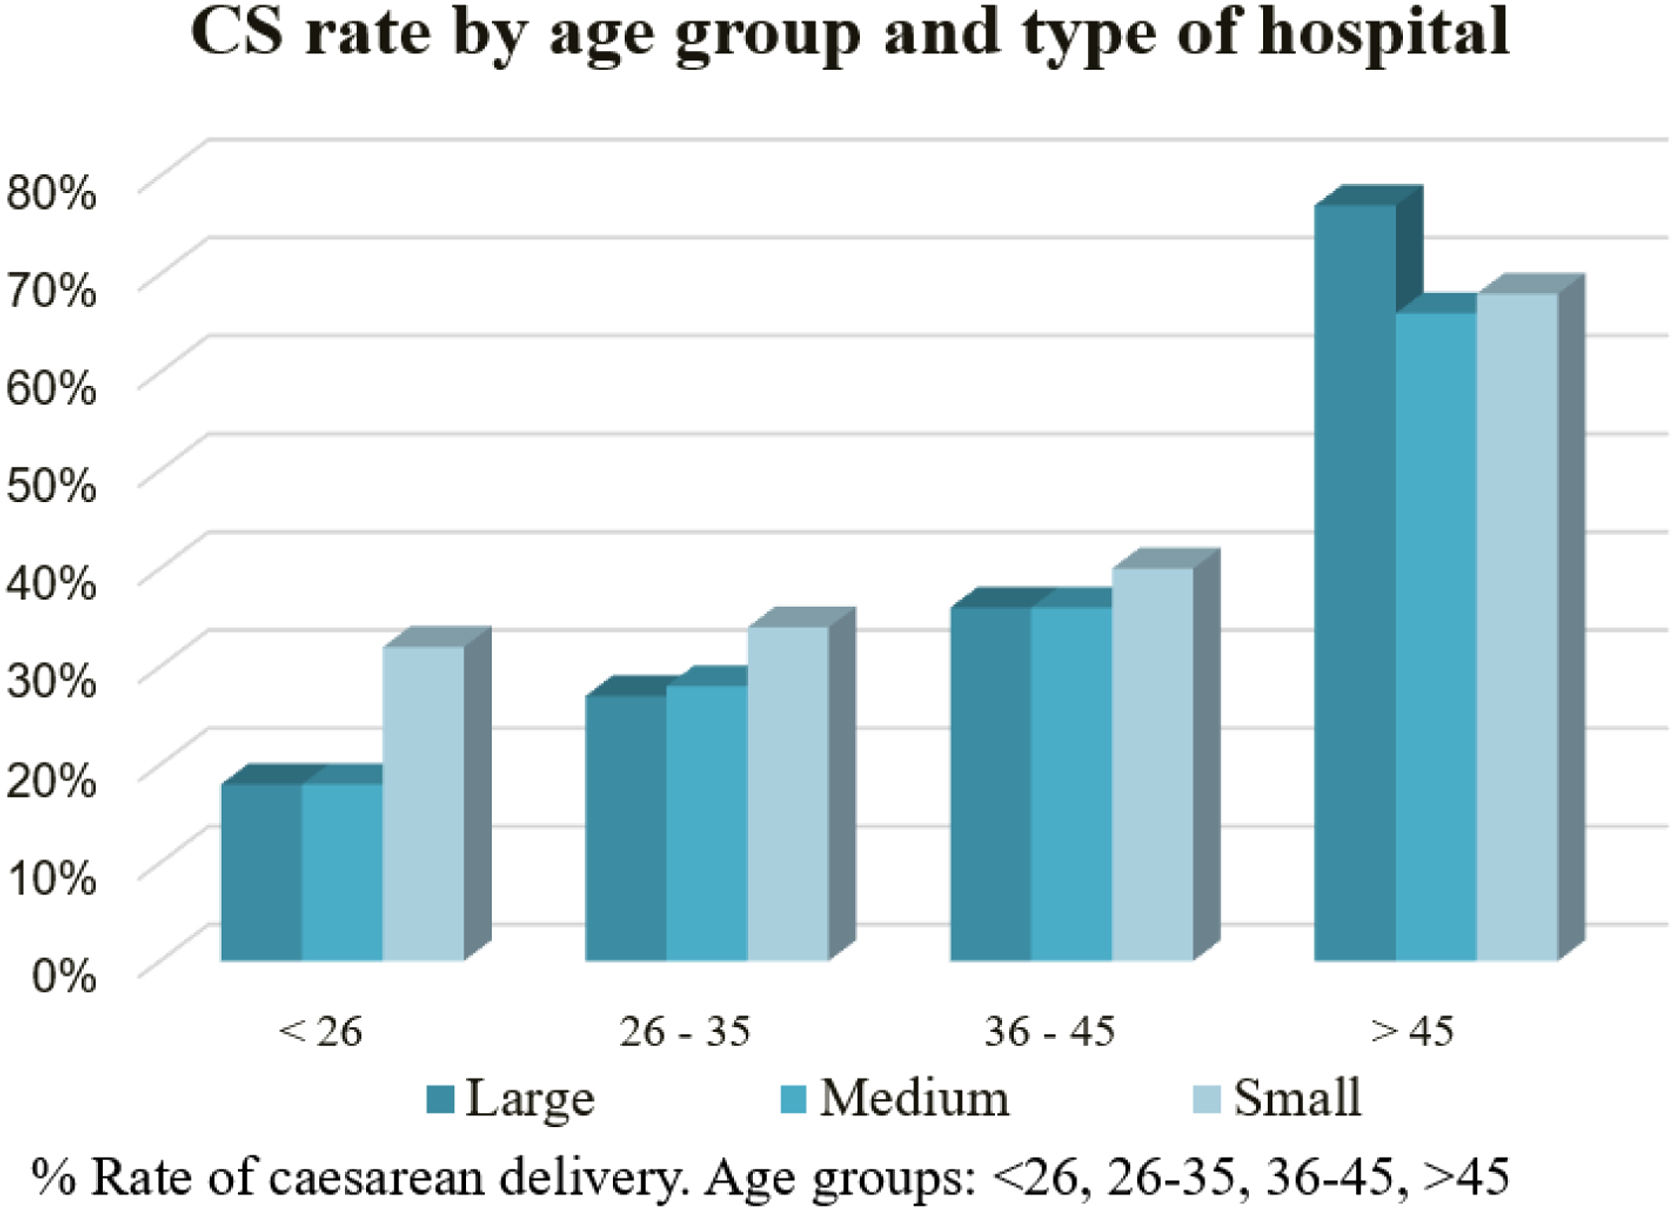
CS rate according to maternal age group and type of hospital
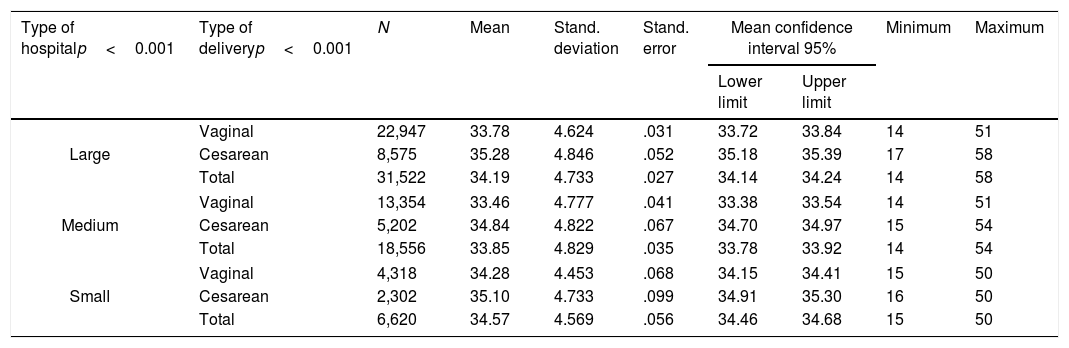
There is a similar age pattern between the different hospital types. Maternal age has a higher influence on the risk of CS than the type of hospital (Table 4).
Maternal age distribution by type of hospital and type of delivery and risk of CS according to type of hospital and mother's age.
| Type of hospitalp<0.001 | Type of deliveryp<0.001 | N | Mean | Stand. deviation | Stand. error | Mean confidence interval 95% | Minimum | Maximum | |
|---|---|---|---|---|---|---|---|---|---|
| Lower limit | Upper limit | ||||||||
| Large | Vaginal | 22,947 | 33.78 | 4.624 | .031 | 33.72 | 33.84 | 14 | 51 |
| Cesarean | 8,575 | 35.28 | 4.846 | .052 | 35.18 | 35.39 | 17 | 58 | |
| Total | 31,522 | 34.19 | 4.733 | .027 | 34.14 | 34.24 | 14 | 58 | |
| Medium | Vaginal | 13,354 | 33.46 | 4.777 | .041 | 33.38 | 33.54 | 14 | 51 |
| Cesarean | 5,202 | 34.84 | 4.822 | .067 | 34.70 | 34.97 | 15 | 54 | |
| Total | 18,556 | 33.85 | 4.829 | .035 | 33.78 | 33.92 | 14 | 54 | |
| Small | Vaginal | 4,318 | 34.28 | 4.453 | .068 | 34.15 | 34.41 | 15 | 50 |
| Cesarean | 2,302 | 35.10 | 4.733 | .099 | 34.91 | 35.30 | 16 | 50 | |
| Total | 6,620 | 34.57 | 4.569 | .056 | 34.46 | 34.68 | 15 | 50 | |
| B | E.T | Wald | gl | Sig. | OR | |
|---|---|---|---|---|---|---|
| Large | 105,983 | 2 | .000 | |||
| Medium | .032 | .019 | 2,740 | 1 | 0.98 | 1.032 |
| Small | .279 | .027 | 104,932 | 1 | .000 | 1.322 |
| <26 | 901,324 | 3 | .000 | |||
| 26–35 | .506 | .051 | 98,856 | 1 | .000 | 1.659 |
| 36–45 | .889 | .051 | 300,774 | 1 | .000 | 2.432 |
| >45 | 2.453 | .122 | 404,575 | 1 | .000 | 11.624 |
Coefficient (B): logistic regression equation coefficient; E.T: standard error of B; Wald: Wald statistic; gl: degrees of freedom; Sig.: significance level; OR: odds ratio.
When categorizing the maternal age in four groups (younger than 26 years old, 26–35 years old, 36–45 years old and older than 45 years old), there is a progressive increased risk of CS as maternal age increases (chi square p<0.05) (Fig. 2).
Discussion
In Spain, 20% of deliveries occur in Private Hospitals. In 2017, there were 77,226 births in the Spanish private sector, 42% (32,358/77,226) of them7 were attended in QGH.
The global CS rate in the QGH was 31.4%: 18.36% of the CS were performed in high-risk population and 81.63% in low risk population, according to the IQI 21 index. CS rate in QGH's low risk population (28.4%) is higher than in the Spanish public system: 17.85% and 17.72% in the SERMAS (Servicio Madrileño de Salud9) and the SISCAT (Sistema Sanitari Integrat de Salut Pública de Catalunya10), respectively. On the contrary, comparing our indexes to the ones published in 2017 by the Agency of Healthcare, Research and Quality11 (AHRQ), USA, we find that our IQI 21 is lower (29.9%).
We studied the two variables that could have a higher repercussion in the CS rate: maternal age and type of hospital. Women's mean maternal age attended in the QGH is higher than the mean maternal age of women attending Sistema Nacional de Salud (SNS) in Spain.12–14 Deliveries of women younger than 26 years old are 4% in our study group, but 12% in SNS. 39% of deliveries occurred in women aged 36–45 in our study (31% in SNS). 1% of our patients are older than 45 years old and no patients of this age group were found in the SNS. We found a positive correlation between maternal age and CS. This could explain the higher CS rate in our study.
The type of hospital also has an impact on the CS rate. Large hospitals, with a bigger infrastructure, better means but also more complex cases, show a lower rate of CS (30.6%) than medium hospitals (30.9%) and smaller hospitals (37.1%). The IQIs indexes also show better results in large and medium hospitals (Table 2).
Caughey15 reported that the increase in CS rate in the last decade could be explained by: changes in the delivery attendance; decreased vaginal delivery after a previous cesarean section; continuous intra-partum fetal monitoring; loss of labor and delivery skills; maternal, fetal and demographic factors; increased maternal morbidity (diabetes, hypertension, obesity); increased multiple pregnancy due to assisted reproduction technologies; medico legal aspects and finally the maternal demand without medical indication. The debate on this last point is long-standing and constant in obstetrics and the balance between harm and benefit in vaginal delivery and cesarean section is crucial in this dilemma.16
Although it is true that cesarean section is considered a safe intervention, as long as it is performed under locoregional anesthesia, it is not emergent and antibiotic prophylaxis is performed,17 it is still a major surgery with potentially serious maternal complications and a painful and hard postoperative for patients. In addition, not only primary complications must be taken into account, but also the consequences in future pregnancies. However, cesarean section is a routine intervention for the obstetrician, who can easily lose sight of the aforementioned aspects. Consequently, patients perceive this intervention as simple and request it electively, for varied reasons. First, the intolerance of our society to risk, which leads to the feeling that a programmed intervention has fewer risks than the uncertainty of labor. Second, fear: the pain and fatigue that labor will entail, concern about unforeseen events in obstetrics (fetal distress in continuous monitoring, obstructed labor, instrumented delivery). Third, the possible benefits of CS in preventing injuries of the pelvic floor. Finally, the patients’ demand for this practice has grown, being increasingly accepted by obstetricians and creating a fashion and a vicious circle that makes us lose sight of the fact that it is a major surgery and that it has to be performed only when needed.
Higher maternal age carries higher comorbidities such as gestational diabetes, hypertension and obesity, which could bias the way of delivery. The increase of ART (assisted reproduction techniques) in the last decade has also increased the multiple pregnancy rate and secondary the CS rate.18–20 In our study, we also observe an increase in the CS rate in patients younger than 26 years old. In this aspect, contemporary women are exposed to a great variety of information,21 in which magazines and social media have an outstanding role over the past few years. This fact could influence their perspective and affect their decision making in terms of type of delivery, especially since the paternalist model of Medicine has stepped aside and patients have a more active participation in the decision-making process. In this way, the medical sector is responsible for accurately inform their patients, as well as contribute in the scientific divulgation so that the information that they have is reliable and with appropriate scientific background.
The rate of CS is higher in small hospitals in spite of having fewer complex cases. This fact can be explained by organizational and/or infrastructural aspects, such as having an onsite team of specialists available to support and attend to any obstetric complication. Moreover, a lesser obstetric ability conditioned by fewer deliveries, could contribute to a higher rate of CS. In addition, deliveries should be attended in specialized centers with a multidisciplinary team that includes experienced neonatologists and anesthetists updated in obstetric management. Likewise, we think that delivery care should be focused on those centers with a minimum number of deliveries per year to ensure good care. In this aspect, the disposition of updated protocols and the encouragement of courses and skill workshops could increase the obstetricians’ confidence and increase the likelihood of a vaginal delivery, especially in patients with a previous CS.22–24 Therefore, we think that to achieve a reduction of CS rate a high quality skilled obstetric assistance should be offered. In this sense we believe that 24h on duty obstetric team is essential, as it is offered in our big hospitals team. Some obstetricians in private hospitals have different professional obligations simultaneously, hence hindering their constant presence as part of the team on duty.
The main strength of our study is the large population included: 42% of private deliveries in Spain (32,358/77,226).7 We consider that our data could be strong enough to have epidemiological significance. The clinical and demographic data was obtained from the Conjunto Mínimo Básico de Datos (CMBD), which collects every obstetric episode from each hospital. The delivery registration by obstetricians and midwifes is nearly complete (>99%). All women who delivered in our Hospitals are recorded in an eHC (electronic clinical history) and all data are uploaded to CMBD, so we did not miss any cases due to non-reporting.
However, our study also have some limitations. The main limitation of the study is that it was a retrospective with an inherent risk of bias. We focused our analysis in two variables (maternal age and type of Hospital). Not all variable with potential effect of the primary outcome were available in CMBD, such as body mass index (BMI), smoking or socio-economic status.
ConclusionThere is an increasing use of private sector at the follow-up and care process during pregnancy in Spain. The gross rate of CS in the Quirónsalud group is slightly higher than the one from the Public Healthcare. The older maternal age as well as the hospital resources involved in the delivery attendance can explain this difference. Despite this CS rate differences, it is still uncertain the optimal CS rate due to the lack of an international classification system, which allows comparison between different populations.
Tweetable abstractCS rate in Spanish private medicine is 31.4%, 81.63% of them in low risk population and 69.54% without a previous CS.
FundingThe authors received no specific funding for this work.
Authors’ contributionsPP, BS and AA were responsible for the conception, design and planning of the study. AF and AA carried out data extraction and analyses. AA participated in the analyses and interpretation of the data. PP and AB drafted the article. PP and BS revised the manuscript for important intellectual content. All authors revised and approved the final version of the manuscript.
Conflict of interestsAll authors declare no conflicts of interest.
Under the auspices of the Càtedra d’ Investigació en Obstetrícia i Ginecologia de la Universitat Autònoma de Barcelona.