


Digital technology changes the innovation mode, and the innovative factors among innovation subjects will be digitally empowered. The government plays a very important role in determining the allocation of innovative factors. Therefore, it is necessary to clarify the main source of power for the high-quality development of the manufacturing industry in the future, so as to help the government to use digital technology to adjust the innovative factors allocation appropriately. We used systematic dynamic model to portray the innovation mechanism of manufacturing industry and set relevant parameters based on previous literature to predict the variation of innovation under different scenarios. It was found that government expenditure on science and technology can significantly improve innovation performance, followed by information expenditure, while government expenditure on education needs to reach a certain scale before it can play a positive role. However, after passing a certain threshold, education has a significantly positive role in promoting innovation.Therefore, when the government adjusts the structure of expenditures, it should ensure long-term and stable education expenditure, give full play to the role of innovative factors such as talents. It should also ensure the construction and maintenance of information infrastructure, so as to enhance the industry-university-research collaborative innovation in the digital era and promote high-quality development of manufacturing industry.
The 2022 report of the 20th National Congress of the Communist Party of China asserted that the nation must follow the guidelines of promoting high-quality development, accelerating the construction of a modern economic system, and effectively advancing economic quality while maintaining reasonable growth of quantity. Since the reform and opening up, the innovation capabilities of China's manufacturing industry have significantly improved, some frontier fields have entered the stage of running and leading from outdated operations, and the nation's scientific and technological strength has made a qualitative leap with the simultaneous accumulation of quantity. However, China's manufacturing industry development continues to rely on increased factor input to generate benefits, which is difficult to accommodate while endeavoring to advance the new normal development requirements for China's economy. In addition, China's manufacturing industry has continuously faced low-end surplus and high-end shortage. Notably, the Chinese manufacturing industry generated a total profit of 6.41502 billion yuan, representing a decrease of 13.4 % in 2022.1
These circumstances indicate that in the process of advancing the high-quality development of China's manufacturing industry, problems such as low factor allocation efficiency, insufficient momentum due to weak innovation capabilities, and inadequate high-end product quality result in a low quality supply system (Xu et al., 2022). The reason for this is that innovation factor allocation is distorted in the process of manufacturing development and efficiency is low, which hinders the development of China's manufacturing industry. Innovation factor input is rising in China's manufacturing industry development process; however, China's manufacturing industry has not yet fully benefited from the dividends. Innovation factor allocation in China's manufacturing industry is currently unreasonable and core technology breakthroughs are insufficient, making it difficult to support the manufacturing industry's high-end and high-quality development (David & Venkateswaran, 2016;Chen et al., 2022). Therefore, it is crucial for China to correct this distortion to advance manufacturing industry development.
In recent years, a variety of disruptive digital tools have emerged in an endless stream of big data, intelligent, material, mobile, and cloud technology that is in wide use, presenting a new scientific, technological, and industrial revolution wave. The digital economy is arguably the most innovative quality of the new scientific and technological revolution frontier and trajectory (Zhong & Tao, 2022; Ma & Zhu, 2022). In 2022, China's digital economy accounted for 41.5 % of the nation's gross domestic product (GDP) which is equivalent to the proportion of the secondary industry in the national economy, and the industrial digitalization scale reached 41 trillion yuan. The proportion of the digital economy rose from 74.3 % in 2015 to 81.7 % in 2022.2 Industrial digitalization accelerates growth, and the digital economy's penetration into industry is strong. The digital transformation of the global industrial economy is the trend of the times, and deep integration of digital solutions and manufacturing presents a positive path to promote the manufacturing industry's quality and a practical mechanism for digital empowerment (Xu & Huang, 2020). Therefore, this study contends that under the deployment of accelerating digital development, combined with investment in innovation factors, the internal driving forces of big data technology and the ongoing technological revolution can advance high-quality manufacturing industry development.
The remainder of this paper is structured as follows. We next review the relevant literature and describe the study's proposed mechanisms based on previous research. We then introduce the model and scenario simulations. The results are then presented, followed by a discussion of the findings. Then we conclude and offer some proposed implications. The final section presents the study's limitations and recommendations for future research.
Literature reviewNo single definition of digital empowerment has prevailed. Relevant literature on digital empowerment can be interpreted from three perspectives. From the micro enterprise perspective, digital technology integration empowers enterprises to create value, which has been attributed to the dynamic capabilities that are cultivated by the construction of new infrastructure and the transformation and combination of digital resources to reconstruct key factors such as digital simulation design, data acquisition and prediction, and platform and precision digital service (Teece et al., 1997; Raisinghani, 2004; Zhang & Sun et al., 2021). From the meso industrial perspective, the research object is primarily concentrated on the manufacturing industry. Yuan and Wang (2022) found that digital trade enables enterprises to acquire and strategically use market information, which improves innovation capabilities and promotes manufacturing quality. The manufacturing industry's transformation and upgrading enabled by digital economy is primarily achieved through optimizing resource allocation, reducing production costs, and driving innovative development (Liao & Yang, 2021). From the macroeconomic perspective, the digital economy treats data as a new production factor and innovation as the driving force for empowerment, advancing high-quality economic development through optimized allocation and industrial integration (Acemoglu & Restrepo, 2018; Wang & Fu, 2021; Chen et al., 2022). Digitalization also drives strategic emerging industries’ high-quality development by easing financing constraints, stimulating innovation vitality, leveraging the advantages of a large unified market, and creating resilient industrial chains based on digital technologies and shared data platforms (Huang, Dang, Song, & Sun, 2023).
In the initial research, foreign scholars examined digital empowerment from the perspective of information and communications technology (ICT) empowerment, dividing it into structural, psychological, and resource empowerment dimensions (Leong & Pan et al., 2016). Lenka and Parida et al. (2017) contended that intelligent, connective, and analytical capabilities, enable value cocreation. Li and Wang (2021) asserted that the digital economy is essentially a new paradigm of the technological economy with data as the key element. Furthermore, digital technology integration improves resource allocation optimization and cost reduction and advances the innovation-driven economy (Modi & Mabert, 2010). In essence, these forms of empowerment rely on data elements, digital technologies, and new generation ICT to empower economic activities; however, a consensus has not yet been reached on a unified standard definition (Chi et al., 2020). After Schumpeter (1942) introduced innovation theory, technology, information, knowledge, and systems received considerable research and policy attention (Tao & Xu, 2021).
In the digital age, shared data and increased investment in digital technologies such as big data analytics, blockchain, and artificial intelligence (AI) have made data a new innovation factor for inspiring creative activities (Westerman & Bonnet, 2015). Innovation factors such as talent and capital can be digitally upgraded and enhanced (Shi and Hu, 2022). Such factors include innovation resources, subjects, and environments (Xiao & Xu, 2019; Peng, 2022). Innovative subjects have stronger capabilities to acquire, process, and leverage innovative factors. The innovative environment refers to the platforms on which digital information is shared and establishes a networking environment that is not limited by time and space (Naqshbandi & Jasimuddin, 2022).
Optimal innovation factor allocation is crucial for producing innovation output and advancing innovation efficiency (Xiao & Xu, 2019; Xu and Tao, 2022). He and Fu (2021) argued that resource allocation has a mediating role in promoting innovation factor synergy to significantly accelerate high-quality manufacturing development. Some studies have asserted that innovation factor mismatch, which is primarily caused by inappropriate policies, information asymmetry, market failure, and other obstacles, must be overcome (Hsieh & Klenow, 2009; Brandt & Tombe et al., 2013; Restuccia & Rogerson, 2017; David & Hopenhyn et al., 2016). Analyzed manufacturing industry high-quality development considering multidimensional factor mismatch, and the results revealed that land and capital mismatch can directly inhibit high-quality development. Other research has contended that the driving forces of effective of innovation factor allocation can be divided into internal and external causes, where internal causes include technological progress, technological innovation capabilities, and research and development (R&D) input substitution elasticity (Lofsten, 2016). External causes include a financial market that supports innovation (Brown & Martinsson et al., 2012) and government subsidies that positively guide enterprises to make innovation investments (Shu et al., 2019). However, a misleading effect of innovation factor allocation may also emerge through factor price distortion (Blanes & Vicente et al., 2004). Tang and Huang (2021) found that the inhibitory effect of selective industrial policies on upgrading the manufacturing value chain was primarily caused by capital mismatch. The market-oriented allocation of high-end innovative factors can be divided into industry–university–research collaborative innovation, talent and technology agglomeration, and internet technology service(Chesbrough, 2003). Enterprises’ resource allocation strategy can affect innovation performance (Klingebiel & Rammer, 2014).
A growing number of researchers have argued that digital technology development will reduce misleading effects (Ma & Ning, 2020; Zhang & Duan, 2023). Luo and Zhang et al. (2023) showed that digital technology innovation predominantly drives manufacturing firms’ total factor productivity by alleviating labor factor input distortion. The ease of factor flow influences allocation efficiency (Hsieh & Klenow, 2009), and digitalization has penetration, substitution, and synergy effects that can significantly reduce innovative factor mismatch (Luo & Zhang et al., 2023). The ease with which innovation factors flow through integrated digital economy penetration promotes the digitization of traditional production factors to effectively overcome information asymmetry between regions and industries, reducing barriers and factor allocation mismatch (Ma & Ning, 2020).
Multiple studies have agreed that digital technology considerably contributes to the manufacturing industry's high-quality development (Chao et al., 2021; Lyu & Li, 2021; Zhang & Duan, 2023). Chao et al. (2021) concluded that the digital infrastructure formed by the organic combination of the industrial internet and artificial intelligence has significantly promoted high-quality development through upgrading manufacturing processes and improving market fit. Lyu and Li (2021) asserted that digital technology enables high-quality development by altering the means of value creation and improving enterprises’ value acquisition capabilities. The digital economy is a powerful tool for narrowing the digital divide, which also advances high-quality development. The basic internal mechanisms can be summarized as resource allocation efficiency optimization, production adjustment, industrial chain integration, supply and demand balance, continuous technological innovation, and the emergence of new models such as intelligent, service-oriented manufacturing (Zhang & Duan, 2023).
Previous research has employed various approaches to measure the manufacturing industry's high-quality development. Luo et al. (2023) quantified innovation efficiency and technological capabilities to reflect high-quality development, empirically demonstrating that labor factor allocation has a positive effect on innovation efficiency, but exerts a negative effect on innovation capabilities, and capital factor allocation has a negative effect on both. Wang and Chen (2022) measured the manufacturing industry's quality development using innovation and efficiency dimensions, finding that broad internet connectivity promotes high-quality development by improving capital and labor factor allocation efficiency.
Based on the previous research discussed above, this study contributes to the literature in three ways. First, the findings confirm the connotations of innovative factor allocation. Second, the study analyzes the mechanism of collaborative innovative factor allocation on the manufacturing industry's high-quality development using a system dynamics (SD) model. Third, it simulates different innovative environments to analyze their corresponding effect, providing strategic insights for professionals and policymakers alike.
MechanismThe new generation of information technology has promoted factor allocation efficiency, and innovative factor allocation optimization driven by digital technology stimulates continuous upgrading in the manufacturing industry (Li & Han, 2021; Zhang et al., 2023). This study divides this mechanism of action into the following stages.
First, data have characteristics of permeability, virtual substitution, dynamic accuracy, and low-cost sharing (Gunther, 2017; Wang & Fu, 2021). Ubiquitous can digitize traditional factors and drive these factors to high-efficiency sectors (Jagtiani & Lemieux, 2019; Guo et al., 2022), improving the quality and structure of factor allocation. The innovative subjects within the system include enterprises, universities, scientific research institutions, and governments that coordinate innovative factors within an industry or region through collaborative interaction (Haken,2012; Bai & Jiang, 2015). Notably, the innovative factors among these innovation subjects exist in certain forms, rather than being scattered as individuals across the entire market. For example, universities and research institutions are important carriers for talent training, knowledge development, and technological innovation (Drejer & Jørgensen, 2005). It is difficult to fully move freely in the market and when the factor market is in a state of low efficiency, different innovative factors will be excessive or in short supply. Therefore, this study contends that when innovative subjects collaborate using digital technology, efficiency will improve.
With the guidance of government policies and institutional support, various innovative subjects, dominated by enterprises, universities, and scientific research institutions, can have a stronger impact on manufacturing industry quality using digital platforms. These factors complement one another and facilitate resource flow, benefiting from resource sharing and value creation (Palazuelos, Herrero Crespo, & Montoya del Corte, 2018). In the digital age, manufacturing enterprises can apply digital information technologies such as cloud computing and artificial intelligence to production and circulation. Through intelligently analyzing production data, enterprises’ digital talent can accelerate production process optimization, accurately adjust production factor input allocation, increase the synergy among factors, achieving factor multiplier benefits to improve production efficiency and increase output (Acemoglu & Restrepo, 2018). Furthermore, enterprises’ digital talent can now obtain consumers’ differential preference information by analyzing transaction and behavioral data, enabling enterprises to produce strategically targeted products based on consumers’ individual needs, and promote optimal enterprise factor input to improve supply quality and flow.
Finally, enterprises can advance product and technological innovation through external knowledge absorption and internal R&D (Cohen & Levintal, 1989). However, some challenges can arise in internal R&D such as insufficient R&D funds and lack of core technology R&D capabilities ((Palazuelos et al., 2018)). With the ongoing development of the new generation of information technology, data on the digital platform mitigates information asymmetry, enabling information elements to circulate among various innovation subjects (Borgatti et al., 2009; Aral & Walker, 2011). In response to market demand and trends, enterprises produce technical requirements to expediently inform universities and scientific research institutions about the development challenges encountered, capturing the most urgent technical needs. As an important driving force of scientific and technological innovation, universities and scientific research institutions function as technology suppliers(Rasiah, 2019). In collaboration with universities’ scientific research institutions, enterprises can coordinate internal and external innovation resource allocation, investing internal human capital in innovation activities in collaboration with the abundant knowledge and human capital of higher education to advance scientific research and innovation, resulting in an innovation synergy effect (Lee et al., 2019) to jointly develop breakthrough core technologies. By leveraging the talent and technological advantages of scientific research institutions in colleges and universities to address pressing development needs, enterprises can increase the impact of R&D investment, improve scientific and technological innovation capabilities, and reduce the expense of R&D to advance manufacturing product and technology innovation and upgrade manufacturing quality.
In summary, digital empowerment allows for rational innovation factor allocation by enabling innovation subjects’ collaborative cooperation. Each innovation subject contributes to improving the supply quality, leveraging core technology, and developing new products through coordinated allocation of knowledge, information, technology, and talent on digital platforms to improve manufacturing quality.
ModelingAs noted above, collaborative cooperation among multiple innovative subjects on digital platforms is primarily based on relationships between enterprises, universities, and scientific research institutions. We employ the SD method to simulate manufacturing industry development based collaborations between innovative subjects in the innovative environment with digital empowerment.
The main purpose of this study's modeling is to explore the process of innovative factor allocation by examining innovative subjects’ collaborative synergy in the digital environment. According to D'Este et al. (2013) and Lee et al. (2019), alliance of IUR(industry–university–research) collaborative innovation synergy represents innovative factor allocation. Based on this model, we investigate future manufacturing industry development using calculation and simulation. In a complex innovation system, innovative factor allocation refers to the flow of innovation factors, innovative subjects’ collaborative cooperation, and economic output(Linde et al., 2021). Some external environmental variables are not included, making the simulated system abstract and generalized. We first present the following three research assumptions before presenting the model.
- (1)
Manufacturing industry development is a dynamic and continuous process, and its systemic economic activity practices are causal rather than random(Machado et al., 2020). The impact of force majeure is not considered.
- (2)
We measure collaborative innovation capabilities under digital empowerment using the status of digital technology infrastructure in the information service industry and the number of researchers and published scientific papers from enterprises, universities, and research institutions (Li, 2020). Manufacturing industry quality development is represented by the sales revenue of new products to capture innovation output (Chen & Chen, 2023). The manufacturing industry's development scale is expressed by the total output value of industrial enterprises above a designated size, which annual main business income reaches 20 million yuan or above.
- (3)
We measure the sources of external funds for enterprises, universities, and scientific research institutions to support innovative activities referencing government financial expenditure, assuming no funds delays or lags. For simplicity, external funds from other sources are not considered.
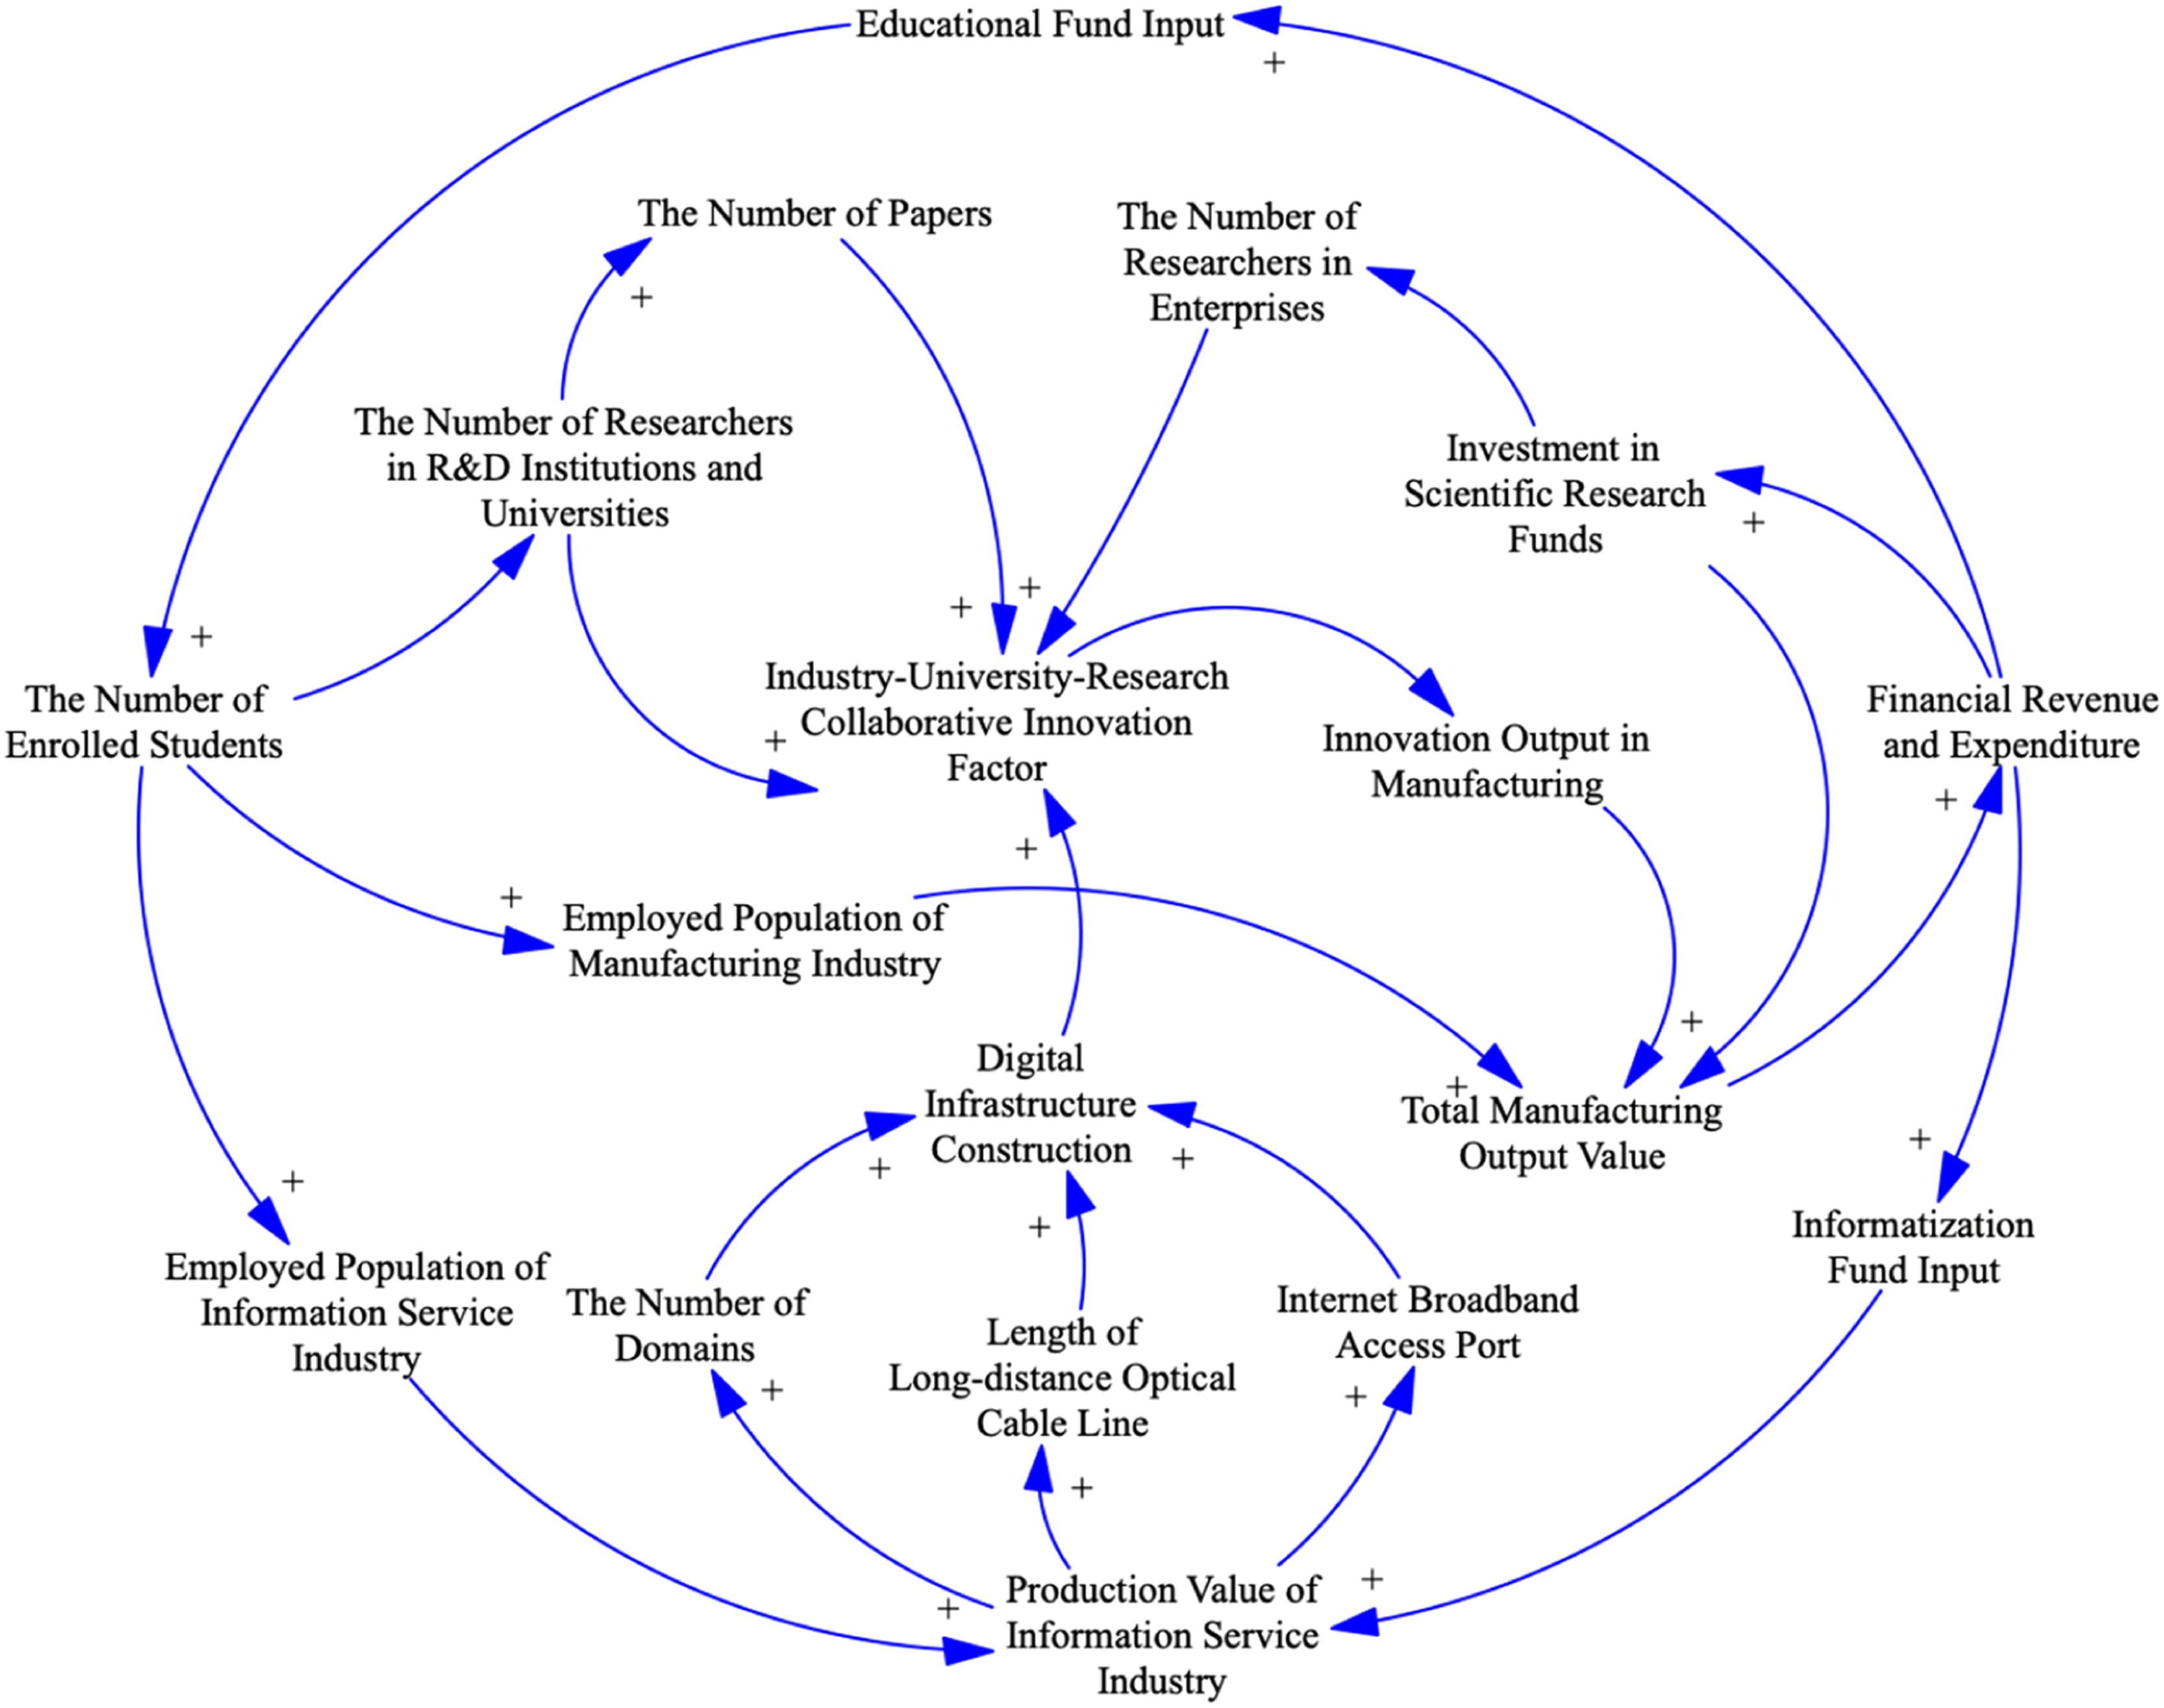
A causality diagram is presented to qualitatively describe the complex system encompassing the manufacturing industry's high-quality development, reflecting manufacturing development quality improvement simply and intuitively using a simplified feedback route.
As described above, with digital empowerment, different innovative subjects can share innovative factors using digital platforms. As manufacturing industry development transitions from traditional factor-driven to innovation-driven approaches, collaborative allocation of innovative factors occurs in the system through collaborative industry–university–research synergistic innovation. Capital is the most fluid factor in the system(Bils et al., 2021), therefore, we focus on capital flow in the system. Mutual capital flow and information flow creates economic value for the manufacturing industry. The government's financial expenditure can accurately flow to enterprises, universities, scientific research institutions, and the information service industry driven by data, affecting investment in knowledge and human capital, subsequently raising the manufacturing industry's innovation output and total output value. Increased total output value strengthens the government's financial expenditure in a typical positive feedback relationship. Innovative subjects’ collaborative improvement includes total output value, innovation output, information, talent, capital, and knowledge. Combined with the relevant mechanisms presented above, referencing Wang and Chen (2020) and Chao et al. (2021) on the manufacturing industry's high-quality development and Feng and Zhang (2018), Li (2020), and Guo et al. (2021) on industry–university–research collaboration, we express the interactive relationships with the causal relationship diagram presented in Fig. 1. The causal feedback loop in the figure illustrates that when the manufacturing industry's total output value increases, the government is able to increase investment in human capital and digital platform development, which promotes the manufacturing industry's innovation output, further increasing total output value. This demonstrates a virtuous cycle of improving manufacturing development quality.
System dynamics model
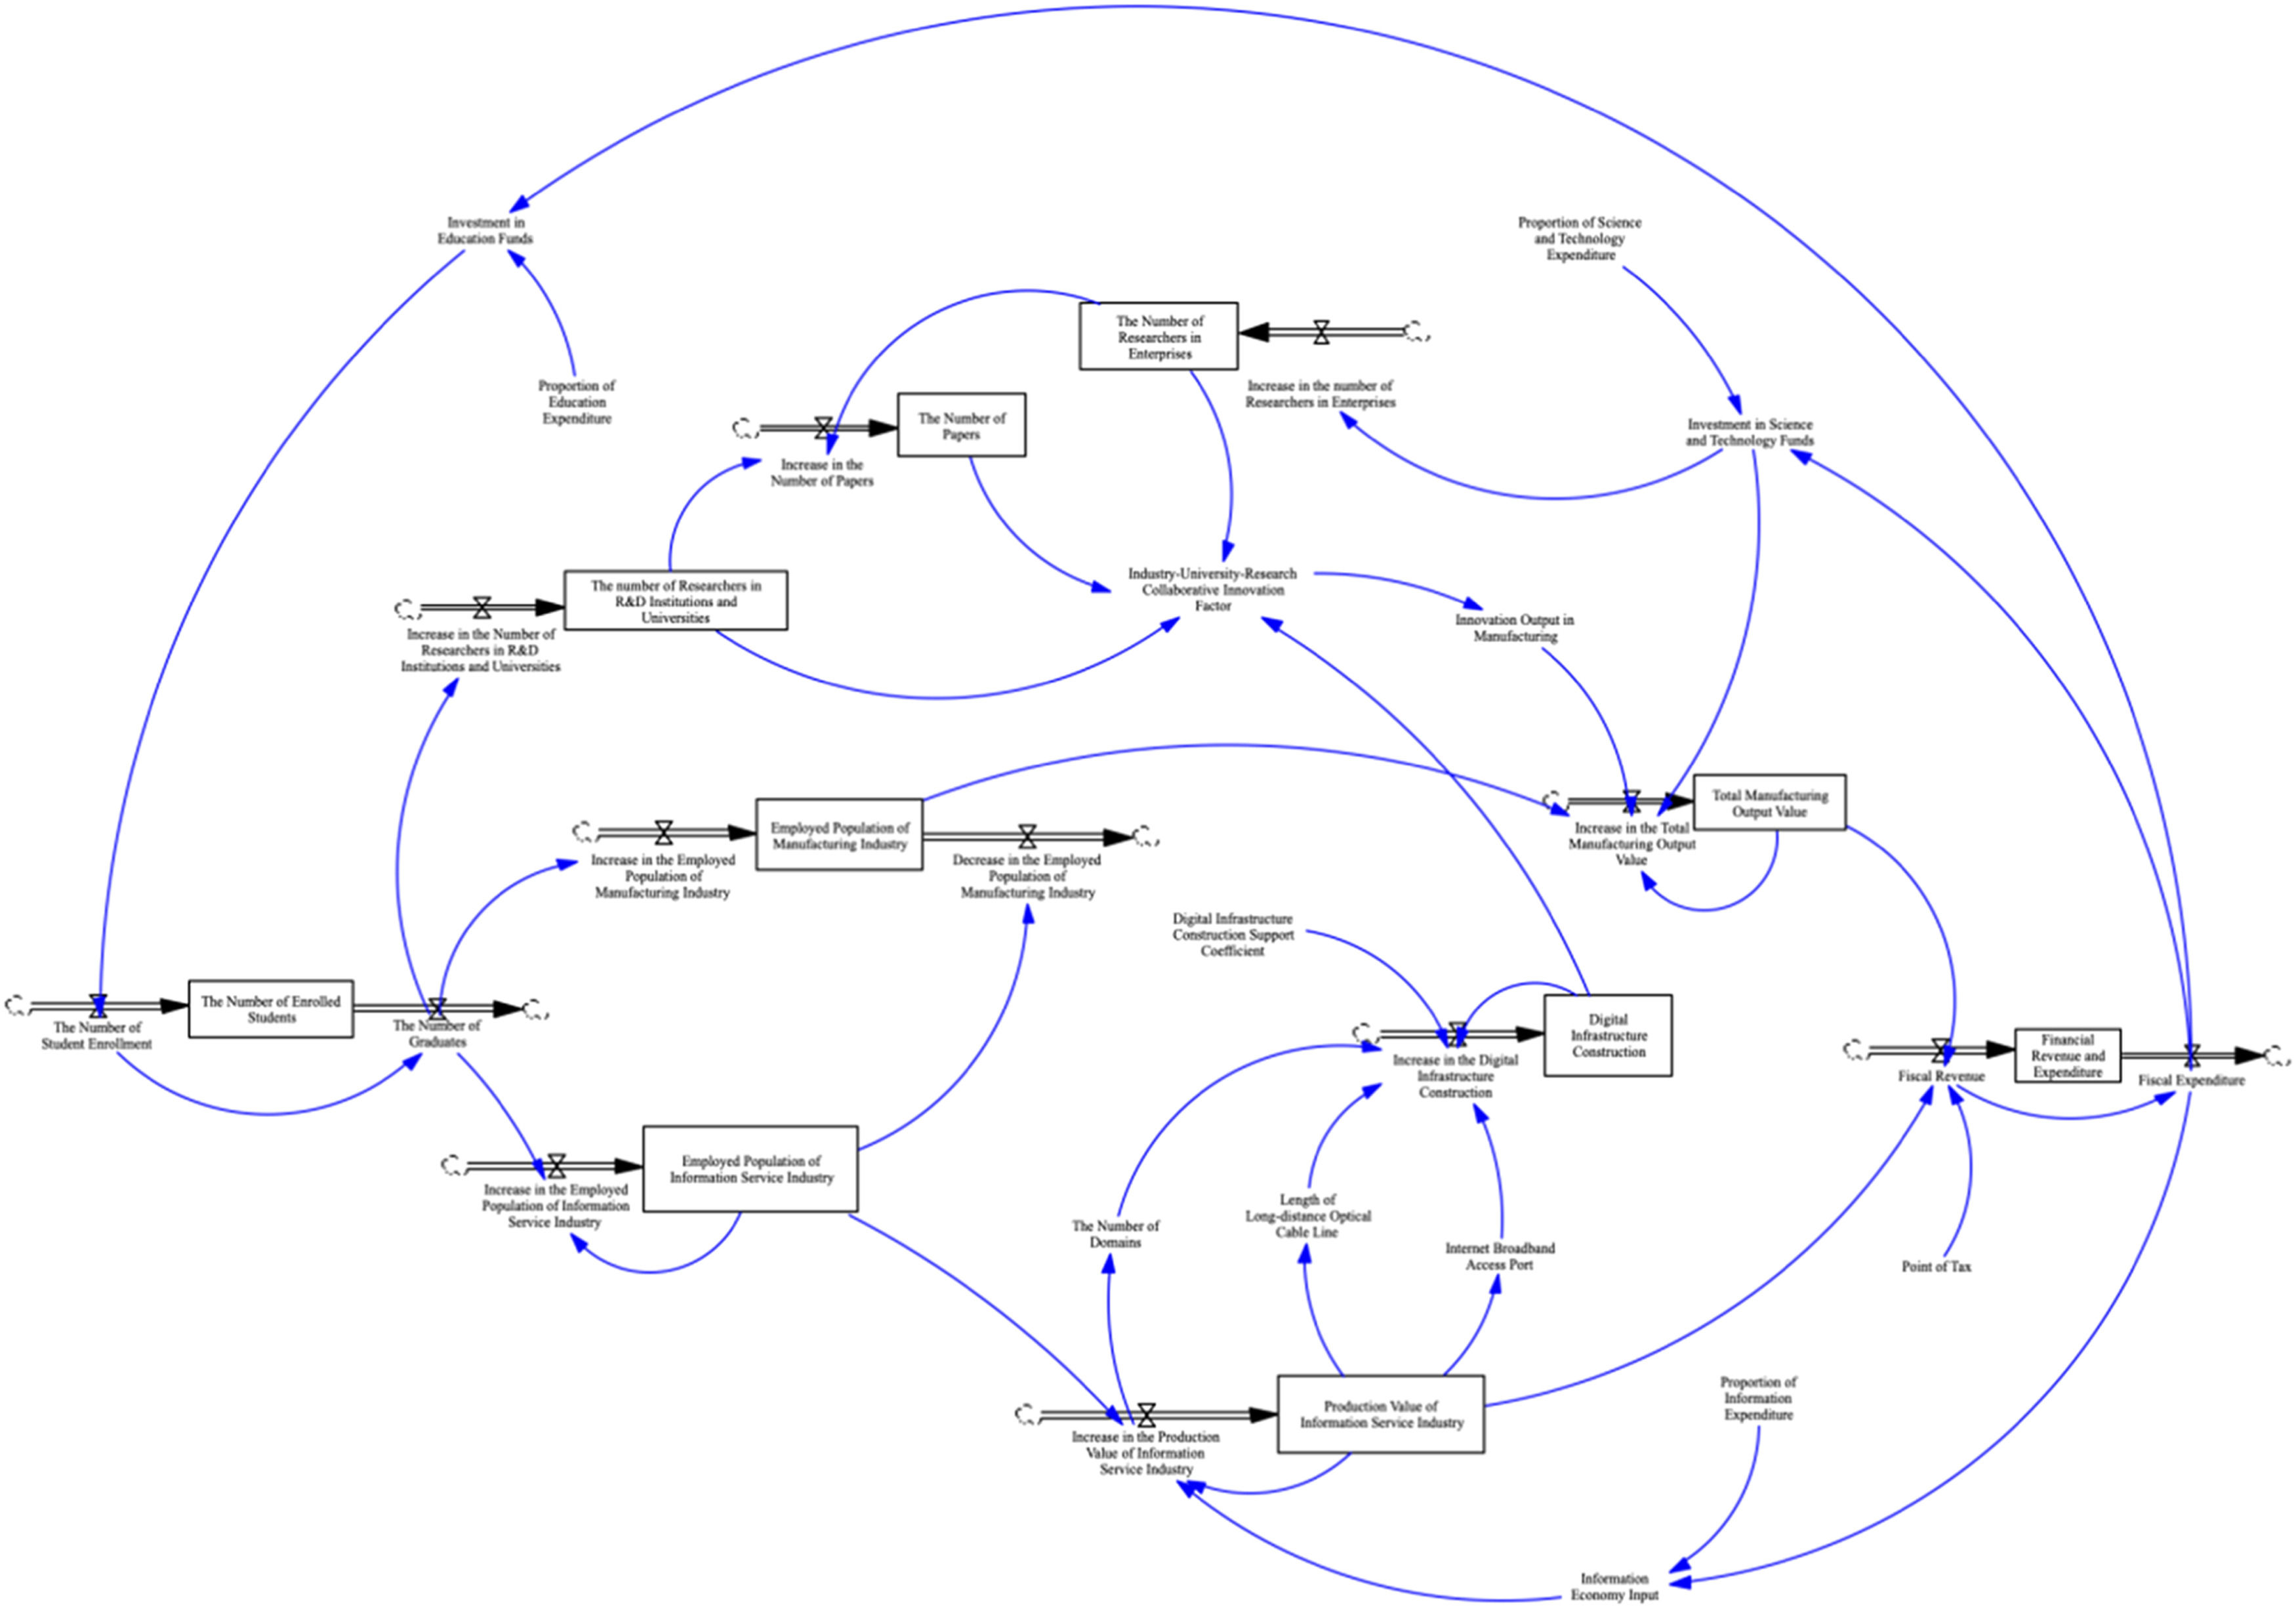
Based on the feedback route, we use Vensim PLE to construct the flow diagram of the manufacturing industry's high-quality development system under digital empowerment in Fig. 2.

The state variables in manufacturing industry the high-quality development system include total output value, financial revenue and expenditure, digital infrastructure, the number of innovative enterprises, the number of innovative universities and research institutions, the number of published papers, number of students enrolled, the number of employees in the manufacturing industry, the number of employees in information service industry, and the information service industry's output value(Ackerberg et al., 2015). The rate variables include increases in total manufacturing output value, fiscal expenditure, fiscal revenue, digital infrastructure, the number of innovative enterprises, the number of innovative universities and research institutions, the number of published papers, the number of students enrolled, the number of graduates, the information service industry's output value, the number of employees in manufacturing and information service industries, in addition to decreases in the number of manufacturing industry employees. Constants include tax rates, the proportion of education expenditure, the proportion of R&D expenditure, the proportion of information expenditure, and the digital infrastructure support coefficient, which we construct referencing the number of domains, the length of long distance cable lines, and internet broadband access ports. The remaining variables are auxiliary variables
Model equationAfter drawing the flow diagram of the system, it is necessary to determine the equations among variables to describe the relationship between variables in the system quantitatively, so as to achieve the recurrence under the change of variables and the advancement of the whole system. SD equations are generally divided into horizontal, initial, rate, auxiliary, and constant equations(Geoferry, 1969; Ogata, 1998). The measurement indicators that we selected for each variable are based on annual data of thirty provinces, autonomous regions and municipalities directly under the Central Government from 2010 to 2019 in the China Statistical Yearbook, the EPS China Science and Technology database. The constant indicator samples are averaged during the period and are exogenous with little fluctuation during the sample period. Referencing Feng and Zhang (2018), Li (2020), and Guo et al.(2021), we determine the correlation variable parameters and relational expressions using linear and polynomial regression methods. We set the corresponding values for parameters that are difficult to estimate as parameter values when the model behavior does not change significantly after applying the model. In the process of constructing the model equation, we continuously debugged the variables and relational expressions by introducing the real experience data until the model simulated the relationships between each variable more accurately to reflect actual real world circumstances(Jones & Tonetti, 2020). Finally, the SD model equation to examine the relationship between the collaborative cooperation between innovative subjects and manufacturing industry development quality under digital empowerment is completed. The main equations and parameter settings are as follows:
Total manufacturing output = INTEG (total manufacturing output increase, 130,325)
Manufacturing innovation output = 1.2e + 06* industry–university–research collaborative innovation factor
Industry–university–research collaborative innovation factor = 0.01*Digital infrastructure construction * Number of papers ^0.3 * Number of researchers in universities and research institutions ^0.6 * Number of researchers in enterprises ^0.1
Digital infrastructure construction = INTEG (increased digital infrastructure construction, 0.1)
Digital infrastructure construction increase = 0.001 * Digital infrastructure construction support coefficient * (Number of domain names/865 + long distance cable line length/800,000 + Internet broadband access port/18,000) * (1 − digital infrastructure construction)
Internet broadband access port = 2.83 * Value of information service industry output
Length of long distance optical cable line = 65.51* Value of information service industry output
Number of domain names = Increase in information service industry output value
Fiscal revenue and expenditure = INTEG (fiscal revenue − fiscal expenditure, 0)
Information service industry output value = INTEG (increased information service industry output value, 8881)
Number of scientific research enterprises = INTEG (increased number of scientific research enterprises, 193.91)
Number of scientific research universities and institutions = INTEG (increased number of scientific research universities and institutions, 58.32)
Number of papers = INTEG (increased in number of papers, 8881, 124.53)
Number of students = INTEG (number of enrolled students − number of graduates, 2385.63)
Tax point = 0.16
Proportion of science and technology expenditure = 0.036
Proportion of information technology expenditure = 0.031
Proportion of education expenditure = 0.15
Digital infrastructure construction support = 0.6
We introduce the above equation and parameter settings into Vensim PLE and conduct simulation analysis of the model with simulation step 1 and an operation range from 2010 to 2035. The period from 2010 to 2019 is the test period of model operation representing real circumstances, which can be used for model debugging and related parameter determination, and 2020–2035 is the forecast period of system simulation, which predicts the trend in the next 15 years for policy analysis.
Model verificationWe conduct visual inspection and stability and validity tests in this section to confirm the reliability of the model's simulation results, followed by a correlation analysis of the simulations.
Visual inspectionWe use visual inspection to assess the accuracy of causality between the model's variables, the rationality of the equation settings, and the consistency of the dimensions. To do so, we applied Check Model and Units Check in Vensim PLE. In the Check Model test results, the system indicates that the two variables “number of students on campus” and “financial balance” are not in the model; however, we use enrollment and graduates in the model for the number of students variable, and fiscal revenue and fiscal expenditure for the financial balance variable. Therefore, the model is complete and passes the test. In the Units Check test results, the system indicates that all other variables passed the test except for the industry–university–research collaborative innovation qualitative variable. Therefore, the SD model structure of this study can be considered reasonable.
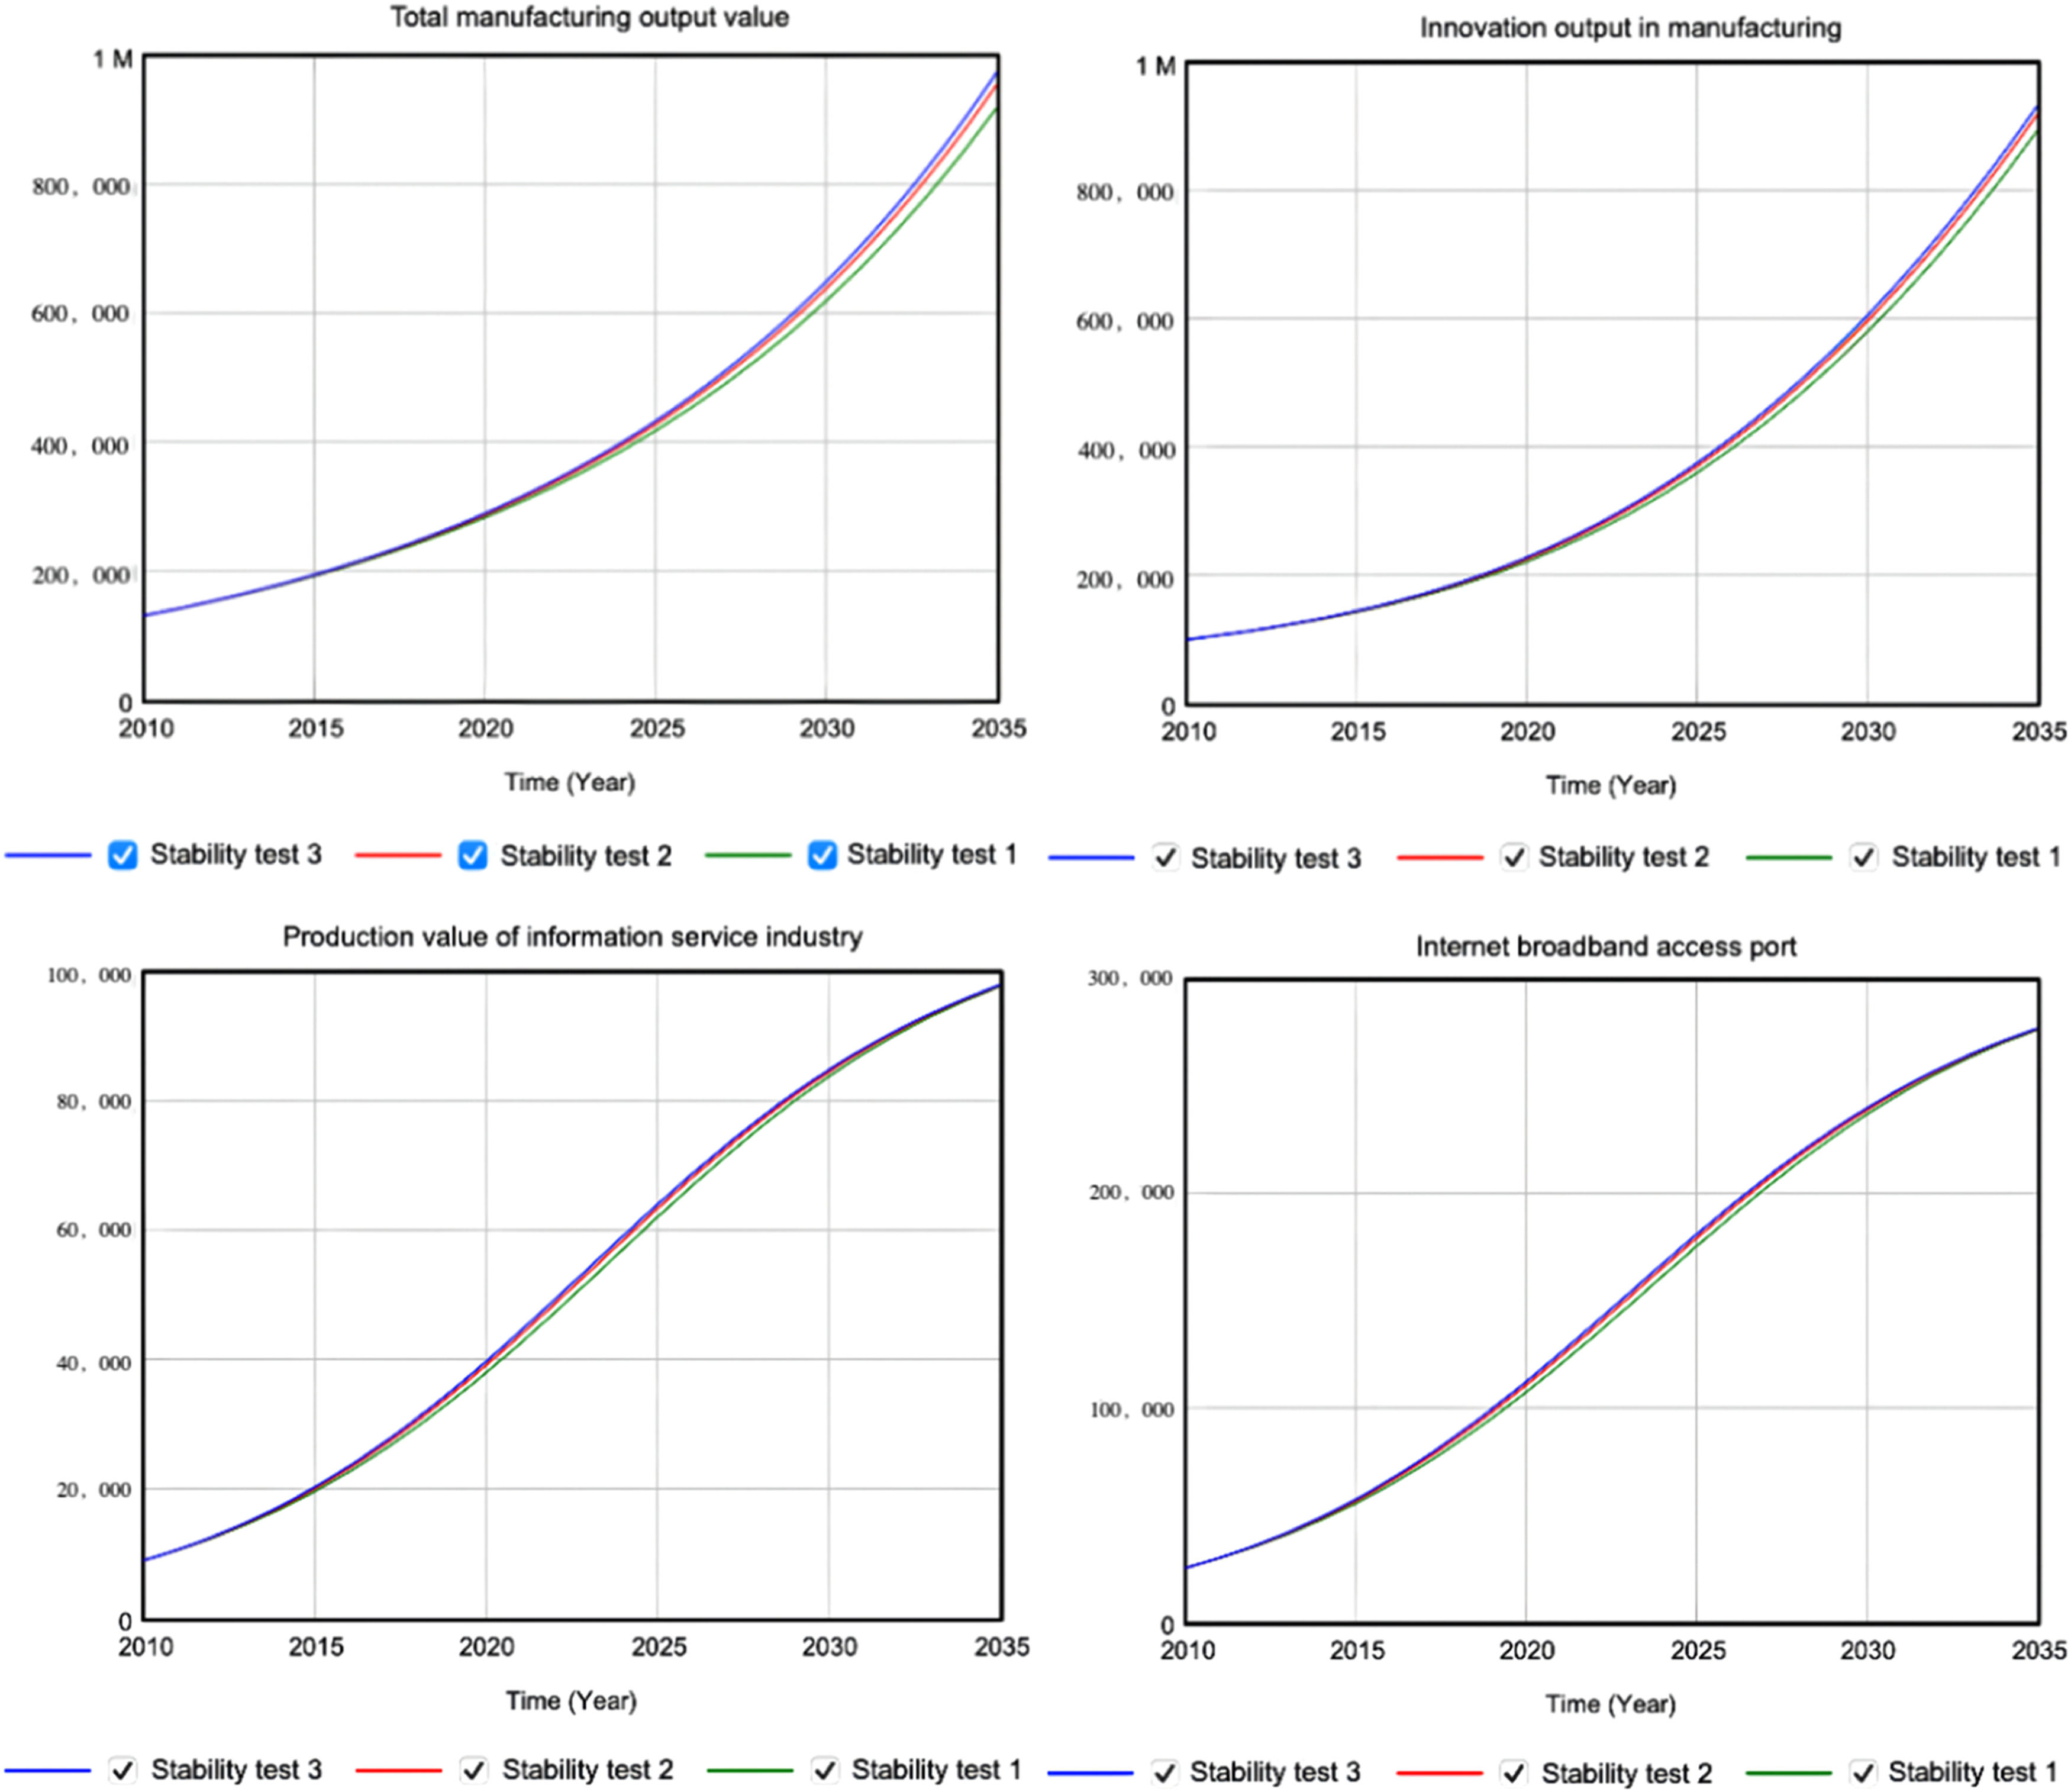
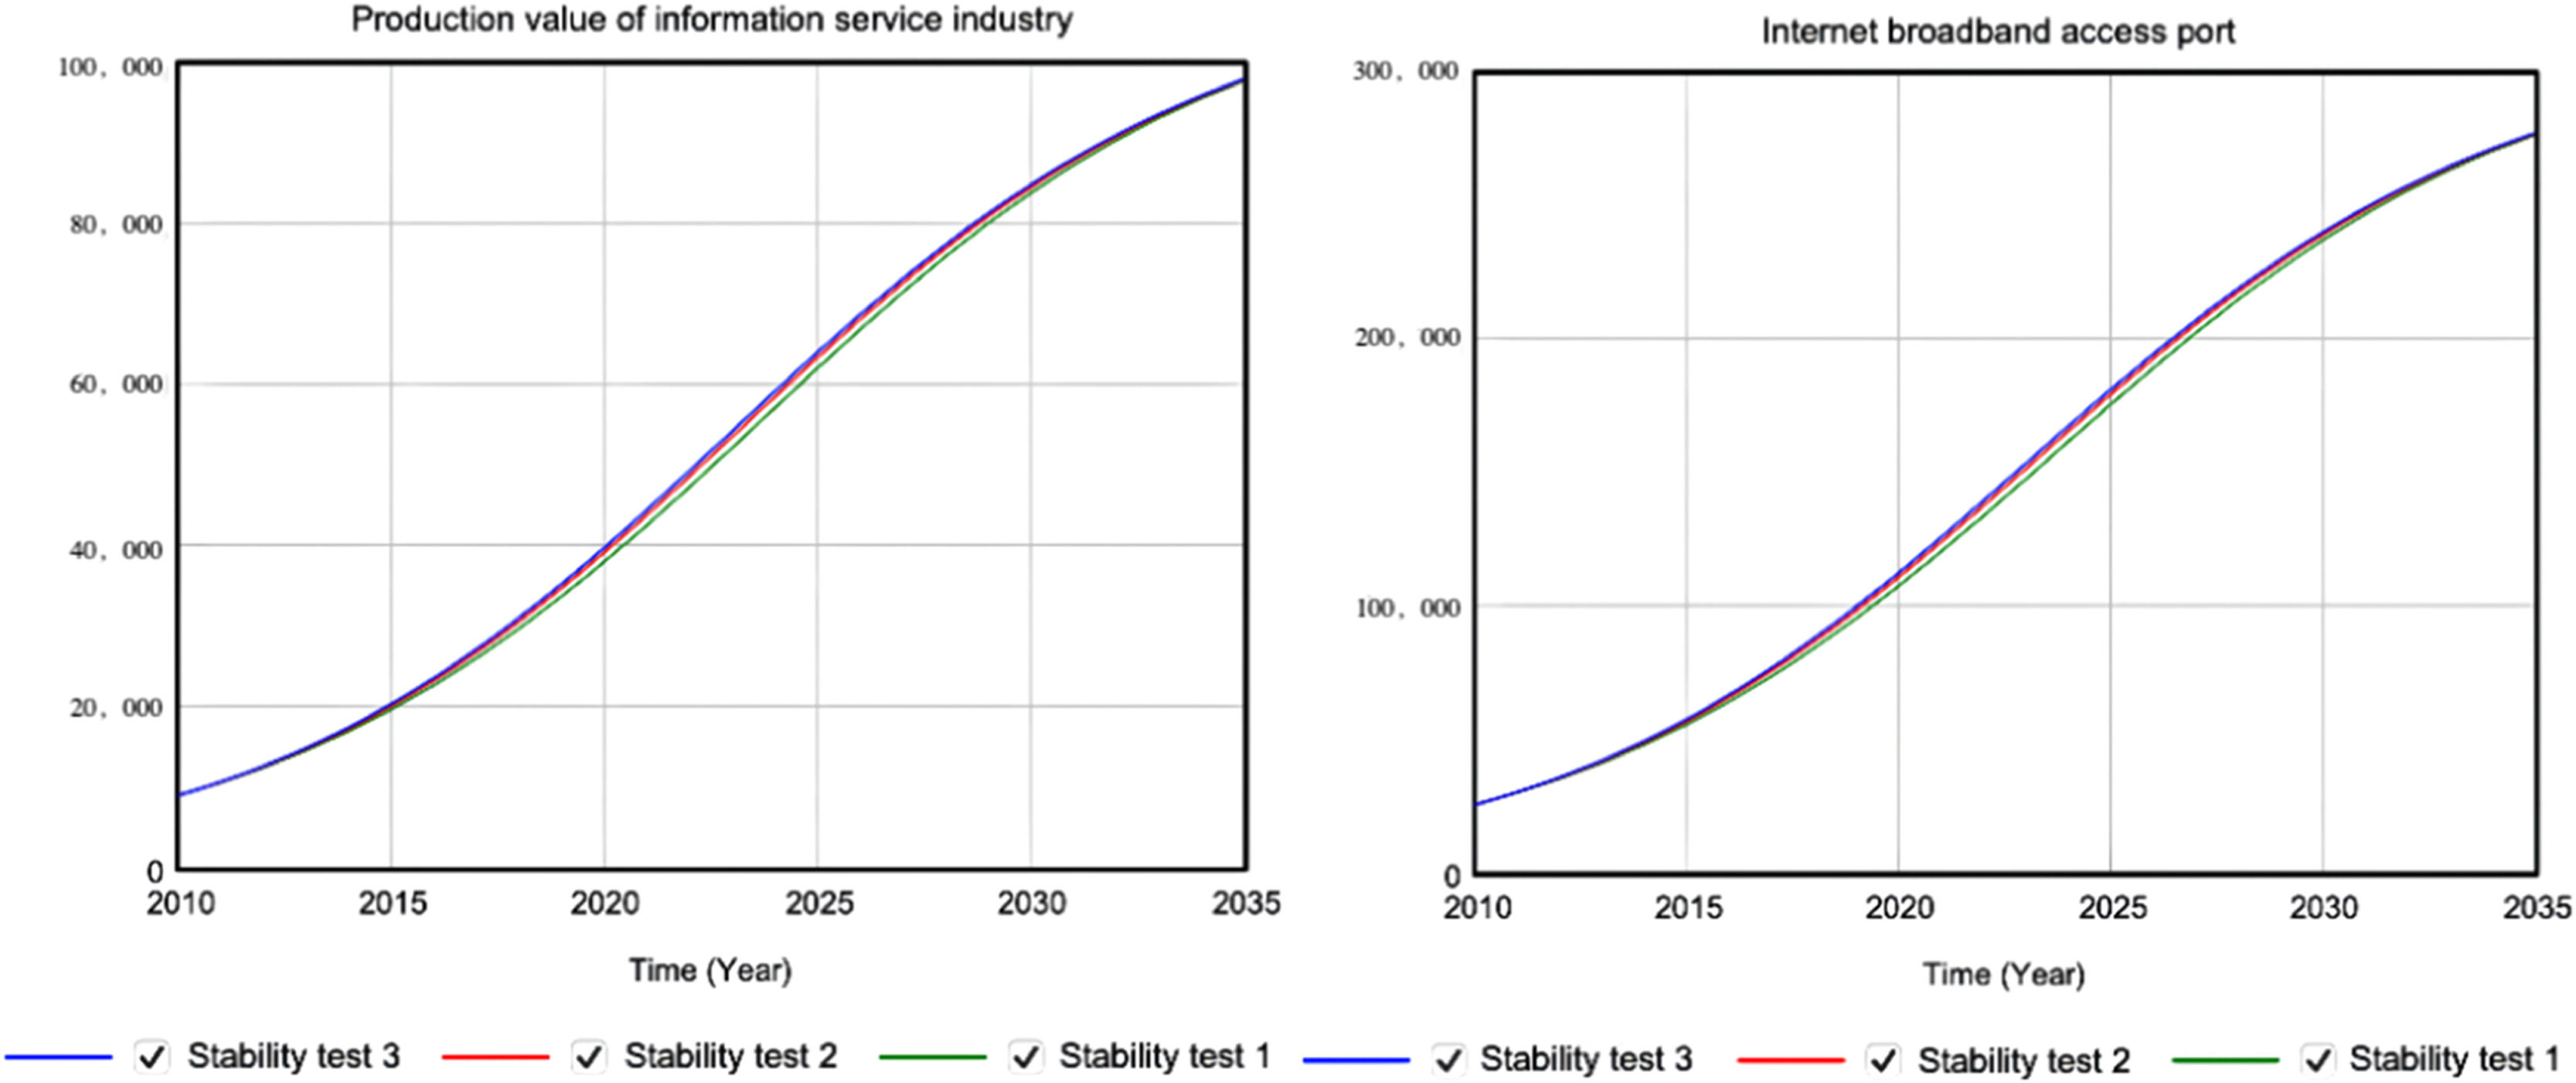
Stability testWe test the robustness of our model by setting up different simulation time intervals and observing the changes across variables, with time steps set to 1 year, 0.5 year, and 0.25 year corresponding to robustness tests 1, 2, and 3, respectively. The trends of manufacturing output, manufacturing innovation output, information service output, and internet broadband access ports in the model are shown in Fig. 3. The variables remain consistent under different time steps, with no drastic fluctuations, confirming the stability of the established SD model.
Validity check
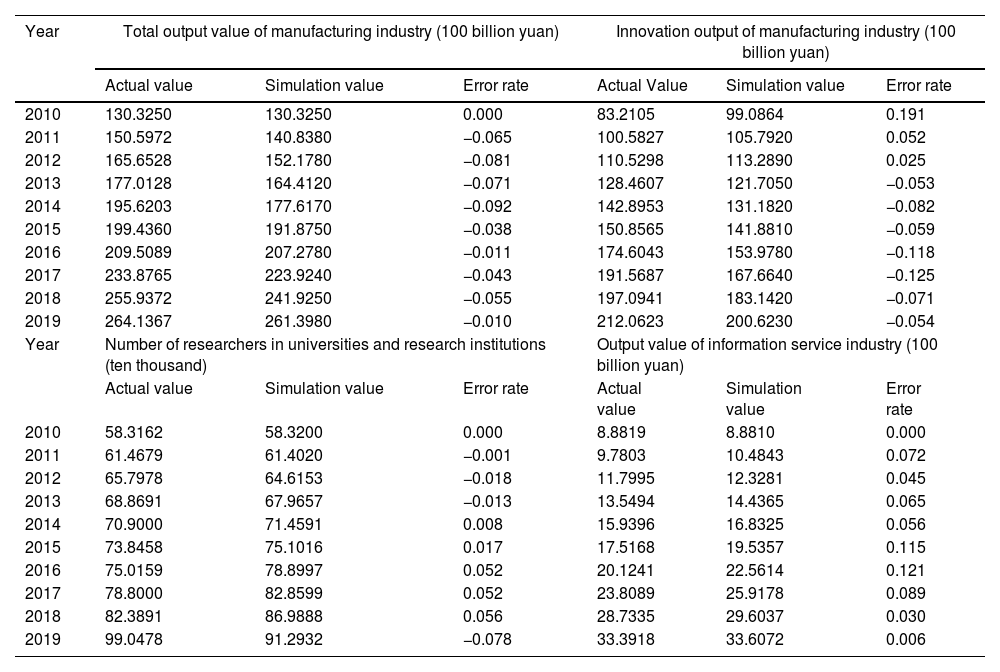
The validity test is conducted to examine whether errors between simulated and actual values in the model are evident. The error rate (error rate = (simulated value − actual value)/actual value) is calculated using the results of the model operation and the actual data from the same period. If the error rate is small (generally controlled within 10 %), the model passes. Otherwise, the model needs to be adjusted and modified. We select representative variables such as total output value of manufacturing industry, innovation output of manufacturing industry, number of researchers in universities and research institutions, and output value of information service industry. The test results are shown in Table 1.
System dynamics model representative variable test results.
| Year | Total output value of manufacturing industry (100 billion yuan) | Innovation output of manufacturing industry (100 billion yuan) | ||||
|---|---|---|---|---|---|---|
| Actual value | Simulation value | Error rate | Actual Value | Simulation value | Error rate | |
| 2010 | 130.3250 | 130.3250 | 0.000 | 83.2105 | 99.0864 | 0.191 |
| 2011 | 150.5972 | 140.8380 | −0.065 | 100.5827 | 105.7920 | 0.052 |
| 2012 | 165.6528 | 152.1780 | −0.081 | 110.5298 | 113.2890 | 0.025 |
| 2013 | 177.0128 | 164.4120 | −0.071 | 128.4607 | 121.7050 | −0.053 |
| 2014 | 195.6203 | 177.6170 | −0.092 | 142.8953 | 131.1820 | −0.082 |
| 2015 | 199.4360 | 191.8750 | −0.038 | 150.8565 | 141.8810 | −0.059 |
| 2016 | 209.5089 | 207.2780 | −0.011 | 174.6043 | 153.9780 | −0.118 |
| 2017 | 233.8765 | 223.9240 | −0.043 | 191.5687 | 167.6640 | −0.125 |
| 2018 | 255.9372 | 241.9250 | −0.055 | 197.0941 | 183.1420 | −0.071 |
| 2019 | 264.1367 | 261.3980 | −0.010 | 212.0623 | 200.6230 | −0.054 |
| Year | Number of researchers in universities and research institutions (ten thousand) | Output value of information service industry (100 billion yuan) | ||||
| Actual value | Simulation value | Error rate | Actual value | Simulation value | Error rate | |
| 2010 | 58.3162 | 58.3200 | 0.000 | 8.8819 | 8.8810 | 0.000 |
| 2011 | 61.4679 | 61.4020 | −0.001 | 9.7803 | 10.4843 | 0.072 |
| 2012 | 65.7978 | 64.6153 | −0.018 | 11.7995 | 12.3281 | 0.045 |
| 2013 | 68.8691 | 67.9657 | −0.013 | 13.5494 | 14.4365 | 0.065 |
| 2014 | 70.9000 | 71.4591 | 0.008 | 15.9396 | 16.8325 | 0.056 |
| 2015 | 73.8458 | 75.1016 | 0.017 | 17.5168 | 19.5357 | 0.115 |
| 2016 | 75.0159 | 78.8997 | 0.052 | 20.1241 | 22.5614 | 0.121 |
| 2017 | 78.8000 | 82.8599 | 0.052 | 23.8089 | 25.9178 | 0.089 |
| 2018 | 82.3891 | 86.9888 | 0.056 | 28.7335 | 29.6037 | 0.030 |
| 2019 | 99.0478 | 91.2932 | −0.078 | 33.3918 | 33.6072 | 0.006 |
The test results in Table 1 reveal that the maximum error rate of the manufacturing industry's total output value is −9.2 %, and the average error rate is 5.17 %. The highest error rate of manufacturing innovation output is 19.1 %, and the average error rate is 8.29 %. The highest error rate of the number of researchers in universities and research institutions is −7.8 %, and the average error rate is 2.95 %. The highest error rate of the output value of the information service industry is 12.1 %, and the average error rate is 6.00 %. The actual value corresponding to the highest error rate of manufacturing innovation output is a missing value, which generates a high error rate. Although relatively high error rates are evident for the manufacturing industry's innovation output and the information service industry's output, the average error rate of each variable is less than 10 %, and the absolute error rate is less than 10 %. Therefore, the gap between the simulated value and the actual value simulated in the SD model is within the acceptable range, confirming that the model passed the validity test.
Basic simulationIn the basic simulation, the structure of the manufacturing industry and its influencing factors are consistent with the reality, and the parameters of the model remain unchanged. This section simulates the development of innovative factors from 2010 to 2035 based on the SD model as shown in the Fig. 4.

The number of R&D institutions and universities has grown steadily, and the growth curve of corporate R&D personnel is steeper, revealing a higher growth rate. This indicates that innovative enterprises will assume a more significant leading role in the future in the context of digital empowerment. The industry–university–research collaborative innovation factor also has a steeper development curve than digital infrastructure, indicating that compared with improving digital technology facilities, industry–university–research collaborative innovation will become the primary engine for high-quality manufacturing industry development in the future.
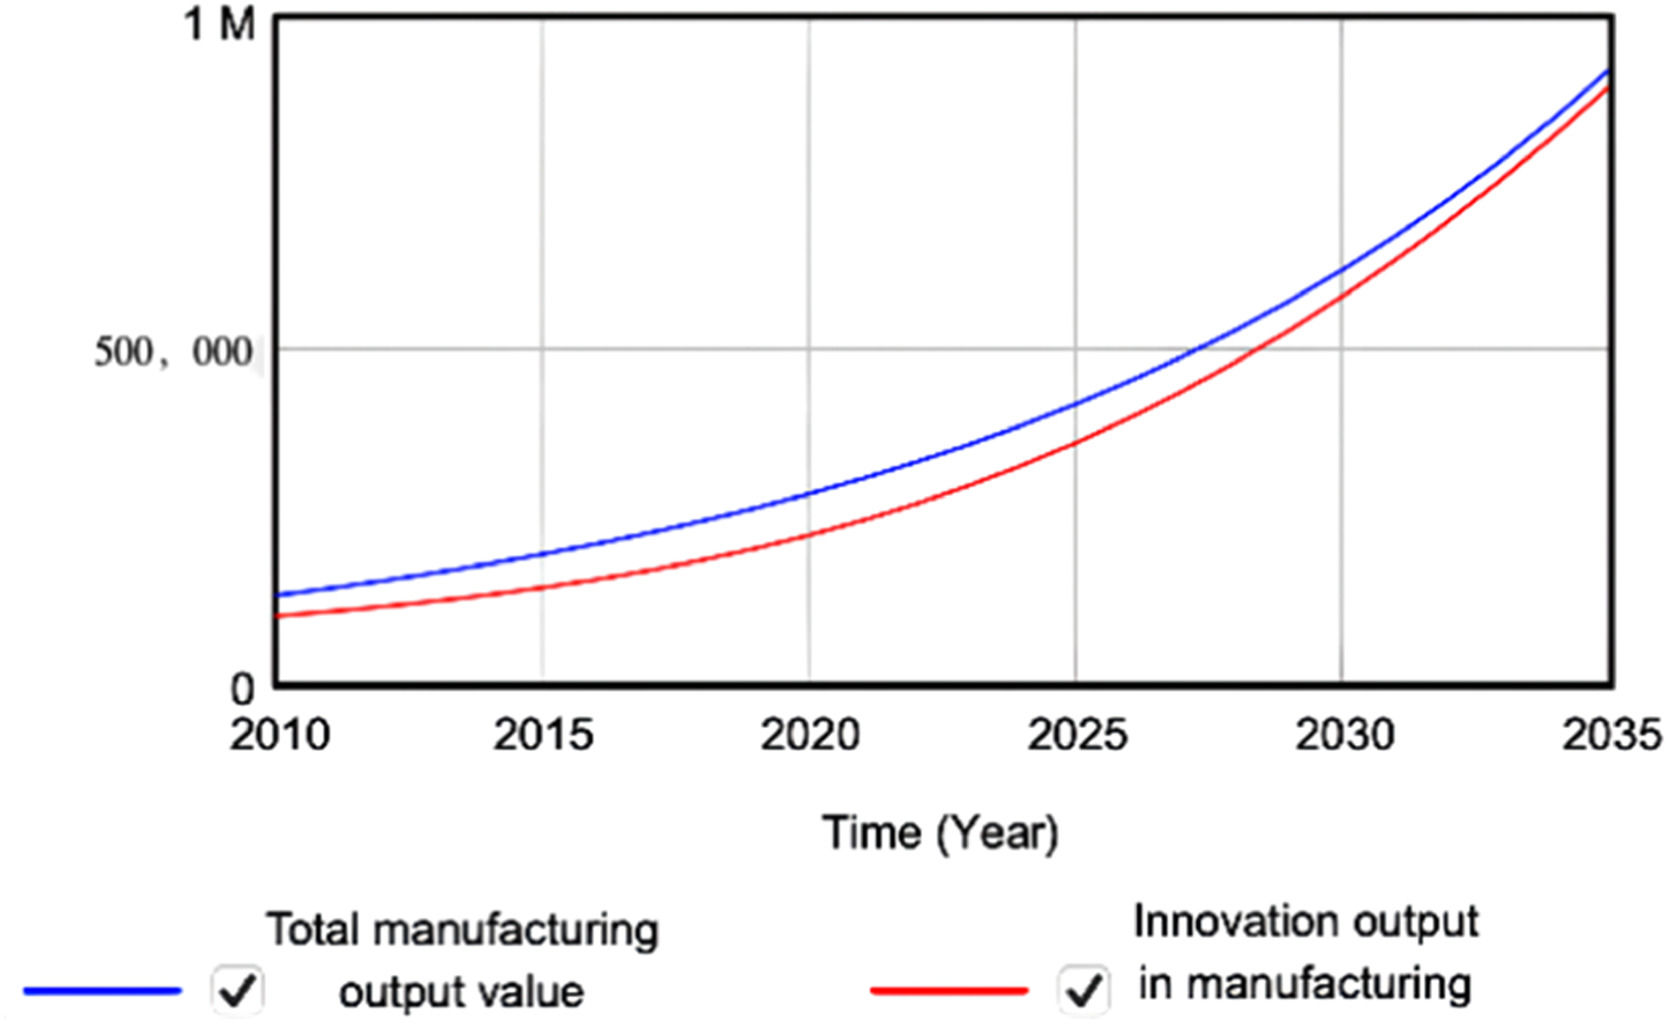
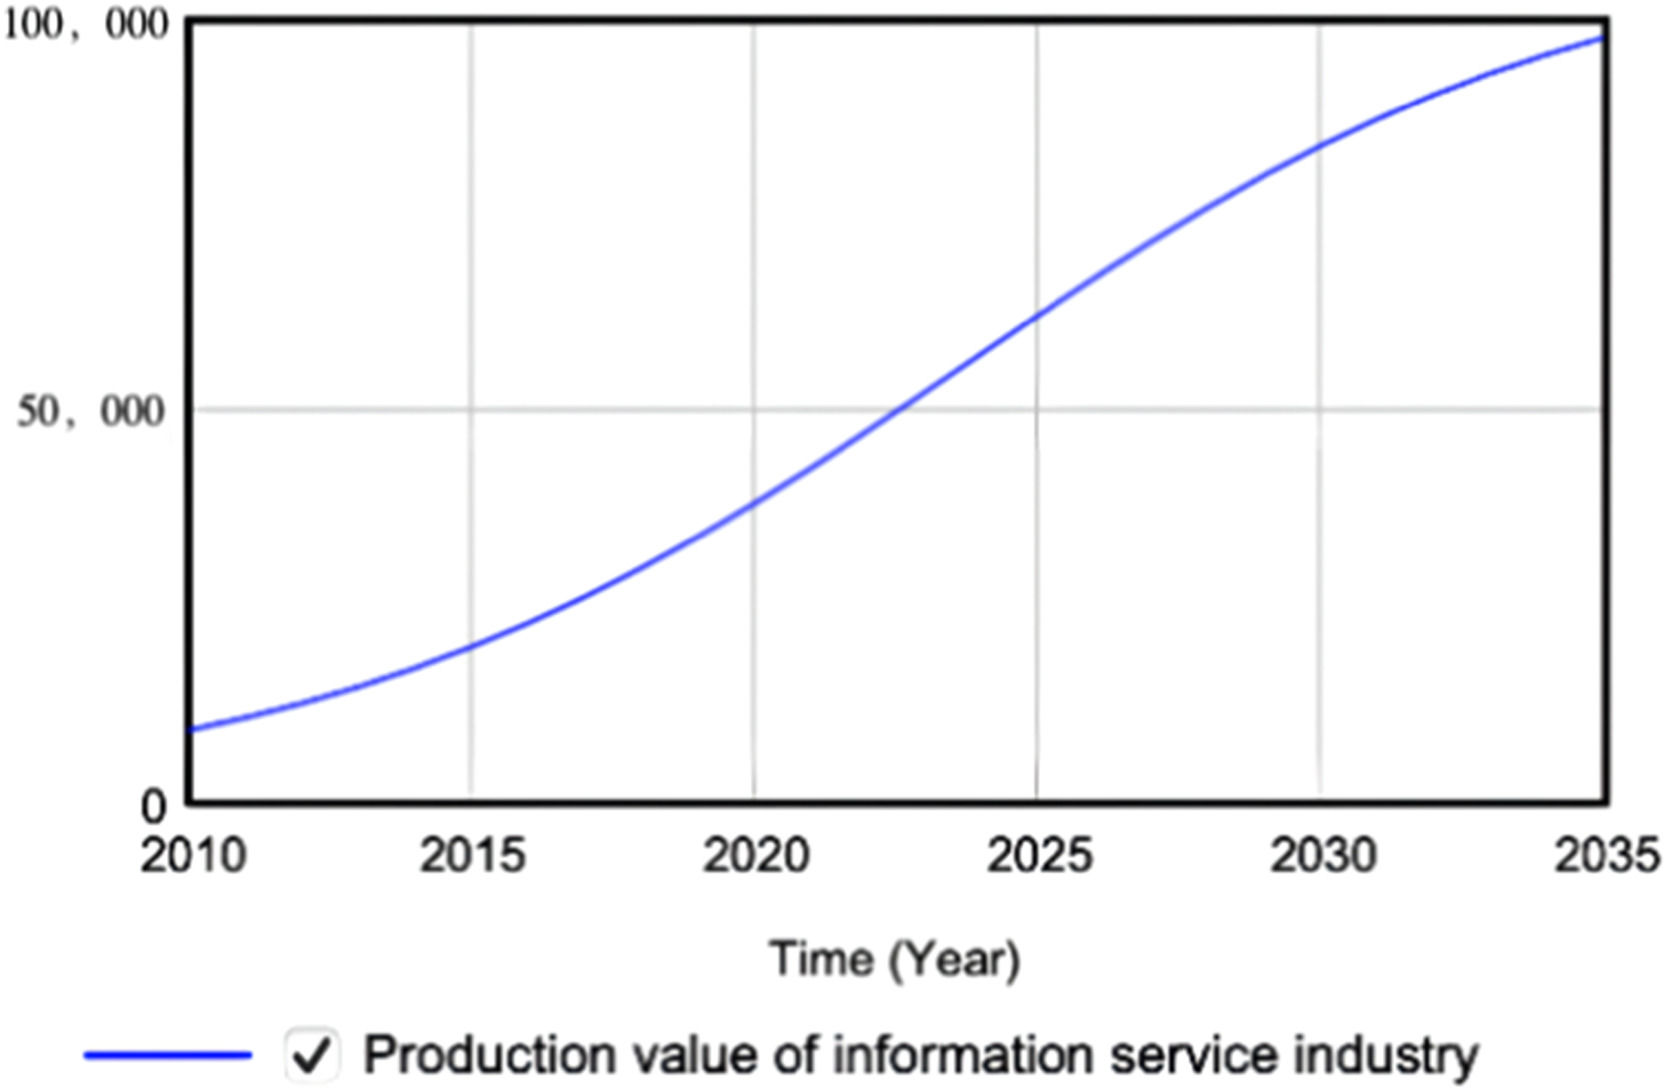
This section simulates the manufacturing and digital industries represented by the information service industry. Figs. 5. and 6. reveal that manufacturing output value and manufacturing innovation output increased simultaneously from the beginning to a gradual convergence in the later period. This demonstrates that the transformation and upgrading of industrial digitalization is gradually attained with digital empowerment, and high-quality development with innovative output as the main feature can be achieved. The rapid growth in the information service industry's output value from the initial stage to slow growth in the later period indicates that in the process of continuous integration with industry, the information service industry will gradually transition from increasing marginal returns to diminishing marginal returns, ultimately reaching the maximum of total social output. In this process, the information service industry will probably no longer function as the main pillar of high-quality manufacturing industry development.
Scenario simulation

The government has an indispensable influence on China's economic development and transformation. Therefore, this section explores the process by which the government's fiscal expenditure structure promotes innovative factor synergy to advance high-quality manufacturing industry development.
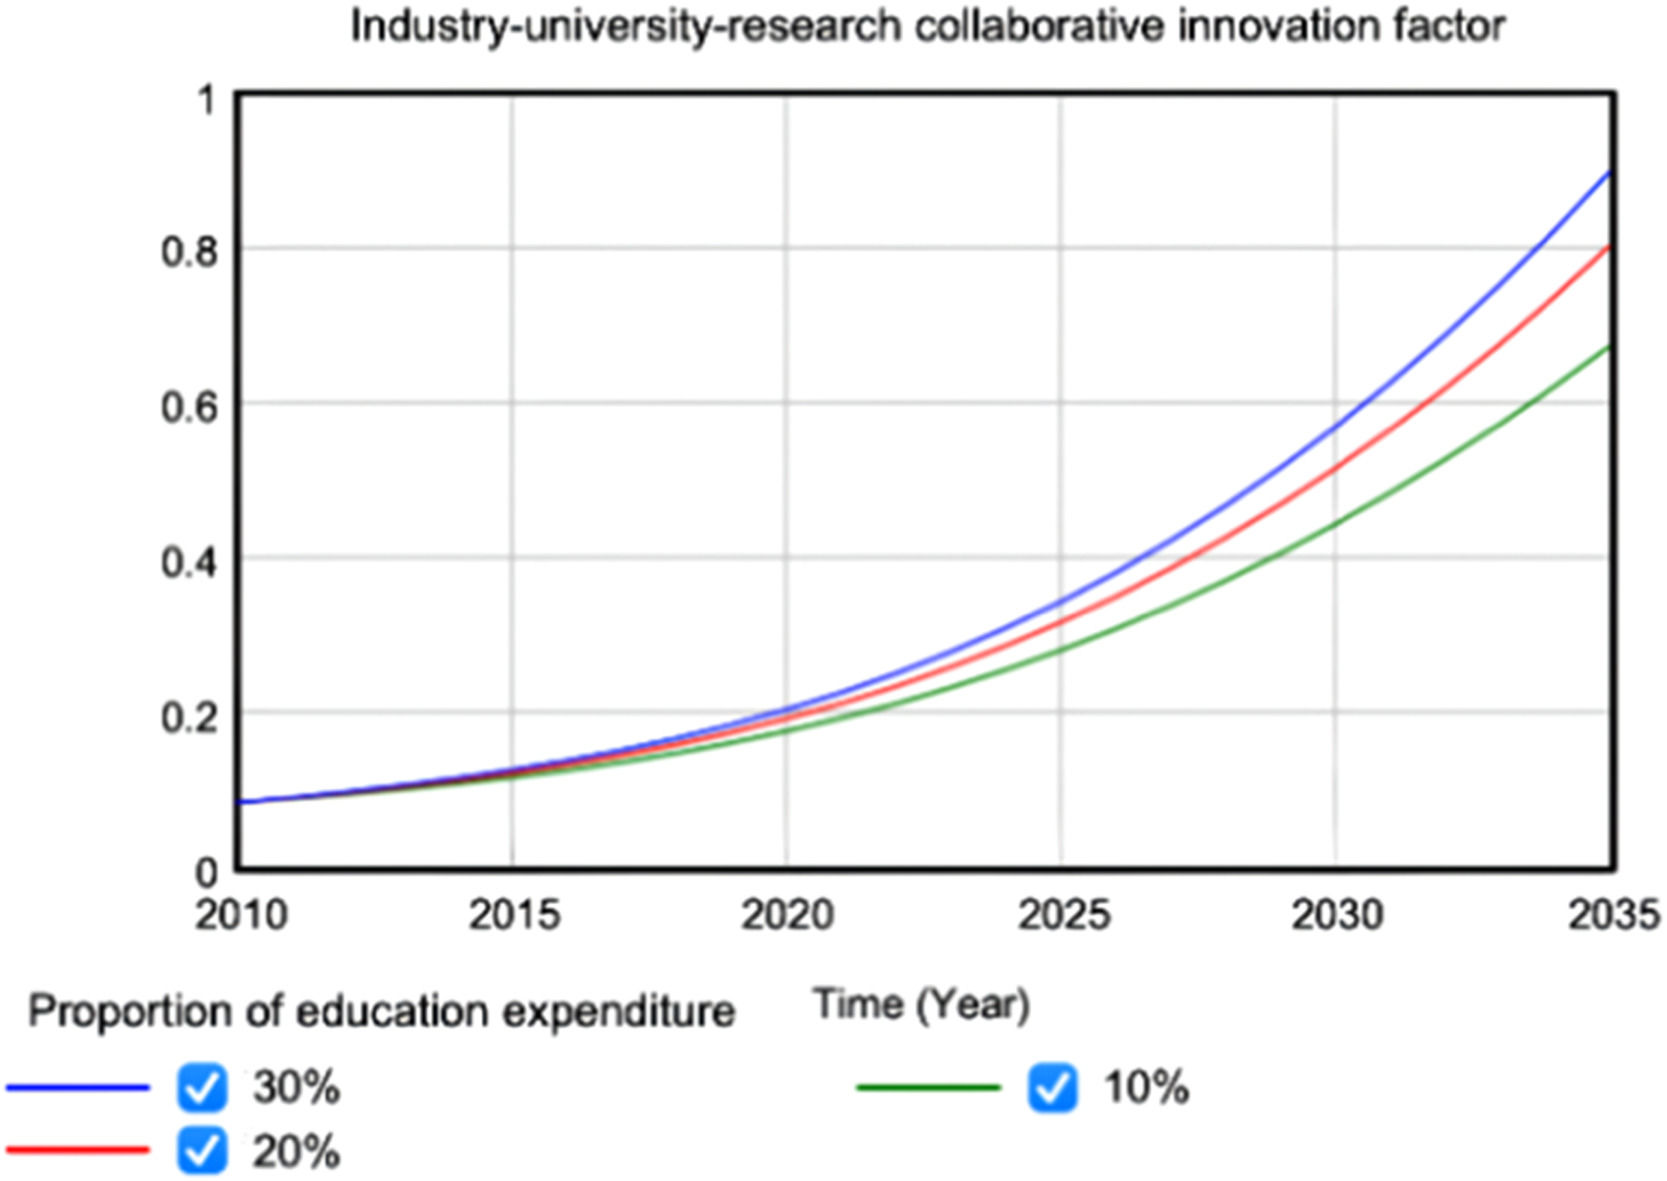
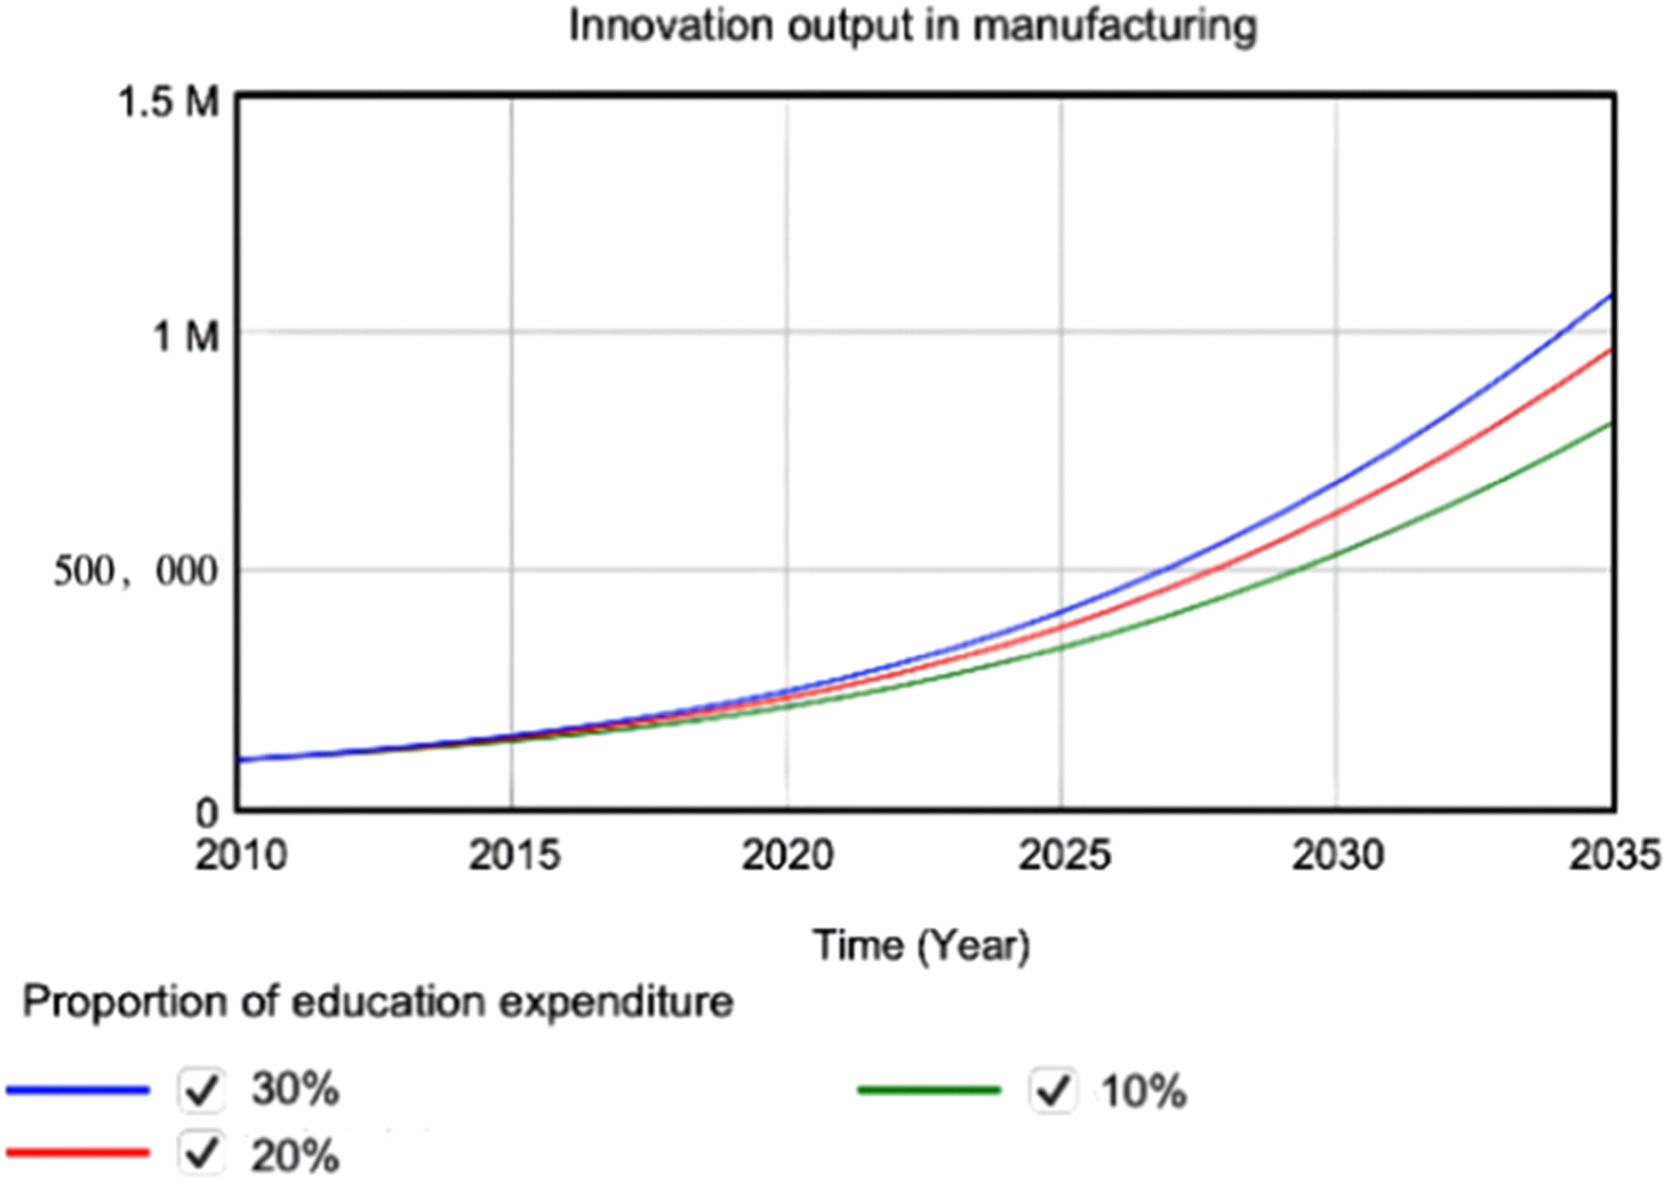
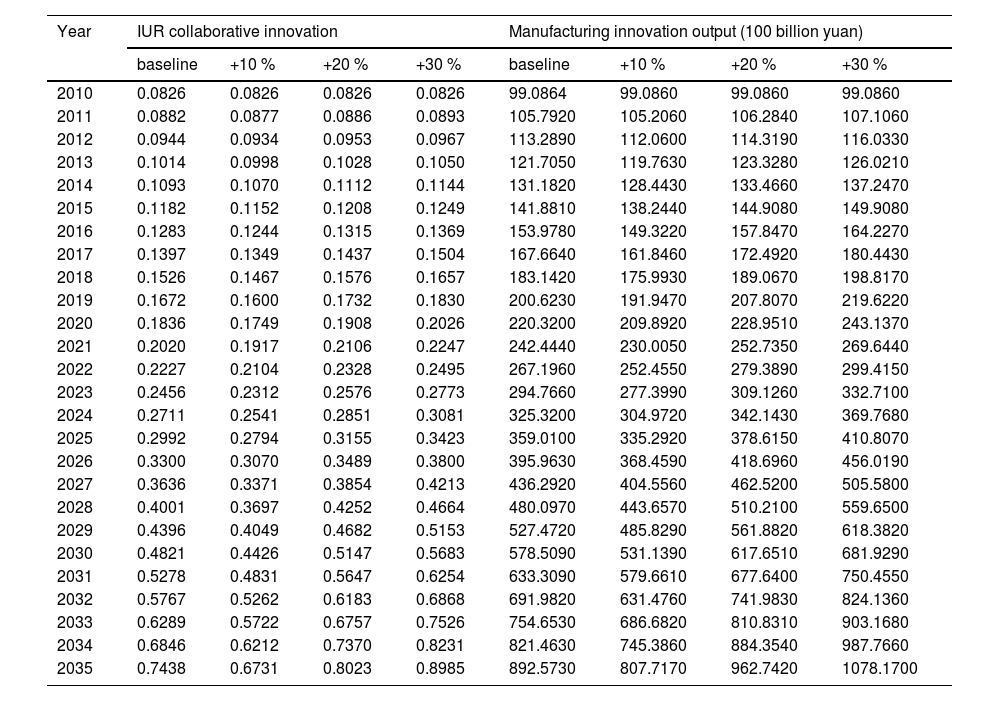
Education expenditureAssuming other conditions are unchanged, educational expenditure increases by 10 %, 20 %, and 30 % in the basic model. The simulation curves of industry–university–research collaborative innovation and manufacturing innovation output are presented in Figs. 7. and 8., and the dynamic simulation results are presented in Table 2.


System dynamics simulation results under different education expenditure.
| Year | IUR collaborative innovation | Manufacturing innovation output (100 billion yuan) | ||||||
|---|---|---|---|---|---|---|---|---|
| baseline | +10 % | +20 % | +30 % | baseline | +10 % | +20 % | +30 % | |
| 2010 | 0.0826 | 0.0826 | 0.0826 | 0.0826 | 99.0864 | 99.0860 | 99.0860 | 99.0860 |
| 2011 | 0.0882 | 0.0877 | 0.0886 | 0.0893 | 105.7920 | 105.2060 | 106.2840 | 107.1060 |
| 2012 | 0.0944 | 0.0934 | 0.0953 | 0.0967 | 113.2890 | 112.0600 | 114.3190 | 116.0330 |
| 2013 | 0.1014 | 0.0998 | 0.1028 | 0.1050 | 121.7050 | 119.7630 | 123.3280 | 126.0210 |
| 2014 | 0.1093 | 0.1070 | 0.1112 | 0.1144 | 131.1820 | 128.4430 | 133.4660 | 137.2470 |
| 2015 | 0.1182 | 0.1152 | 0.1208 | 0.1249 | 141.8810 | 138.2440 | 144.9080 | 149.9080 |
| 2016 | 0.1283 | 0.1244 | 0.1315 | 0.1369 | 153.9780 | 149.3220 | 157.8470 | 164.2270 |
| 2017 | 0.1397 | 0.1349 | 0.1437 | 0.1504 | 167.6640 | 161.8460 | 172.4920 | 180.4430 |
| 2018 | 0.1526 | 0.1467 | 0.1576 | 0.1657 | 183.1420 | 175.9930 | 189.0670 | 198.8170 |
| 2019 | 0.1672 | 0.1600 | 0.1732 | 0.1830 | 200.6230 | 191.9470 | 207.8070 | 219.6220 |
| 2020 | 0.1836 | 0.1749 | 0.1908 | 0.2026 | 220.3200 | 209.8920 | 228.9510 | 243.1370 |
| 2021 | 0.2020 | 0.1917 | 0.2106 | 0.2247 | 242.4440 | 230.0050 | 252.7350 | 269.6440 |
| 2022 | 0.2227 | 0.2104 | 0.2328 | 0.2495 | 267.1960 | 252.4550 | 279.3890 | 299.4150 |
| 2023 | 0.2456 | 0.2312 | 0.2576 | 0.2773 | 294.7660 | 277.3990 | 309.1260 | 332.7100 |
| 2024 | 0.2711 | 0.2541 | 0.2851 | 0.3081 | 325.3200 | 304.9720 | 342.1430 | 369.7680 |
| 2025 | 0.2992 | 0.2794 | 0.3155 | 0.3423 | 359.0100 | 335.2920 | 378.6150 | 410.8070 |
| 2026 | 0.3300 | 0.3070 | 0.3489 | 0.3800 | 395.9630 | 368.4590 | 418.6960 | 456.0190 |
| 2027 | 0.3636 | 0.3371 | 0.3854 | 0.4213 | 436.2920 | 404.5560 | 462.5200 | 505.5800 |
| 2028 | 0.4001 | 0.3697 | 0.4252 | 0.4664 | 480.0970 | 443.6570 | 510.2100 | 559.6500 |
| 2029 | 0.4396 | 0.4049 | 0.4682 | 0.5153 | 527.4720 | 485.8290 | 561.8820 | 618.3820 |
| 2030 | 0.4821 | 0.4426 | 0.5147 | 0.5683 | 578.5090 | 531.1390 | 617.6510 | 681.9290 |
| 2031 | 0.5278 | 0.4831 | 0.5647 | 0.6254 | 633.3090 | 579.6610 | 677.6400 | 750.4550 |
| 2032 | 0.5767 | 0.5262 | 0.6183 | 0.6868 | 691.9820 | 631.4760 | 741.9830 | 824.1360 |
| 2033 | 0.6289 | 0.5722 | 0.6757 | 0.7526 | 754.6530 | 686.6820 | 810.8310 | 903.1680 |
| 2034 | 0.6846 | 0.6212 | 0.7370 | 0.8231 | 821.4630 | 745.3860 | 884.3540 | 987.7660 |
| 2035 | 0.7438 | 0.6731 | 0.8023 | 0.8985 | 892.5730 | 807.7170 | 962.7420 | 1078.1700 |
The results indicate that education funding input in the next 15 years will not always have a steady and positive promotional effect on IUR collaborative innovation and manufacturing innovation output. It depends on the growth of education expenditure.
As is shown in the simulation data, from 2010 to 2035, when education expenditure is increased by 10 %, collaborative innovation exhibits a downward trend, decreasing from the baseline of 0.7438 to 0.6731 in 2035, representing rate of 9.51 % and an average decrease rate of 5.58 %. Compared with the baseline, manufacturing innovation output also exhibits a downward trend, decreasing from 892.573 to 807.717 in 2035, at rate of 9.51 % and an average decrease rate of 5.37 %.
In contrast, when education expenditure rises by 20 %, collaborative innovation exhibits an upward trend compared with the baseline. In 2035, collaborative innovation will increase from the baseline of 0.7438 to 0.8023, with an increase rate of 7.87 % and an average increase rate of 4.45 %. When manufacturing innovation output increases by 20 %, it also exhibits a growth trend, rising from the baseline of 892.573 to 962.742 in 2035, with an increase rate of 7.86 % and an average increase rate of 4.44 %.
Finally, when education expenditure increases by 30 %, collaborative innovation and manufacturing innovation output exhibit a more rapid rising trend. Collaborative innovation will rise from the baseline of 0.7438 to 0.8985 in 2035, representing an increase of 20.80 % and the average increase is 11.75 %. Manufacturing innovation output will rise from 892.573 to 1078.170 in 2035, with an increase of 20.79 % and an average increase of 11.75 %.
In summary, An increase of more than 20 % in education expenditure will have a steady and positive promotional effect on collaborative innovation and manufacturing innovation output, and increased education expenditure intensifies the positive promotional effect that exhibits a marginal decreasing trend.
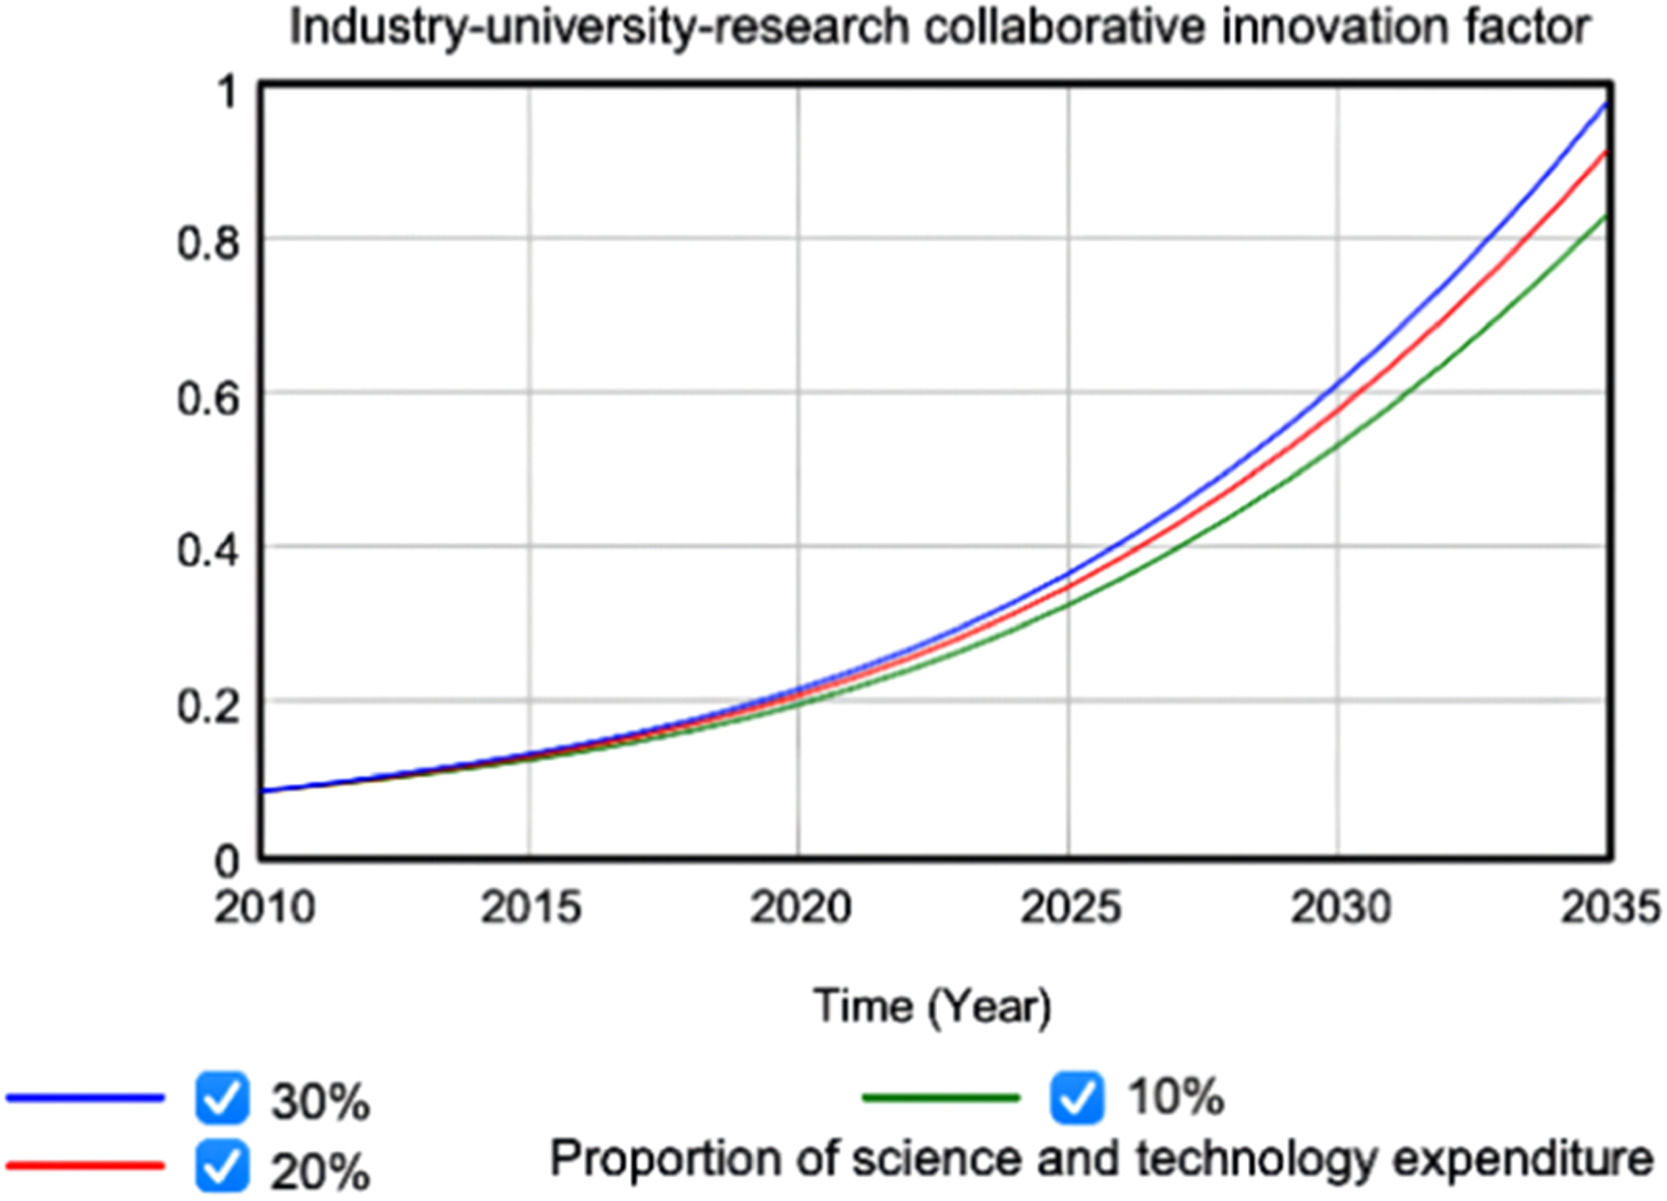
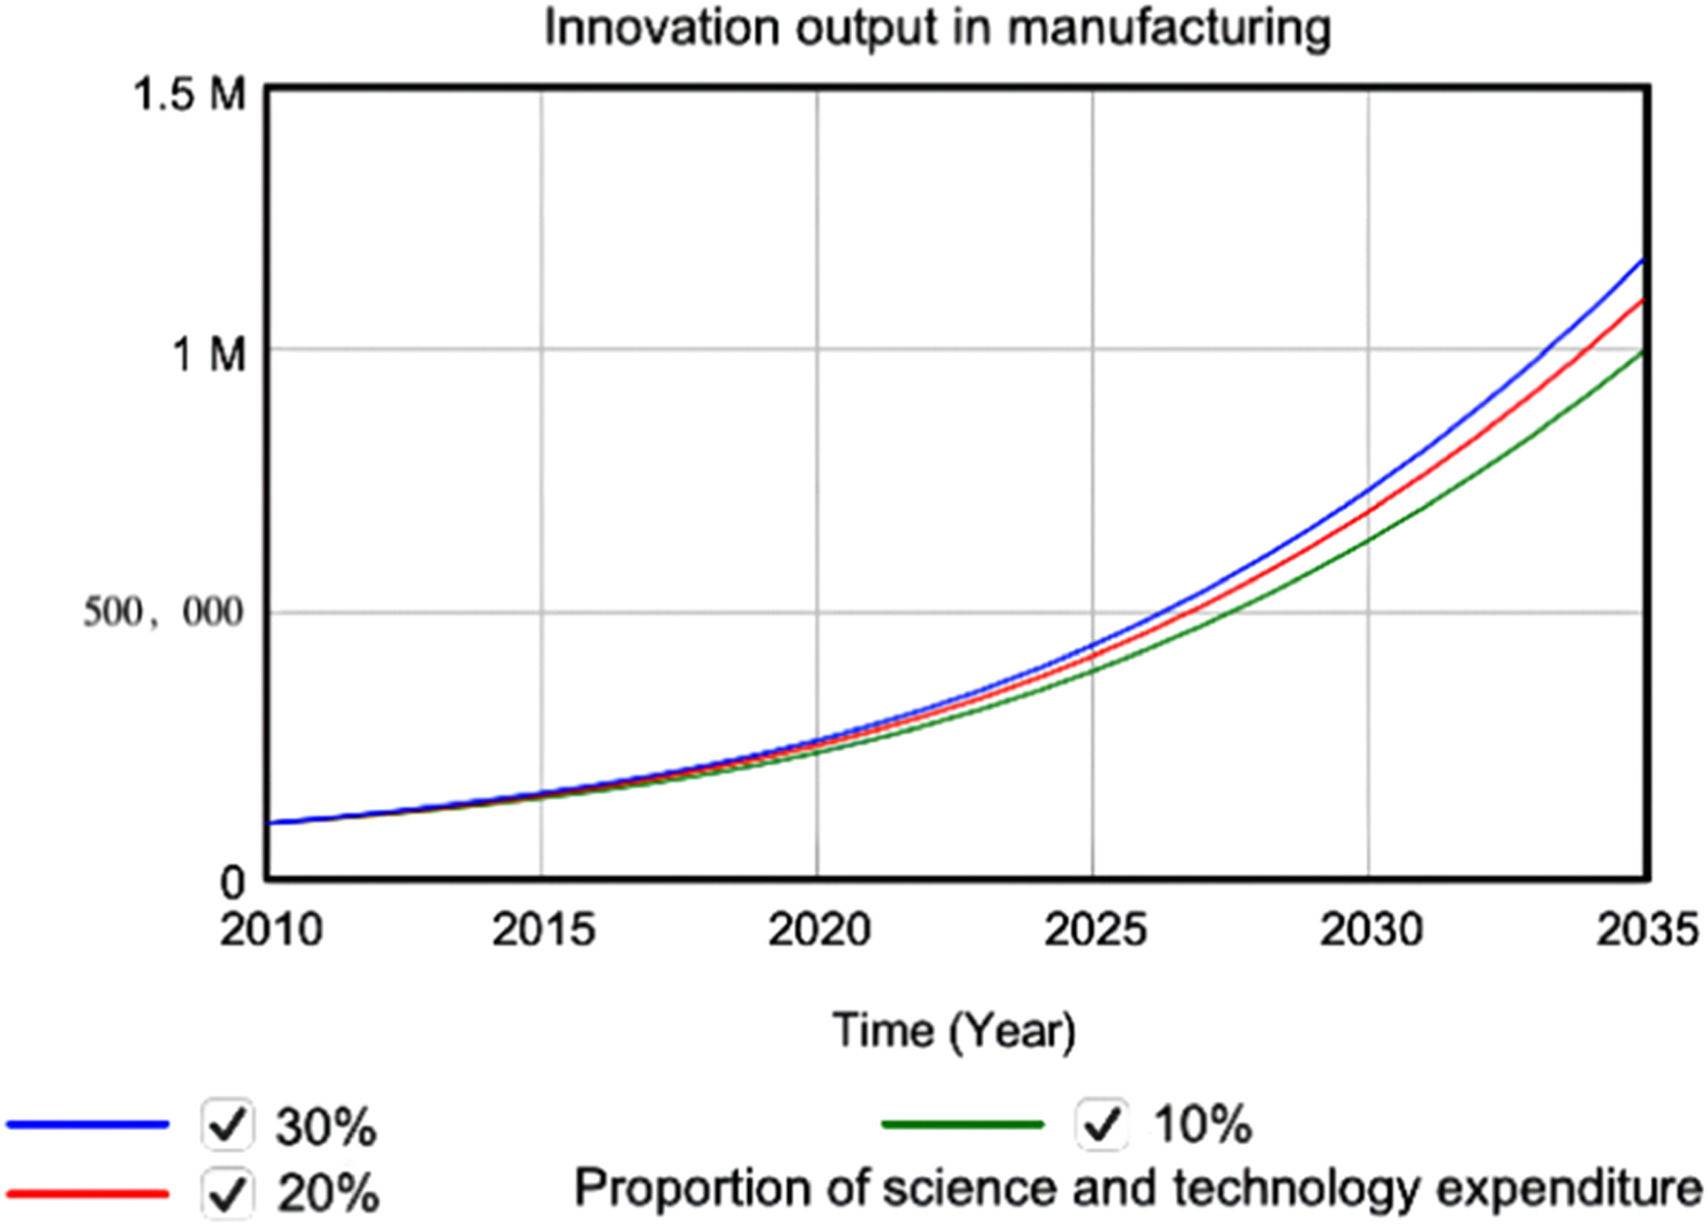
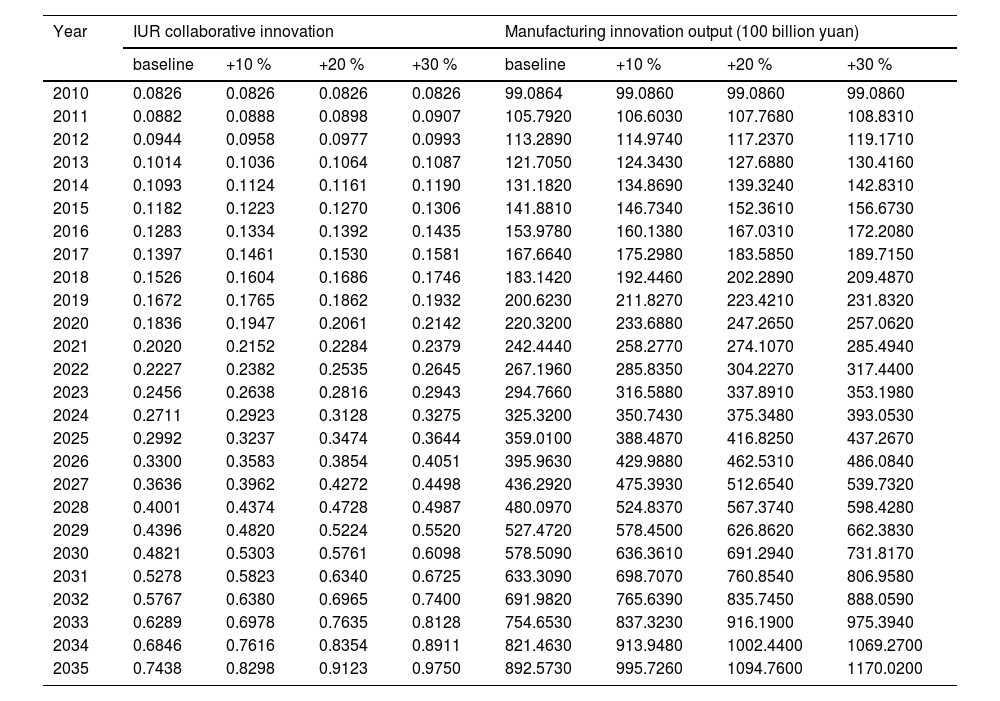
Science and technology expenditureAssuming other variables are unchanged, scientific and technological expenditure increases, by 10 %, 20 % and 30 %, respectively, the simulation curves of industry–university–research collaborative innovation and manufacturing innovation output are shown in Figs. 9. and 10., and the dynamic simulation results are presented in Table 3.


System dynamics simulation results under different science and technology expenditure.
| Year | IUR collaborative innovation | Manufacturing innovation output (100 billion yuan) | ||||||
|---|---|---|---|---|---|---|---|---|
| baseline | +10 % | +20 % | +30 % | baseline | +10 % | +20 % | +30 % | |
| 2010 | 0.0826 | 0.0826 | 0.0826 | 0.0826 | 99.0864 | 99.0860 | 99.0860 | 99.0860 |
| 2011 | 0.0882 | 0.0888 | 0.0898 | 0.0907 | 105.7920 | 106.6030 | 107.7680 | 108.8310 |
| 2012 | 0.0944 | 0.0958 | 0.0977 | 0.0993 | 113.2890 | 114.9740 | 117.2370 | 119.1710 |
| 2013 | 0.1014 | 0.1036 | 0.1064 | 0.1087 | 121.7050 | 124.3430 | 127.6880 | 130.4160 |
| 2014 | 0.1093 | 0.1124 | 0.1161 | 0.1190 | 131.1820 | 134.8690 | 139.3240 | 142.8310 |
| 2015 | 0.1182 | 0.1223 | 0.1270 | 0.1306 | 141.8810 | 146.7340 | 152.3610 | 156.6730 |
| 2016 | 0.1283 | 0.1334 | 0.1392 | 0.1435 | 153.9780 | 160.1380 | 167.0310 | 172.2080 |
| 2017 | 0.1397 | 0.1461 | 0.1530 | 0.1581 | 167.6640 | 175.2980 | 183.5850 | 189.7150 |
| 2018 | 0.1526 | 0.1604 | 0.1686 | 0.1746 | 183.1420 | 192.4460 | 202.2890 | 209.4870 |
| 2019 | 0.1672 | 0.1765 | 0.1862 | 0.1932 | 200.6230 | 211.8270 | 223.4210 | 231.8320 |
| 2020 | 0.1836 | 0.1947 | 0.2061 | 0.2142 | 220.3200 | 233.6880 | 247.2650 | 257.0620 |
| 2021 | 0.2020 | 0.2152 | 0.2284 | 0.2379 | 242.4440 | 258.2770 | 274.1070 | 285.4940 |
| 2022 | 0.2227 | 0.2382 | 0.2535 | 0.2645 | 267.1960 | 285.8350 | 304.2270 | 317.4400 |
| 2023 | 0.2456 | 0.2638 | 0.2816 | 0.2943 | 294.7660 | 316.5880 | 337.8910 | 353.1980 |
| 2024 | 0.2711 | 0.2923 | 0.3128 | 0.3275 | 325.3200 | 350.7430 | 375.3480 | 393.0530 |
| 2025 | 0.2992 | 0.3237 | 0.3474 | 0.3644 | 359.0100 | 388.4870 | 416.8250 | 437.2670 |
| 2026 | 0.3300 | 0.3583 | 0.3854 | 0.4051 | 395.9630 | 429.9880 | 462.5310 | 486.0840 |
| 2027 | 0.3636 | 0.3962 | 0.4272 | 0.4498 | 436.2920 | 475.3930 | 512.6540 | 539.7320 |
| 2028 | 0.4001 | 0.4374 | 0.4728 | 0.4987 | 480.0970 | 524.8370 | 567.3740 | 598.4280 |
| 2029 | 0.4396 | 0.4820 | 0.5224 | 0.5520 | 527.4720 | 578.4500 | 626.8620 | 662.3830 |
| 2030 | 0.4821 | 0.5303 | 0.5761 | 0.6098 | 578.5090 | 636.3610 | 691.2940 | 731.8170 |
| 2031 | 0.5278 | 0.5823 | 0.6340 | 0.6725 | 633.3090 | 698.7070 | 760.8540 | 806.9580 |
| 2032 | 0.5767 | 0.6380 | 0.6965 | 0.7400 | 691.9820 | 765.6390 | 835.7450 | 888.0590 |
| 2033 | 0.6289 | 0.6978 | 0.7635 | 0.8128 | 754.6530 | 837.3230 | 916.1900 | 975.3940 |
| 2034 | 0.6846 | 0.7616 | 0.8354 | 0.8911 | 821.4630 | 913.9480 | 1002.4400 | 1069.2700 |
| 2035 | 0.7438 | 0.8298 | 0.9123 | 0.9750 | 892.5730 | 995.7260 | 1094.7600 | 1170.0200 |
The results reveal that science and technology expenditure has a significant positive effect on industry–university–research collaborative innovation and manufacturing innovation output in the next 15 years. With the increase of science and technology expenditure, the positive effect also increases.
Compared with the simulation data in the model from 2010 to 2035, when science and technology expenditure increases by 10 %, collaborative innovation exhibits an upward trend, rising from the baseline of 0.7438 to 0.8298 in 2035, with an increase rate of 11.56 % and an average increase rate of 6.69 %. Manufacturing innovation output also exhibits an upward trend, from the baseline of 892.573 to 995.726 in 2035, with an increase rate of 11.56 % and an average increase rate of 6.70 %.
When science and technology expenditure increases by 20 %, collaborative innovation exhibits an upward trend. In 2035, collaborative innovation will increase from the baseline of 0.7438 to 0.9123, with an increase rate of 22.65 % and an average increase rate of 13.34 %. Manufacturing innovation also exhibits a growth trend, increasing from the baseline of 892.573 to 1094.760, with an increase rate of 22.65 % and an average increase rate of 13.34 %.
When science and technology expenditure increases by 30 %, collaborative innovation and manufacturing innovation output exhibit a more rapid rising trend, and collaborative innovation will increase from the baseline of 0.7438 to 0.9750 in 2035, with an increase rate of 31.08 % and an average increase is 18.25 %. Manufacturing innovation output will rise from 892.573 to 1170.020 in 2035, with an increase rate of 31.08 % and an average increase rate of 18.25 %.
In summary, science and technology expenditure has a significant positive effect on collaborative and manufacturing innovation output over time. With a continuous increase in expenditure, the positive effect also rises, and the promotional effect exhibits a marginal decreasing trend.
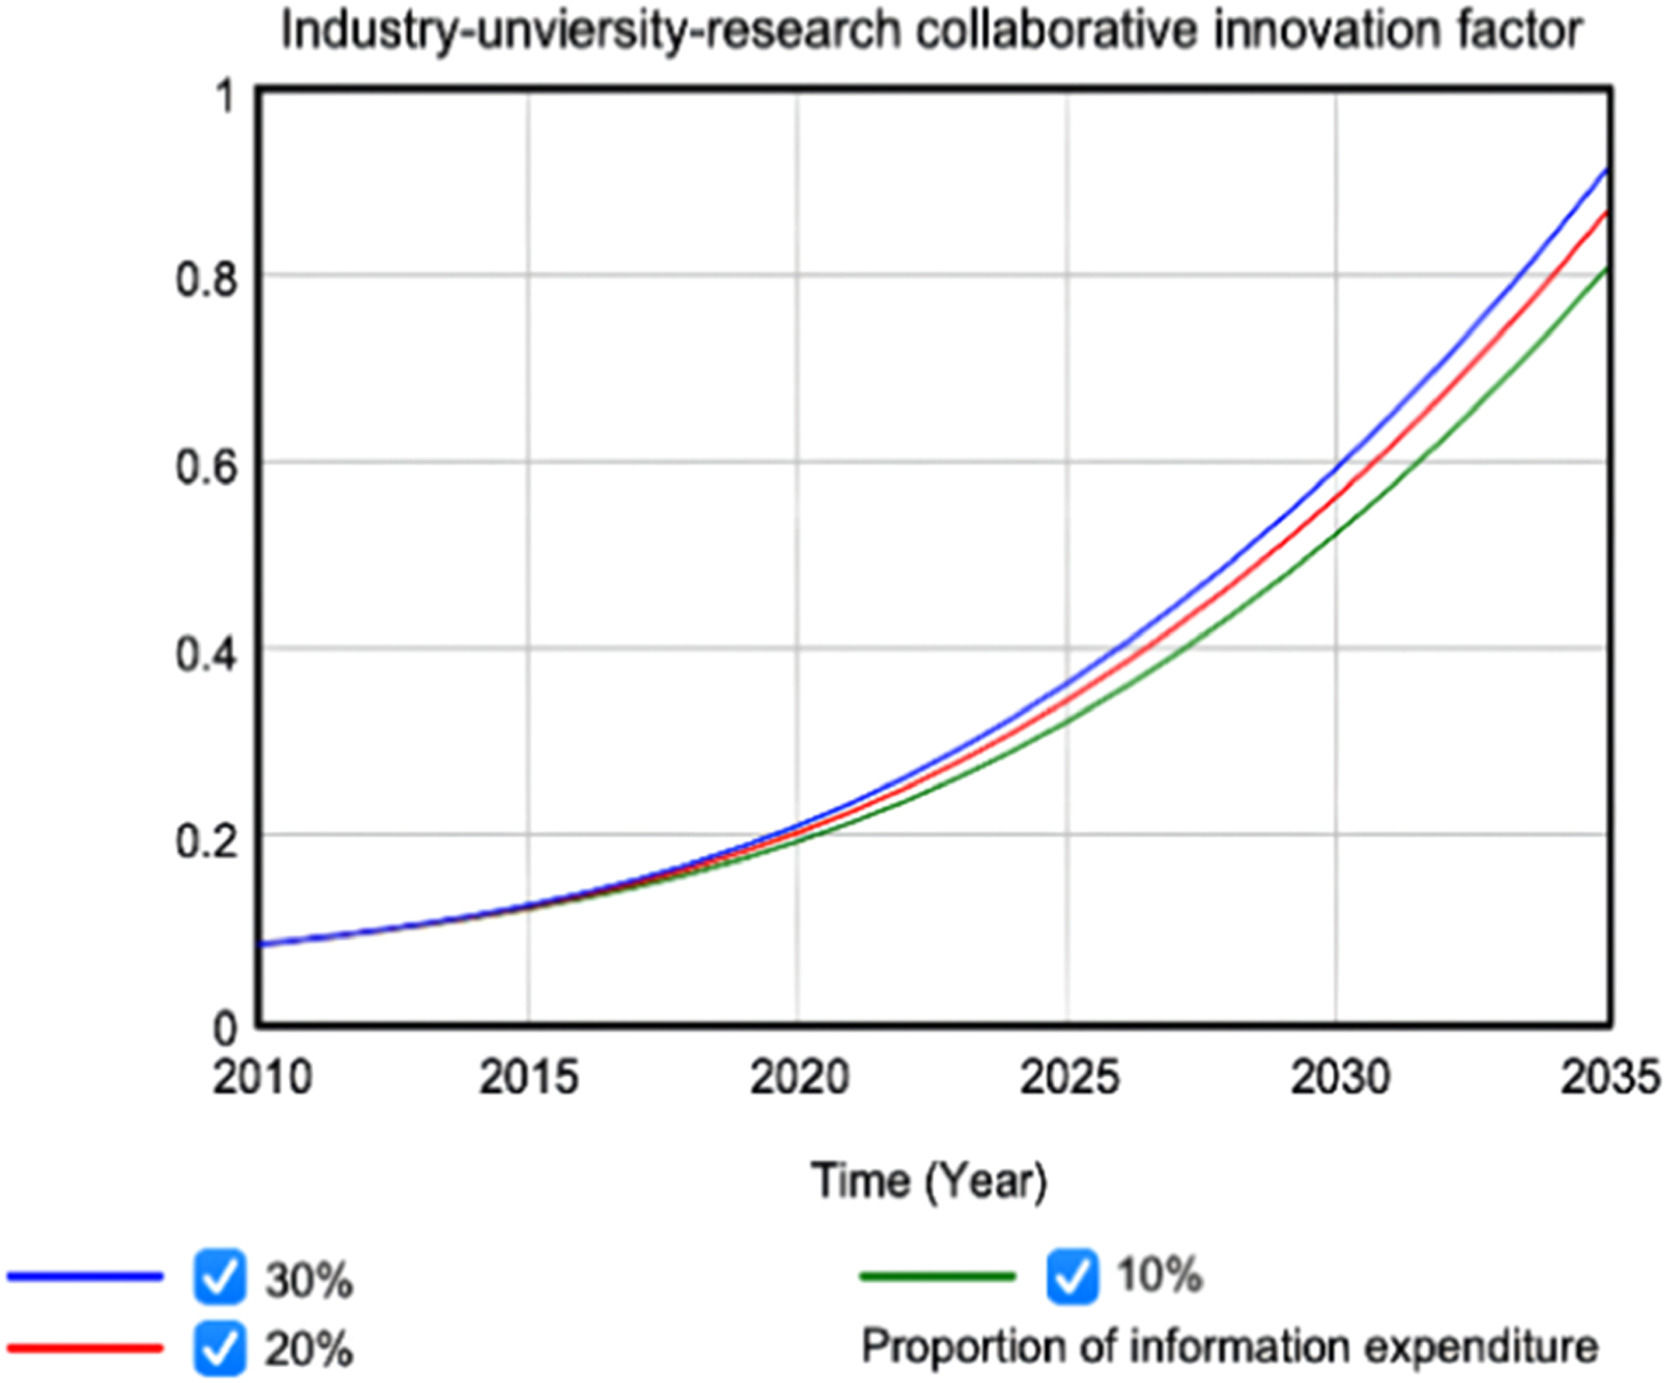
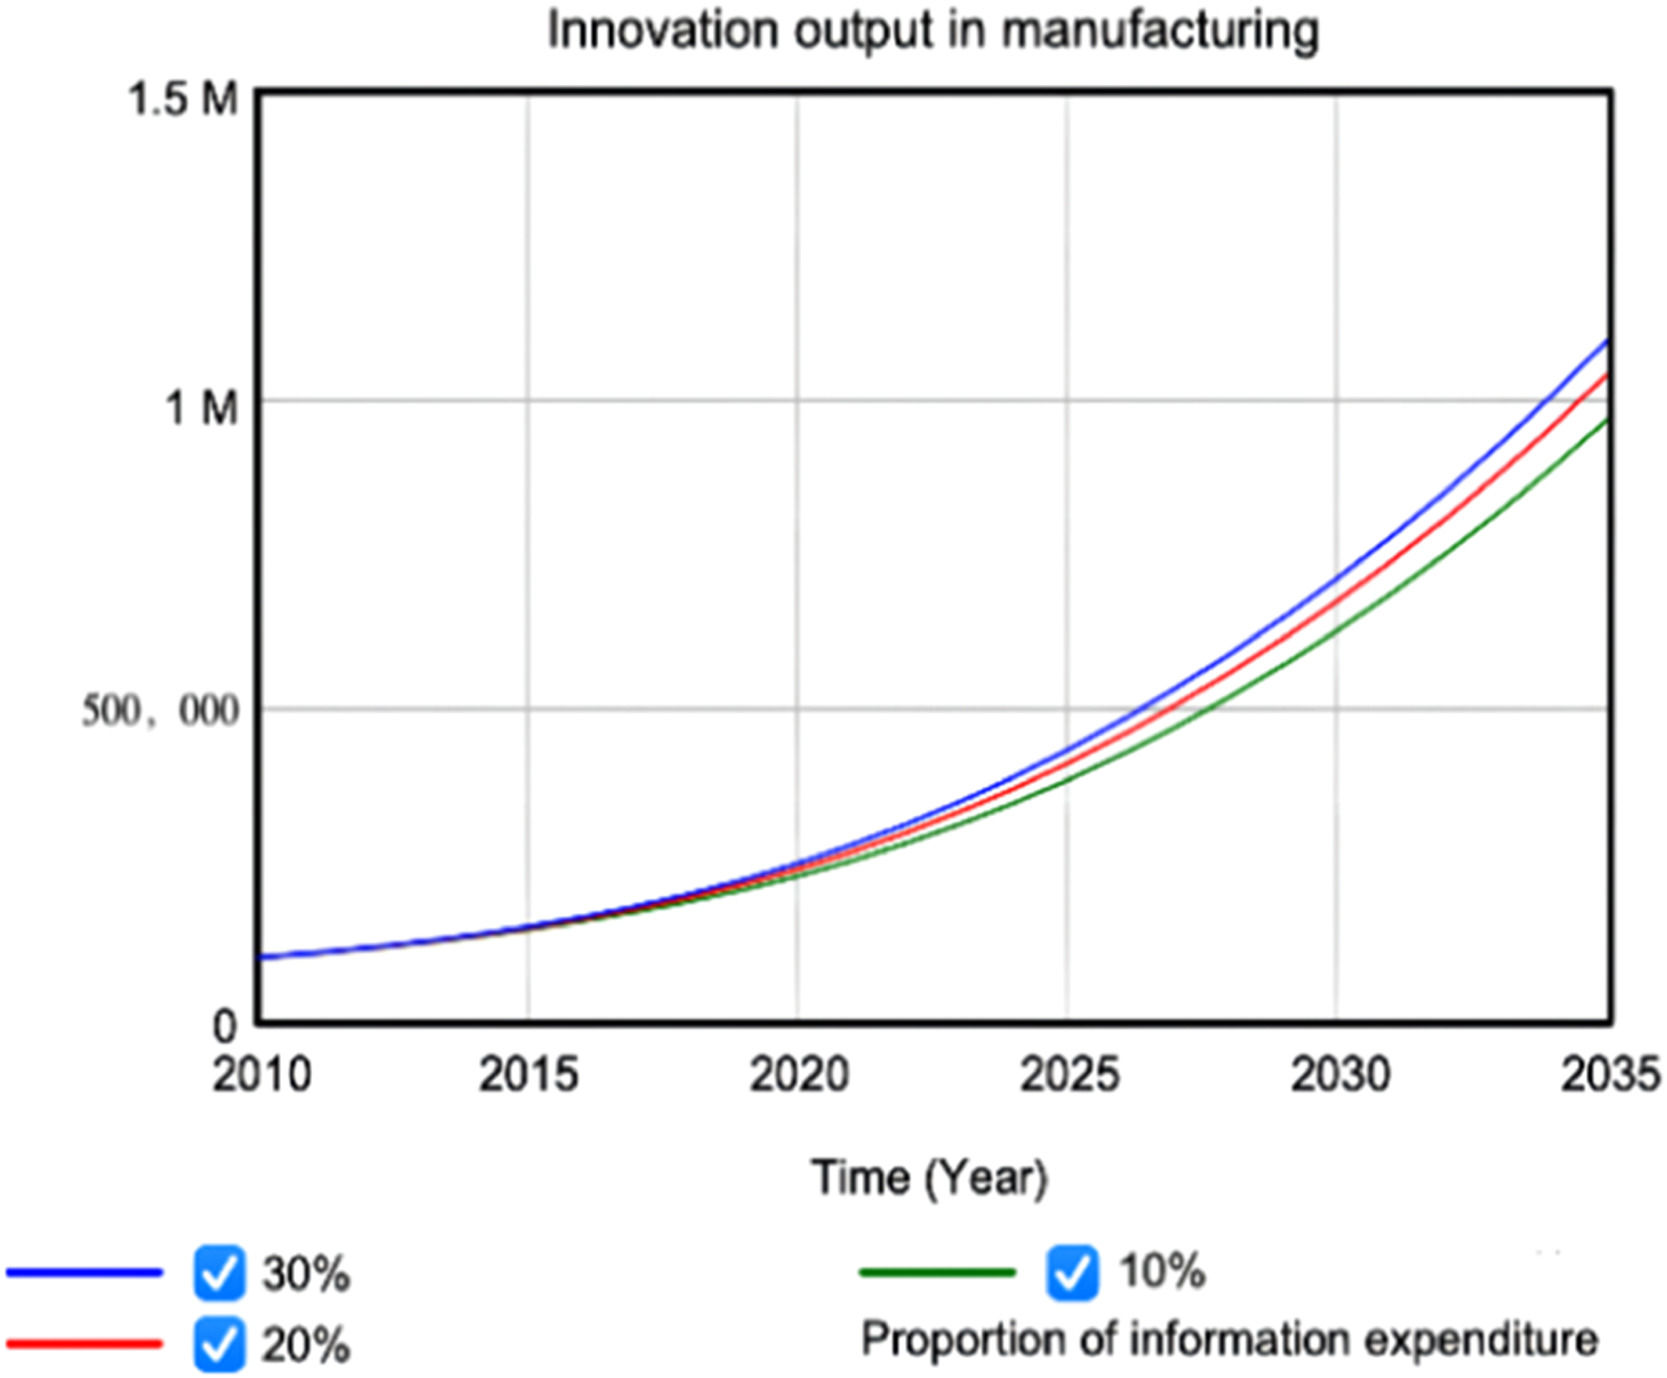
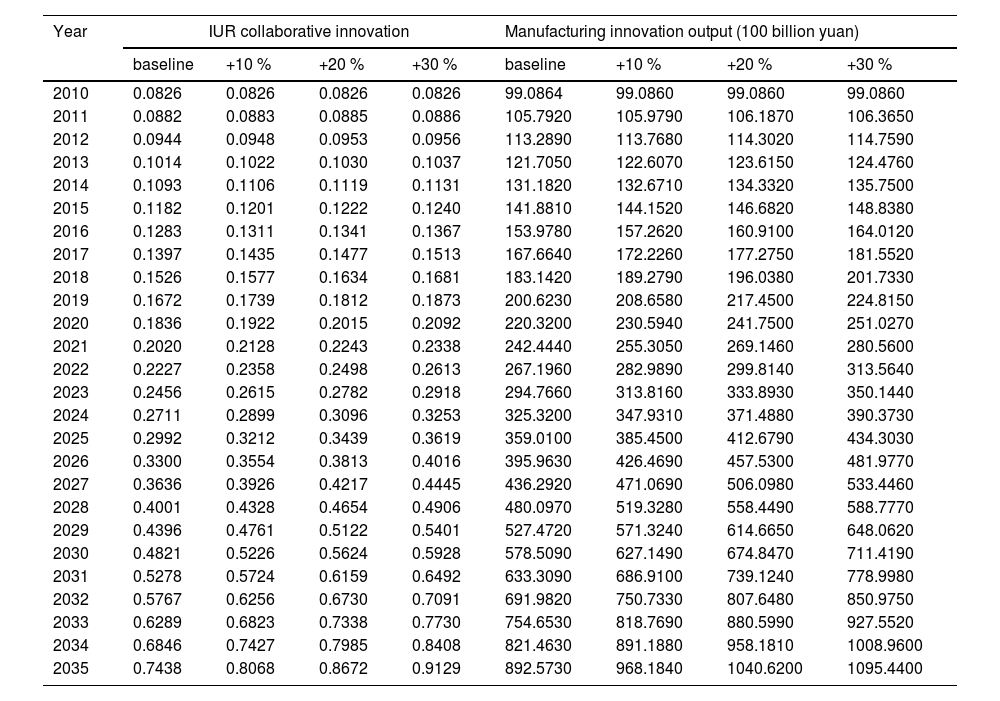
Information infrastructure expenditureAssuming other variables remain unchanged, information infrastructure expenditure increases by 10 %, 20 %, and 30 %. The simulation curves of industry–university–research collaborative innovation and manufacturing innovation output are shown in Figs. 11. and 12, and the dynamic simulation results are presented in Table 4.


System dynamics simulation results under different information infrastructure expenditure.
| Year | IUR collaborative innovation | Manufacturing innovation output (100 billion yuan) | ||||||
|---|---|---|---|---|---|---|---|---|
| baseline | +10 % | +20 % | +30 % | baseline | +10 % | +20 % | +30 % | |
| 2010 | 0.0826 | 0.0826 | 0.0826 | 0.0826 | 99.0864 | 99.0860 | 99.0860 | 99.0860 |
| 2011 | 0.0882 | 0.0883 | 0.0885 | 0.0886 | 105.7920 | 105.9790 | 106.1870 | 106.3650 |
| 2012 | 0.0944 | 0.0948 | 0.0953 | 0.0956 | 113.2890 | 113.7680 | 114.3020 | 114.7590 |
| 2013 | 0.1014 | 0.1022 | 0.1030 | 0.1037 | 121.7050 | 122.6070 | 123.6150 | 124.4760 |
| 2014 | 0.1093 | 0.1106 | 0.1119 | 0.1131 | 131.1820 | 132.6710 | 134.3320 | 135.7500 |
| 2015 | 0.1182 | 0.1201 | 0.1222 | 0.1240 | 141.8810 | 144.1520 | 146.6820 | 148.8380 |
| 2016 | 0.1283 | 0.1311 | 0.1341 | 0.1367 | 153.9780 | 157.2620 | 160.9100 | 164.0120 |
| 2017 | 0.1397 | 0.1435 | 0.1477 | 0.1513 | 167.6640 | 172.2260 | 177.2750 | 181.5520 |
| 2018 | 0.1526 | 0.1577 | 0.1634 | 0.1681 | 183.1420 | 189.2790 | 196.0380 | 201.7330 |
| 2019 | 0.1672 | 0.1739 | 0.1812 | 0.1873 | 200.6230 | 208.6580 | 217.4500 | 224.8150 |
| 2020 | 0.1836 | 0.1922 | 0.2015 | 0.2092 | 220.3200 | 230.5940 | 241.7500 | 251.0270 |
| 2021 | 0.2020 | 0.2128 | 0.2243 | 0.2338 | 242.4440 | 255.3050 | 269.1460 | 280.5600 |
| 2022 | 0.2227 | 0.2358 | 0.2498 | 0.2613 | 267.1960 | 282.9890 | 299.8140 | 313.5640 |
| 2023 | 0.2456 | 0.2615 | 0.2782 | 0.2918 | 294.7660 | 313.8160 | 333.8930 | 350.1440 |
| 2024 | 0.2711 | 0.2899 | 0.3096 | 0.3253 | 325.3200 | 347.9310 | 371.4880 | 390.3730 |
| 2025 | 0.2992 | 0.3212 | 0.3439 | 0.3619 | 359.0100 | 385.4500 | 412.6790 | 434.3030 |
| 2026 | 0.3300 | 0.3554 | 0.3813 | 0.4016 | 395.9630 | 426.4690 | 457.5300 | 481.9770 |
| 2027 | 0.3636 | 0.3926 | 0.4217 | 0.4445 | 436.2920 | 471.0690 | 506.0980 | 533.4460 |
| 2028 | 0.4001 | 0.4328 | 0.4654 | 0.4906 | 480.0970 | 519.3280 | 558.4490 | 588.7770 |
| 2029 | 0.4396 | 0.4761 | 0.5122 | 0.5401 | 527.4720 | 571.3240 | 614.6650 | 648.0620 |
| 2030 | 0.4821 | 0.5226 | 0.5624 | 0.5928 | 578.5090 | 627.1490 | 674.8470 | 711.4190 |
| 2031 | 0.5278 | 0.5724 | 0.6159 | 0.6492 | 633.3090 | 686.9100 | 739.1240 | 778.9980 |
| 2032 | 0.5767 | 0.6256 | 0.6730 | 0.7091 | 691.9820 | 750.7330 | 807.6480 | 850.9750 |
| 2033 | 0.6289 | 0.6823 | 0.7338 | 0.7730 | 754.6530 | 818.7690 | 880.5990 | 927.5520 |
| 2034 | 0.6846 | 0.7427 | 0.7985 | 0.8408 | 821.4630 | 891.1880 | 958.1810 | 1008.9600 |
| 2035 | 0.7438 | 0.8068 | 0.8672 | 0.9129 | 892.5730 | 968.1840 | 1040.6200 | 1095.4400 |
The results reveal that information infrastructure expenditure has a positive effect on the industry–university–research collaborative innovation and manufacturing innovation output in the next 15 years. This positive effect also increases with increased expenditure.
Compared with the simulation data in the model from 2010 to 2035, when information expenditure increases by 10 %, collaborative innovation exhibits an upward trend, rising by 8.47 % from the baseline of 0.7438 to 0.8068 in 2035, with an average increase rate of 5.23 %. Manufacturing innovation output also exhibits an upward trend, from a baseline of 892.573 to 968.184 in 2035, with an increase of 8.47 % and an average increase of 5.23 %.
When information infrastructure expenditure increases by 20 %, collaborative innovation exhibits an upward trend. By 2035, collaborative innovation will increase from a baseline of 0.7438 to 0.8672, with an increase rate of 16.59 % and an average increase rate of 10.54 %. Manufacturing innovation output also exhibits a growth trend, increasing from a baseline of 892.573 to 1040.620, with an increase rate of 16.59 % and an average increase rate of 10.54 %.
When information infrastructure expenditure increases by 30 %, collaborative innovation and manufacturing innovation output have a more rapid rising trend, and collaborative innovation increases from a baseline of 0.7438 to 0.9129 in 2035, representing a 22.73 % increase, and the average increase is 14.73 %. Manufacturing innovation output increases from 892.573 to 1095.440 in 2035, with an increase rate of 22.73 % and an average increase rate of 14.74 %.
In summary, information infrastructure expenditure has a significant positive promotional effect on collaborative innovation and manufacturing innovation output, and this positive effect also increases with continuous improvement of information infrastructure expenditure.
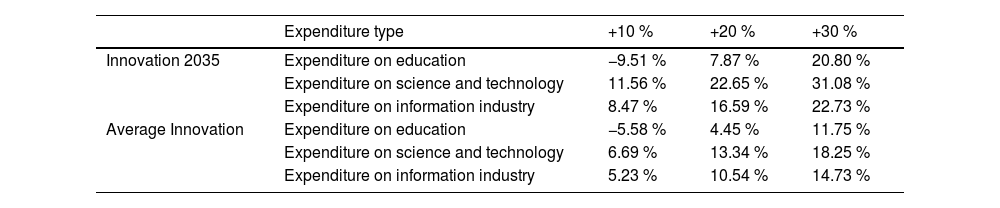
Comparison of three scenariosThe innovation in Table 5 represent collaborative innovation and manufacturing innovation output in the process of manufacturing industry high-quality development. The comparison indicates that the promotional effect of science and technology expenditure is stronger, followed by information infrastructure.
Innovation under different scenarios.
| Expenditure type | +10 % | +20 % | +30 % | |
|---|---|---|---|---|
| Innovation 2035 | Expenditure on education | −9.51 % | 7.87 % | 20.80 % |
| Expenditure on science and technology | 11.56 % | 22.65 % | 31.08 % | |
| Expenditure on information industry | 8.47 % | 16.59 % | 22.73 % | |
| Average Innovation | Expenditure on education | −5.58 % | 4.45 % | 11.75 % |
| Expenditure on science and technology | 6.69 % | 13.34 % | 18.25 % | |
| Expenditure on information industry | 5.23 % | 10.54 % | 14.73 % |
As shown above, education expenditure must reach a certain scale to have a positive promotional effect, and the effect is weaker than that of science technology and information infrastructure expenditure, whereas science technology expenditure can quickly improve innovation performance over time. Information infrastructure expenditure comes second for collaborative innovation and manufacturing innovation output, and education expenditure has relatively minimal improvement effects. The effect of education expenditure significantly improves as the scale of expenditure increases, exhibiting obvious diminishing marginal characteristics, followed by science and technology expenditure, whereas the diminishing marginal characteristics of information infrastructure expenditure are not obvious. When education expenditure increases by 30 %, its driving force for innovation is significantly stronger than science technology and information infrastructure expenditure. In the era of digital empowerment, talent is the most crucial element of innovation, improvement in social capital generated by education expenditure cannot be ignored (Al Omoush et al., 2022).
Conclusion and implicationsWe construct an SD model using annual data from 30 provinces and cities in China from 2010 to 2019 to analyze the impact of collaboration of innovative subjects under digital empowerment on the manufacturing industry's high-quality development and produce subsequent predictions up to 2035. The relevant findings are threefold. First, digital technology development eases the flow of innovative factors, improves the performance of multi-institutional collaborative innovation, expanding innovation output, which advances the manufacturing industry's high-quality development. Second, the simulation results show that collaborative environmental variables such as education, information infrastructure, and science and technology expenditure have different promotional effects on the evolution of innovation. Science and technology expenditure improves innovation more strongly, followed by information infrastructure and education expenditure. Third, science and technology expenditure can expediently improve collaborative innovation and manufacturing innovation output, followed by information technology expenditure, whereas education investment is relatively flat. Furthermore, as the intensity of expenditure increases, the intensity of education expenditure rises significantly resulting in economies of scale, followed by science and technology expenditure, whereas the scale effect of information expenditure is not obvious.
Our results demonstrate that collaborative innovation is a significant driving force for the manufacturing industry's quality improvement. Exchanges and collaboration among innovation subjects should be actively promoted. It is essential to establish an innovation consortium led by leading enterprises, supported by universities and research institutions, and coordinated by all innovation subjects to organically connect all innovative subjects, reduce obstacles to the mobility of cross-departmental and cross-subject innovative factors, integrate scattered innovative factors, and develop an institutional mechanism with a strong endogenous driving force and high innovation efficiency. The structure of fiscal expenditure must also be optimized by increasing science and technology expenditure, attaching importance to accurate education expenditure, and increasing investment in fixed assets in the information service industry.
LimitationsAlthough the study has revealed the internal mechanism of innovative factors empowered by digital technology for promoting high-quality manufacturing industry development, some limitations remain. First, due to external factors such as the COVID-19 pandemic, the research data used in this article are only updated to 2019. Second, the variables we employ are relatively rough, which affects the accuracy and validity of the modeling. To further reduce deviation from real world circumstances, in future research, external environmental factors such as the pandemic can be considered in the model. In addition, quality manufacturing development can also be measured from export or green perspectives to improve the model settings and the model's representation of the real economy. Furthermore, econometric methods can also be applied to conduct further empirical analysis concerning innovation factor allocation and manufacturing quality development under digital empowerment.
CRediT authorship contribution statementCui Li: Writing – review & editing, Writing – original draft, Funding acquisition, Formal analysis, Conceptualization. Jie Zhu: Visualization, Validation, Software, Methodology, Investigation, Data curation. Changqi Tao: Validation, Supervision, Resources, Project administration, Funding acquisition, Conceptualization.