


The global supply chain has been experiencing frequent “chain break” events, raising concerns about supply chain resilience within the academic community. When innovating, enterprises require support for supply chain resilience when faced with the risk of a “chain break.” Current research primarily focuses on the impact of information technology or digital technology on enterprise supply chains, neglecting the influence of market accessibility on enterprise innovation performance through the supply chain system. By considering supply chain resilience as an influence path, this study assesses the impact of market accessibility on firms’ innovation performance. The results suggest that market accessibility significantly influences innovation performance, but its impact on innovation quality is less pronounced concerning the quantity of innovative output. The impact of market accessibility is partly due to market expansion beyond a firm's domestic boundaries. The mechanism analysis reveals that market accessibility improves supply chain resilience by optimizing efficiency and adaptability, fostering enterprise innovation performance. However, market accessibility undermines supply chain stability, enhancing innovation. Further analysis suggests that market accessibility has a stronger positive impact on the innovation performance of larger firms and their localities. Additionally, it mitigates the negative effects of geographical distance on firm innovation.
In today's turbulent and uncertain economic environment, frequent disruptions in global supply chains have had detrimental effects on enterprise productivity, hindering innovation. Consequently, enhancing the resilience of the supply chain (SC) has become imperative. Modern market infrastructure, such as digital information networks, transportation systems, and smart logistics, are pivotal in promoting the efficient functioning of SC systems (Sadeghi et al., 2024; Tian et al., 2024; Li et al., 2024a; Wei et al., 2023). In recent years, the Chinese government has expended considerable efforts to build infrastructure such as modern transportation and information networks and public resource trading platforms. This infrastructure has significantly improved market accessibility. Transportation networks are different from information networks and public resource trading platforms and can ensure the effective distribution of material resources. This is an essential prerequisite for business production and product innovation (Tian et al., 2024). Therefore, this study investigates the influence of transportation networks, which represent the market infrastructure, on enterprise innovation performance. Considering the current landscape of collaborative innovation among enterprises and the potential disruptions in SCs, this study explores how enhanced market accessibility through SC resilience affects enterprise innovation.
The main contributions of this study are as follows. First, it provides a new research perspective. The existing literature mostly analyzes the impact of SC systems on firm innovation performance. This study further incorporates SC resilience into the analytical framework and theoretically analyzes the influence of market accessibility as a pathway for firm innovation through SC resilience. Second, it explores new economic mechanisms relating to the SC. Based on the collaborative innovation model of supply and innovation chains, this study divided SC resilience into three aspects: efficiency, stability, and adaptability. It analyzes the mechanisms of market accessibility, SC resilience, and enterprise innovation performance in detail. Third, considering economies of scale and distance restrictions, we conduct a heterogeneity analysis on market size, firm size, geographic distance, and supplier distance to clarify the mechanism's preferences.
The remainder of this paper is structured as follows. Section 2 introduces the research status and gaps, and Section 3 presents a mechanism analysis and proposes the hypotheses. Subsequently, Section 4 presents the model, methods, data sources, and variables used in this study, while Section 5 presents and discusses the results. Sections 6 and 7 present the conclusions and implications, respectively. Finally, Section 8 discusses this study's limitations.
Literature reviewTo address the risk of chain disruption, this study examines the role of market accessibility in promoting SC resilience in enterprise innovation. The relevant literature can be divided into three main themes: the impact of market accessibility, measurement and influencing factors of SC resilience, and the influencing factors of collaborative innovation in enterprises.
First, market accessibility is crucial as a comprehensive indicator to assess the impact of trade cost reductions resulting from enhanced transportation infrastructure (Donaldson, 2018). Relevant research can be divided into two main categories: (i) the growth effect of market accessibility on the macroeconomy and microenterprises and (ii) the impact of market accessibility on factor mobility and allocation. In terms of the growth effect, enhanced market accessibility has strengthened connectivity and integration among regions (Chen & Haynes, 2017; Jiao et al., 2017) while promoting macroeconomic growth and improving firm productivity (Banerjee et al., 2020; Jin et al., 2020). Improvement in market accessibility enhances the efficiency of resource allocation in terms of factor mobility and allocation (Wang et al., 2024a), facilitating the flow of production factors such as physical capital, information, knowledge, and funds (Baum-Snow et al., 2018; Dong et al., 2020; Hollander & Verriest, 2016). The fundamental benefit of market accessibility lies in the reduction in trade and communication costs effected by transaction costs, promoting economic growth and optimizing factor allocation (Ahlfeldt & Feddersen, 2018; Charnoz et al., 2018; Hornbeck & Rotemberg, 2019). Intuitively, the aforementioned role of market accessibility contributes significantly to the functioning of SC systems. New technologies discussed in existing studies, such as smart logistics or digital technology, have also improved market accessibility. Nevertheless, limited research has been conducted on the correlation between market accessibility and SC systems.
Following the COVID-19 outbreak, the global economy was impacted, and SC systems faced heightened risk of disruption. Consequently, there has been increased focus on resilience as a critical concept. SC resilience refers to the elasticity of an SC system—its ability to recover performance following disruptive effects (Hosseini et al., 2019). With the development of related research, the concept of SC resilience has gradually become enriched. In more detail, SC resilience refers to the ability of a SC system to withstand risks, adapt to shocks, and sustain development in the face of external shocks (Gölgeci & Kuivalainen, 2020). The subsequent analysis was based on the above definition of SC resilience. This research also emphasizes the effective enhancement of SC resilience. From a micro-enterprise perspective, factors such as risk management capability (El Baz & Ruel, 2021), Industry 4.0 technology (Qader et al., 2022), and digital technology (Kang et al., 2023) are considered to enhance SC efficiency directly and have already been incorporated into the concept of resilience. From a macro perspective, research on enhancement of SC resilience is limited. Gölgeci and Kuivalainen (2020) suggested that social capital can enhance the absorptive capacity of SCs, improving their resilience. However, current research on the factors affecting SC resilience focuses on the impact of the application of information or digital technology. The role of market accessibility in promoting physical capital flows has been ignored. Currently, cross-organizational cooperation is more frequent (Wu et al., 2023), and the supporting role of market accessibility in SC resilience must be explored further.
Another aspect of research closely related to this study concerns the factors that influence collaborative innovation in enterprises. Collaborative innovation refers to the collaborative creation between companies and research institutions to reduce research and development costs and risks (Lee et al., 2019). It is characterized by its cross-regional and cross-organizational nature. Some studies examined the impact of trade costs on collaborative innovation based on cross-regional characteristics (Kang et al., 2023; Shan et al., 2023), primarily focusing on knowledge spillover dynamics. Based on inter-organizational characteristics, other studies have analyzed collaborative innovation in SCs. These studies have found that factors such as SC partner relationships and power structures among SC members influence a company's innovation performance (Shen et al., 2021) and knowledge spillover effects among SC members (Al-Omoush et al., 2023; Li et al., 2024b). Existing research has shown that the SC system promotes the growth of innovation performance in enterprises. This study focuses on the spillovers between SC members. Nonetheless, the existing literature seldom addresses the impact of market-entry thresholds or levels of integration on SC systems and firm innovation. Based on the frequent occurrence of disruption risks, this study utilizes market accessibility as a measure of integration and analyzes the mechanisms behind market accessibility, SC resilience, and innovation.
This study elucidates the correlations between market accessibility, SC resilience, and firm innovation. The literature review indicates that the current enterprise innovation mode has migrated toward a collaborative co-creation approach that relies on supply and innovation chains. This transformation necessitates support for SC resilience. Moreover, market accessibility reductions in transaction costs can facilitate the smooth operation of the SC system. However, limited research has been conducted on the interconnections among market accessibility, SC resilience, and firm innovation in existing literature. This study investigates the potential of market accessibility to enhance firm innovation performance consistently by strengthening SC resilience and explores the underlying mechanism that links market accessibility, SC resilience, and firm innovation.
Mechanism analysis and research hypothesesMarket accessibility is pivotal in reducing transaction costs, facilitating factor distribution, and promoting the dissemination of information and knowledge (Cedillo-Campos et al., 2022; Mao et al., 2024; Ribeiro et al., 2023). It is also crucial to facilitate the operations of enterprise SC systems (Chen & Haynes, 2017). This study analyzed the role of market accessibility through resilience. SC resilience refers to the capacity of an SC system to endure and adapt to disruptions and sustain progress (Wieland & Durach, 2021). Simultaneously, the collaborative innovation mode, which relies on the supply and innovation chains, has emerged as the primary approach to innovation for enterprises (Di et al., 2024; Al-Omoush et al., 2023). Given the rich connotations of SC resilience, can market accessibility promote enterprise innovation performance through increased resilience? This study divides SC resilience into SC efficiency, stability (Ersahin et al., 2024), and adaptability (Nikookar et al., 2024) for a mechanism analysis, proposes relevant hypotheses, and analyzes the impact of market accessibility on enterprise innovation based on this path.
Market accessibility, supply chain efficiency, and enterprise innovationSC efficiency is demonstrated by frequent trade exchanges between upstream and downstream enterprises in the SC. Enhancing efficiency facilitates the deep integration of enterprises into the SC network and strengthens collaboration among them. The reasons for promoting SC efficiency through market accessibility are as follows. First, market accessibility mitigates the trading costs associated with frequent exchanges among enterprises, reduces capital and inventory turnover days, and augments the intensity and velocity of trade between enterprises (Huang et al., 2023; Niu et al., 2020). Second, market accessibility promotes communication among SC members and alleviates information asymmetry among members (Nikolaou & Dimitriou, 2024). Meanwhile, the high-frequency communication and collaboration among enterprises yield a positive impact of “reciprocal assistance” and progressively establish an interconnected SC ecosystem (Orenstein, 2020). Third, enhanced market accessibility enables enterprises to secure financial support. By improving accessibility, funding providers can easily acquire comprehensive production data and meticulously evaluate businesses, expediting loan issuance procedures and venture capital investments (Wang et al., 2024b). Market accessibility helps enterprises gain an advantage in SC efficiency. This advantage enables enterprises to obtain innovation output more quickly and maintain a dominant position (Huang et al., 2023). Therefore, this study proposes the following hypothesis:
H1 Enhancing market accessibility improves enterprises’ SC efficiency and stimulates innovation.
SC stability refers to the stability of the relationship between enterprises and members within the SC (Jiang & Wang, 2024; Palsule-Desai et al., 2013). Enterprise innovation is characterized by a lengthy cycle and high risk. Theoretically, a more stable SC relationship for an enterprise is conducive to fostering innovation (Geng et al., 2024). Nevertheless, such stability in SC relationships restricts enterprises’ market reach, hampering innovation. From the perspective of collaborative innovation, broader external collaboration enhances enterprises’ knowledge bases, facilitating the reorganization and generation of novel insights (Audretsch & Belitski, 2023). The greater the number of external partners with which a company engages, the more likely it is to achieve superior innovation performance. These two factors impede enterprises from pursuing external collaborations. First, enterprises engaging in cross-sector innovation face additional constraints related to managing knowledge collaboration costs. The transaction costs associated with coordination requirements impede cross-sectoral innovation (Hall & Sena, 2017). Second, despite rapid knowledge acquisition facilitated by digital technologies, collaborative innovation is hindered by geographic proximity. When enterprises seek partners, differences in systems, laws, and cognition among regions constrain collaborative innovation (Hervas-Oliver et al., 2018). Market accessibility expands the boundaries of the markets to which enterprises can connect, enabling them to access a wider range of potential cooperative partners. When pursuing collaboration, market accessibility reduces transaction costs, accelerates information exchange, eliminates dissent, and facilitates consensus. Increased market accessibility also increases the likelihood of enterprises switching suppliers and altering their SC relationships, resulting in reduced SC stability. Therefore, this study proposes the following hypothesis:
H2 Market accessibility undermines supply chain stability and fosters innovation within enterprises.
SC adaptability refers to an SC system's capacity to adapt swiftly and recover effectively from deviations in its original operational trajectory when confronted with external shocks (Behzadi et al., 2020; Ivanov & Keskin, 2023). When external shocks such as geopolitical conflicts, extreme weather events, and other risks pose a threat to SCs and innovation networks in affected industries, SC adaptability ensures the continuity of innovative activities in the face of potential disruptions (Huo et al., 2024). The positive impact of market accessibility on SC adaptability lies in the re-evaluation and establishment of suppliers (Chervenkova & Ivanov, 2023). First, market accessibility expands the enterprise's range of options for supplier selection. When critical nodes in the supply network are interrupted, quickly re-establishing supplier relationships is the key to preventing chain breaks (Ivanov & Dolgui, 2021). When existing SC relationships deteriorate, market accessibility broadens the market scope that a company can tap into and facilitates the expedited establishment of relationships with new suppliers (Chai & Ngai, 2020). Second, market accessibility expands the scope of information search (Yan et al., 2024). During the assessment phase of establishing a relationship with a new supplier, enterprises must evaluate production-related information, such as the financial stability, production capacity, and product quality of prospective partners. Improvements in market accessibility have significantly reduced the time costs associated with this process. Based on these premises, this study proposes the following hypothesis:
H3 Market accessibility enhances enterprise supply chains’ adaptability and stimulates innovation.
To examine the influence of market accessibility on enterprise innovation, we used a two-step regression method (Chen et al., 2020). The first step was to build a benchmark model to evaluate the effects of market accessibility on enterprise innovation. The second step involved investigating the impact of market access on the mediating variables. The benchmark model was established as follows:

In Eq. (1), the subscripts i, j, and t denote the city, enterprise, and year, respectively. The variable Innov—the dependent variable—represents the level of innovation performance achieved by firms. The variable Ma represents the level of market accessibility in the city where the company is located, while β denotes the coefficient of focus as a core explanatory variable. Contral refers to the set of control variables. Firm, Year, and City represent fixed effects for individual, year, and city, respectively. Additionally, they account for random error terms. Based on the benchmark model, we further elucidate the mechanism through which market accessibility influences enterprise innovation via supply chain resilience. Furthermore, based on the theoretical analysis mentioned previously, this study empirically examines the efficacy, stability, and adaptability of SCs. Consequently, building upon the benchmark model, we construct the following mediating models:
Eff denotes the level of SC efficiency within an enterprise, Sta represents the degree of SC stability, and Recov signifies the extent of SC resilience.Variable constructionExplained variable


An enterprise's innovation performance depends on its stock of authorized patents, which can be categorized as inventions, utility models, and design patents. Invention patents represent higher-quality innovation outputs, whereas utility model patents also possess commercial value. In the robustness test, we consider the authorized stock of invention and utility model patents as dependent variables.
Explanatory variableMarket accessibility was measured using a proxy variable for Market Access. Market Access has the advantage of accurately reflecting market changes resulting from the enhanced speed of the transportation network, which undoubtedly exerts further influence on enterprise SCs and promotes logistics efficiency (Donaldson, 2018). Market Access is calculated using the following formula:

Eq. (5) demonstrates that Mait represents market access, whereas τit denotes the intercity transportation cost matrix derived from the iceberg cost calculations. The population size of the destination city Njis a measure of the city's market size. In this context, when trade elasticity is −θ, Donaldson (2018) empirically determines its value as 8.22. The transportation cost matrix τij is calculated as follows:

Baum-Snow (2018) suggests that with a significance level of ρ=0.008, the power of time is set at 0.8<1—transportation costs exhibit concavity as they are proportional to transportation time and inversely proportional to marginal transportation cost. time denotes the traffic duration. The initial urban traffic network was identified as comprising highways and regular railways in the calculation of time, with the initial speed set at 100 km/h. The Medium and Long-term Railway Network Planning of the National Railway Administration of China verified the commencement year for high-speed rail in each city. It sets the maximum operating speed at 250 km/h for main-road cities and 200 km/h for non-main-road cities along “eight vertical and eight horizontal” high-speed railways, with the corresponding traffic routes being regularly updated. The distances between cities were determined by calculating the latitude and longitude coordinates.
Mechanism variable(1) SC efficiency: In this model, Eff is used to represent efficiency. The number of days required for inventory turnover serves as an indicator of efficiency. This reflects the efficiency of promptly converting inventory into sales revenue, demonstrating the effectiveness of the enterprise's SC. (Lee et al., 2015). The days required for inventory turnover calculation formula provided in the CSMAR database is the 365/Inventoryturnover. In this study, the logarithm of ln(365/Inventoryturnover) is used to characterize the inventory turnover days of the enterprises. (2) SC stability. The term “supply chain concentration” is employed to denote the stability of the SC, measuring the stability of long-term cooperation between upstream and downstream enterprises in the SC (Jiang et al., 2024). The calculation formula is as follows: (sum of purchase proportions from the top five suppliers + sum of sales proportions from the top five customers) / 2. (3) Supply chain adaptability. Shan et al. (2014) utilized the degree of “deviation” between production and demand fluctuations as a proxy measure for assessing SC adaptability. This proxy reflects the ability to adapt production in response to external demand shocks. The formula is as follows:
Control variables
The city-level control variables comprised the number of Internet users, government expenditure on science and technology, and the number of university teachers. Information infrastructure and government spending on technology influence business innovation and should be excluded from the model. Moreover, the number of university teachers serves as an indicator of the scale of scientific research institutions in the city in which the enterprise is located. At the enterprise level, the control variables encompass enterprise size, asset-liability ratio, revenue growth rate, enterprise age, and board size to reflect the current development status of enterprises accurately.
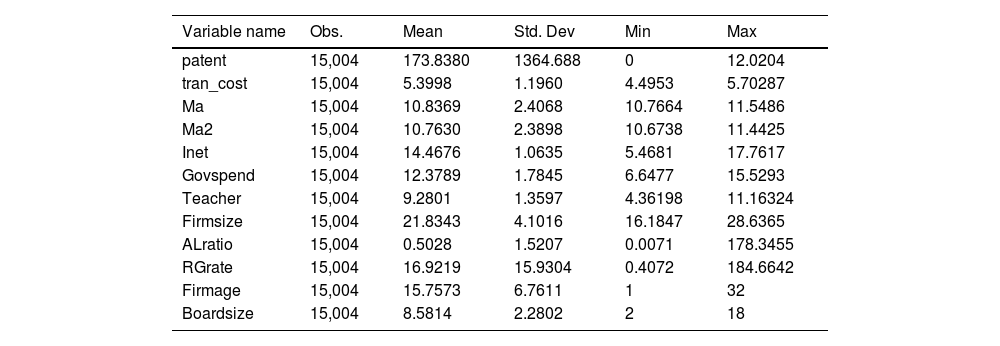
Data sourceGiven the availability of data, this study uses 2011–2021 data from 1365 A-share listed companies in China and matches them with the relevant data of their respective cities to construct a well-balanced panel. Table 1 presents the descriptive statistics. The following section outlines various data sources.
Summary statistics of variables.
Traffic network data were obtained by retrieving the longitudinal and latitudinal coordinates of the Chinese cities from the Baidu Map API. The highway speed is determined using relevant information provided by the Ministry of Transport, while the speed of relevant railway networks is set according to the “Medium and Long Term Railway Network Planning” limits issued by the National Railway Administration. Additionally, information regarding the opening year of high-speed railways in each city was collected from sources including the China Railway Yearbook, China Railway Corporation, and announcements made on the National Railway Administration website. Through combination of these details, a comprehensive traffic network that reflects the speed characteristics of highways, railways, and high-speed rail systems can be developed.
Data of listed companiesData on China's A-share listed companies were obtained from the CSMAR and CNRDS databases, which encompass patent applications, SC research, and control variables at the company level. Data on financial institutions and securities firms are excluded.
City dataThe City Statistical Yearbook of China provides data on prefecture-level cities, from which we collected city-level control variables for 267 prefecture-level cities in China between 2011 and 2021.
Other dataIn the construction of instrumental variables, information from the Examination of Post Stations during the Ming Dynasty was used to reflect the historical traffic patterns in China. This dataset includes records of the presence of post-stations in prefecture-level cities and their corresponding numbers.
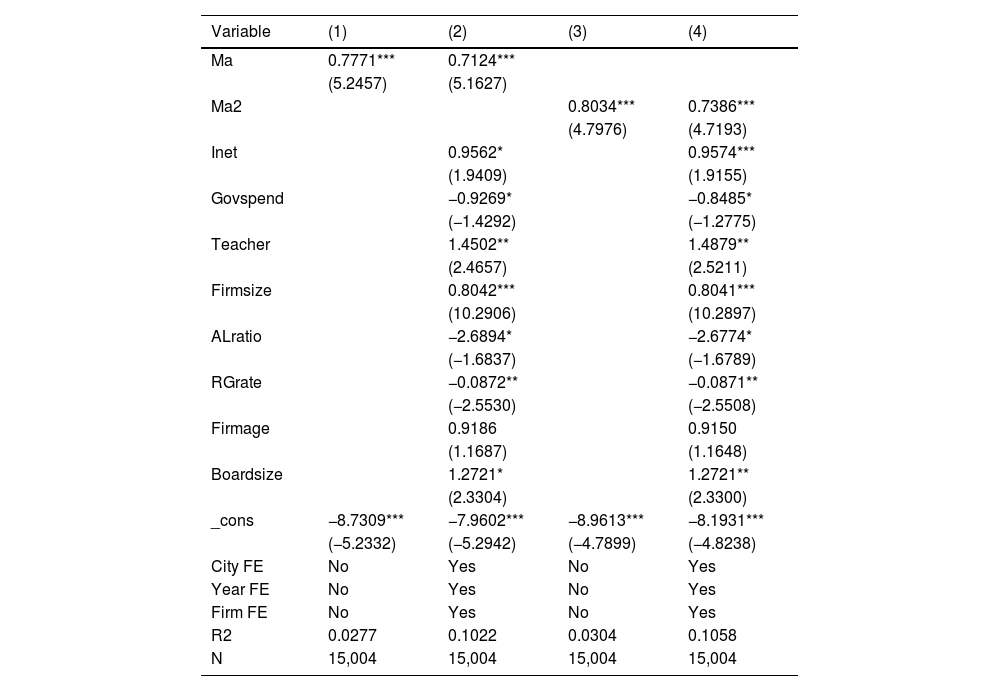
Empirical results and analysisBenchmark regression resultsThe regression analysis incorporates fixed effects for the controlling firm, city, and year variables. The results are summarized in Table 2, which presents the benchmark regression findings on the effect of market accessibility on firms’ innovation levels. Market accessibility is examined under two conditions: one in which the market size of Ma changes with time and another in which the market size remains constant (Ma2). Columns 1 and 3 of Table 2 present the results without fixed effects or the related control variables. The findings indicate a significant positive relationship between market accessibility and enterprise innovation growth at the 1 % level, suggesting that improved market accessibility fosters innovation. After incorporating the fixed effects and relevant control variables into columns (2) and (4) of Table 2, the coefficient of market accessibility remains significantly positive. Thus, market accessibility has a substantial positive impact on enterprise innovation. Comparing the results in columns (2) and (4), we observe that considering changes in market size as the core explanatory variable for market accessibility leads to a slight decrease in the estimated coefficients. This suggests that an increase in the size of the external market within the city where the enterprise is located diminishes the positive effect of market accessibility on enterprise innovation.
Benchmark regression results of the model.
Note: *, **, and *** indicate p < 0.1, p < 0.05, and p < 0.01, respectively.
According to the regression results of the control variables, the coefficients of InetInte and Teacher at the city level were positively associated with the enterprise innovation level. This indicates that higher levels of Internet development and a greater number of university teachers in the city where the enterprise is located can promote enterprise innovation. Conversely, the coefficient of Govspend is negatively associated with enterprise innovation, suggesting that increased government expenditure on innovation has a crowding-out effect on enterprise innovation. Among the control variables at the enterprise level, Firmsize and Boardsize exert robust positive influences on enterprise innovation. The magnitude of a company's and management team's size reflects its market position. As company size increases, decision-making at the managerial level becomes more professionalized, emphasizing its greater significance in fostering enterprise innovation. The negative coefficient of the asset-liability ratio (ALratio) indicates that enterprises with high levels of debt may face financing constraints that can pose challenges to their ability to afford the costs associated with innovation activities. Similarly, the negative coefficient of the revenue growth rate (RGrate) suggests that companies experiencing steady profit growth may lack incentives for innovation and exhibit “innovation inertia.” The positive regression coefficient of Firmage is statistically insignificant, suggesting that the impact of firm age on innovation levels is not discernible.
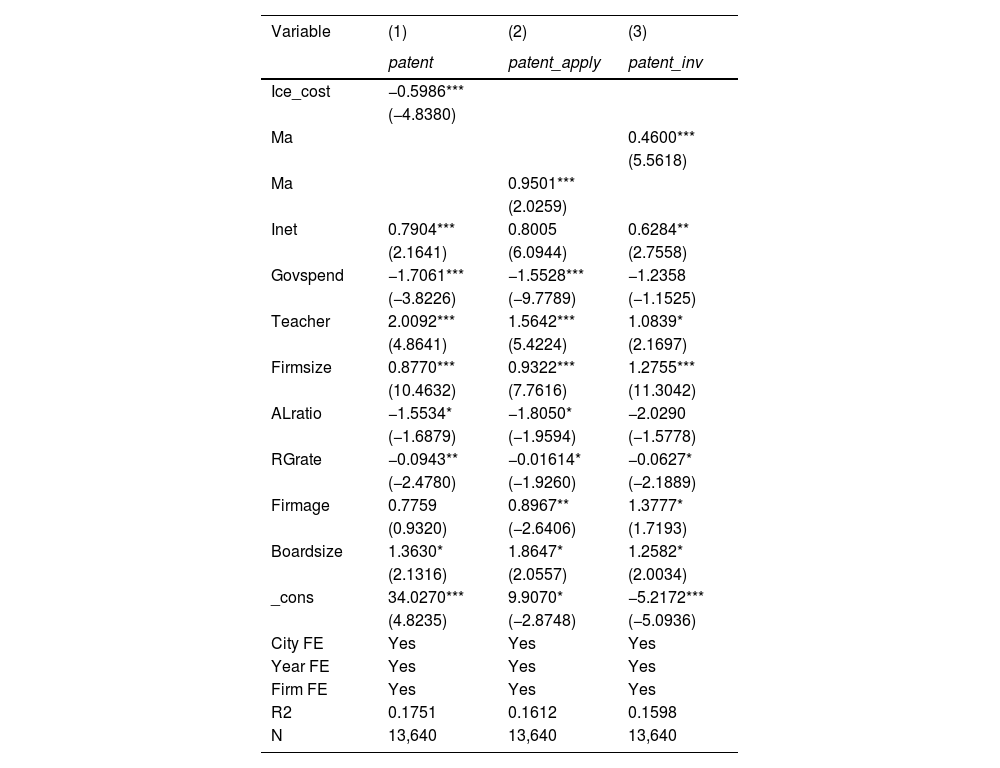
Robustness testReplacement variablesIn addition to employing the Ma index as a measure of market accessibility, this study uses iceberg costs as an indicator of intercity trade expenses. A smaller iceberg cost signifies lower trade costs in the city in which the enterprise is located, indicating enhanced market accessibility. This characteristic contrasts with the Ma index because a higher Ma value in the city of operation indicates greater market accessibility. The regression results presented in Column (1) of Table 3 demonstrate that the Ice_cost coefficient exhibits significant negativity, aligning with the benchmark regression findings, and confirming that market accessibility positively influences enterprise innovation. Furthermore, we replace the explanatory variables with the stock of inventions and utility model patents. The regression results are reported in Columns (2) and (3) of Table 3. In this case, the coefficient of Ma remains positive, indicating the robust positive effect of market accessibility on a firm's innovation level. A comparison of Columns (2) and (3) of Table 3 reveals that market accessibility has a stronger positive impact on utility model patents than on invention patents, which are generally considered more valuable. These comparative findings suggest that although market accessibility generally promotes enterprise innovation, it has a weaker effect on the quality of enterprise innovation achievements.
Robustness test results for replacement variables.
Note: *, **, and *** indicate p < 0.1, p < 0.05, and p < 0.01, respectively.
To mitigate endogeneity bias, this study employed instrumental variables and the number of post stations during the Ming Dynasty as instruments for the regression analysis (Martincus et al., 2017). The station system served as a crucial transportation network in ancient China and reflected the level of intercity mobility at the time. The formula for the instrumental variables is as follows:

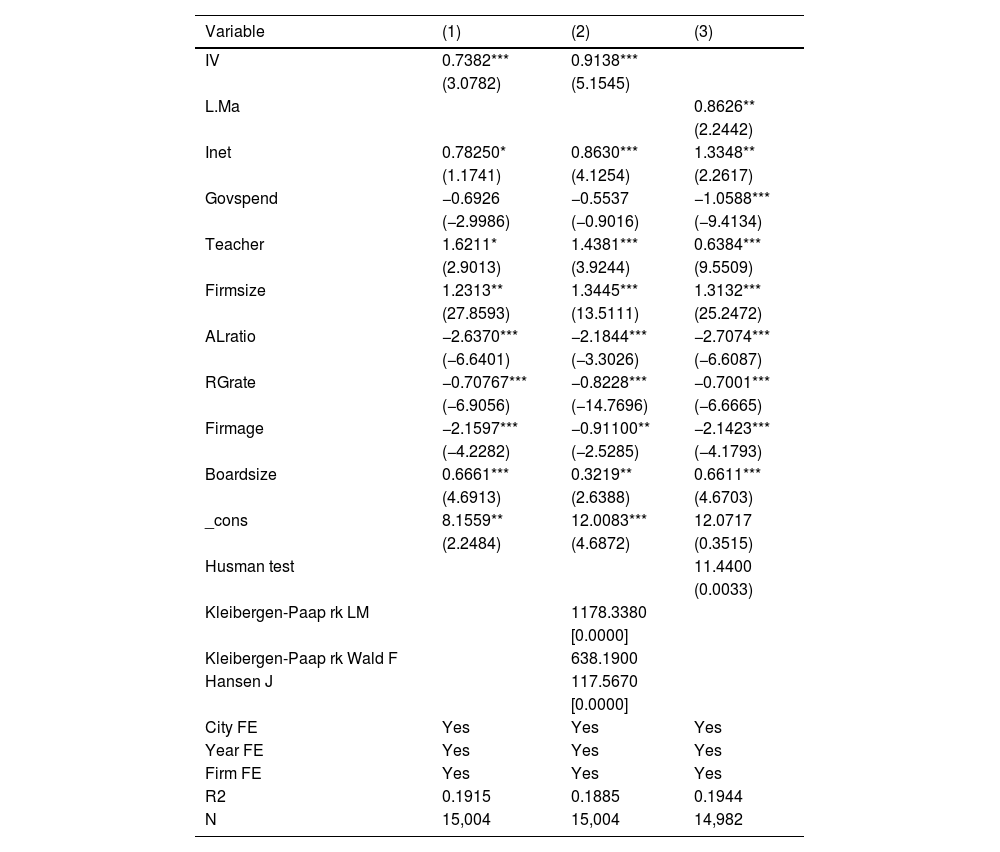
The variable PostRoadi serves as an indicator of the presence of a post road in the Ming Dynasty, represented as a binary variable. The variable Investit represents national infrastructure investment. In Table 4, column (1) presents the regression results using instrumental variables, while column (2) displays the regression results obtained through two-stage instrumental variables. Further, Ma lag one stage is employed as an instrumental variable for the regression analysis. The positive coefficients of IV indicate that the baseline regression results remain robust even after addressing endogeneity concerns. Comparing with the baseline regression outcomes, notably, considering endogeneity leads to a larger coefficient for market accessibility. This means that the promoting effect of market accessibility on firm innovation was underestimated in the baseline analysis.
Results of IV regression.
Note: *, **, and *** indicate p < 0.1, p < 0.05, and p < 0.01, respectively.
This section examines the existence of efficiency improvement mechanisms in SCs. This section assesses the efficiency of enterprises’ SCs using the natural logarithm of inventory turnover days. The number of inventory turnover days reflects the communication level between upstream and downstream enterprises in the SC. A lower number of turnover days indicates a higher level of inventory realization efficiency for the enterprise and a higher level of SC efficiency.
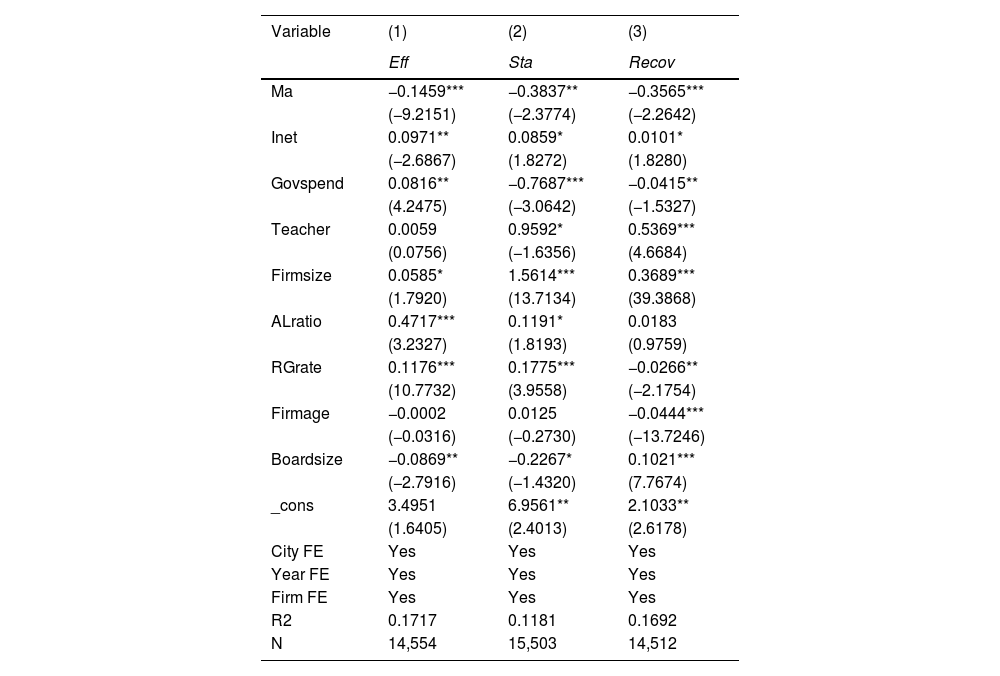
Column (1) of Table 5 presents the mechanism for enhancing SC efficiency. The estimated coefficient value for Ma was −0.1459, which is significantly negative. This finding suggests that market accessibility reduces the time taken to sell products, fosters improvements in SC efficiency, and facilitates effective growth in enterprise innovation levels. Thus, H1 is confirmed.
Results of mechanism analysis.
Note: *, **, and *** indicate p < 0.1, p < 0.05, and p < 0.01, respectively.
SC stability refers to the stability of the cooperative relationships between enterprises and their upstream and downstream suppliers. In this section, we use the degree of SC concentration as a proxy to assess SC system stability. The degree of concentration reflects the relative importance of an enterprise's suppliers and customers. A higher degree of concentration implies greater costs associated with switching between SC relationships. Consequently, enterprises with a high level of SC concentration should exercise caution when considering such switches to enhance the overall SC stability. The estimated coefficient of Ma(−0.3837) reported in Column (2) of Table 5 demonstrates a significant negative impact. Contrary to the efficiency improvement mechanism, this finding reveals that market accessibility undermines the stability of a firm's SC, thus fostering innovation. Market accessibility broadens enterprises’ SC relationship options and increases the possibility of switching suppliers. A broad selection of suppliers enables enterprises to acquire more market and production information, thereby fostering innovation. This conclusion aligns with H2.
Enhancement mechanism for improving supply chain adaptabilitySC resilience includes the sustainability, resistance, and recovery of SC systems following a shock. Efficiency reflects the sustainability of the SC. Stable SC relations represent a strong ability and willingness to resist risks to a certain extent. SC adaptability represents the ability of the SC system to recover quickly after a shock. The degree of “deviation” between production fluctuation and demand fluctuation was adopted by Shan et al. (2014) as a proxy indicator of SC adaptability, with the following formula:

In formula (9), Productionit=Demandit+Inventoryit−Inventoryit−1, the variables ProductionitDemandit, and Inventoryit, respectively, denote enterprise output, enterprise demand, and enterprise inventory. The value of Recovit greater than 1 indicates significant fluctuations in the SC between upstream and downstream supply and demand, suggesting a low level of resilience in the SC. The coefficient estimates in column (3) of Table 5 indicates a significant negative effect, −0.3565. The findings demonstrate that market accessibility strengthens SC adaptability and fosters enterprise innovation growth. This conclusion aligns with H3.
Heterogeneity analysisThis section conducts a heterogeneity examination based on city size, firm size, geographical distance, and supplier distance to investigate the aforementioned influencing mechanisms. The specific approach involves dividing the samples into two groups according to the top 30 % and bottom 30 % sub-points of size and distance and comparing the variations in the estimated coefficients of market access. In addition, the influencing mechanism across different samples are also examined.
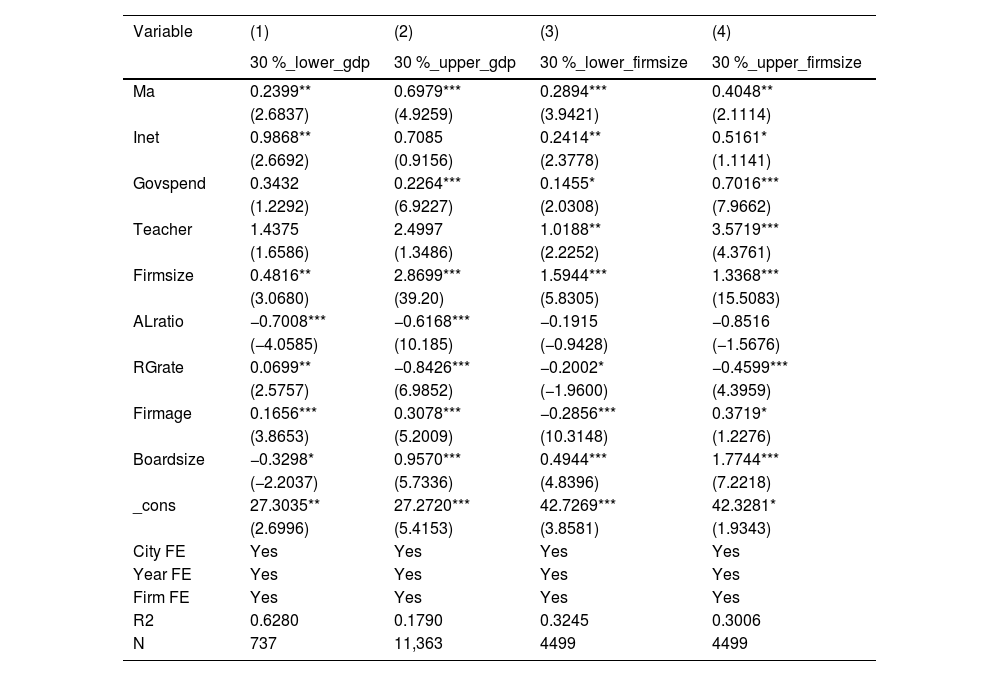
Heterogeneity of city size and firm sizeThe first is the heterogeneity of city size. Columns (1) and (2) of Table 6 present the estimated results after dividing the sample into two groups based on urban GDP are presented in columns (1) and (2) of Table 6. The comparison reveals that the estimated coefficient of Ma for enterprise innovation in cities with subpoint rankings in the upper 30 % is 0.6979, whereas it is only 0.2399 in cities with subpoint rankings in the lower 30 %. The results indicate that while Ma can enhance the innovation level of enterprises in small cities, its impact is significantly weaker than that on enterprises in large cities. Second, we considered heterogeneity in firm size. Columns (3) and (4) of Table 6. The estimated coefficient of Ma for small enterprises is 0.2894 and that for large enterprises is 0.4048. These results suggest that market accessibility exerts a more pronounced incentive effect on innovation for large enterprises and a relatively weaker impact on innovation for small enterprises.
Results of heterogeneity (1).
Note: *, **, and *** indicate p < 0.1, p < 0.05, and p < 0.01, respectively.
An intuitive perspective suggests that small businesses located in smaller cities rely more heavily on market accessibility to establish connections with stronger economies and higher levels of technological advancement within the region owing to their lower overall management level, technical expertise, and knowledge stock. However, contrary to expectations, the results reveal a counterintuitive finding, in which market accessibility plays a more significant role in promoting innovation within larger cities and enterprises. In terms of city size, enterprises in small cities generally remain small with the primary objective of pursuing corporate profit growth rather than blind innovation. Nevertheless, owing to their limited financial resources, small enterprises find it challenging to bear the costs associated with innovation, resulting in low motivation for innovative activities. Unlike small enterprises, metropolitan enterprises face intense competition. Innovation clusters often emerge in regions with greater economic development, prompting enterprises to exhibit a stronger drive for innovation and attain greater market dominance.
Additionally, the size of the city in which the enterprise is located can be interpreted as an indicator of the local market size, and market accessibility exhibits a preference for regions with larger local markets. Benchmark regression analysis reveals that an increase in the external market size diminishes the impact of market accessibility. These findings suggest that market accessibility has a strong effect on firms in urban areas. The positive effect of market accessibility on enterprises located in remote regions was relatively small.
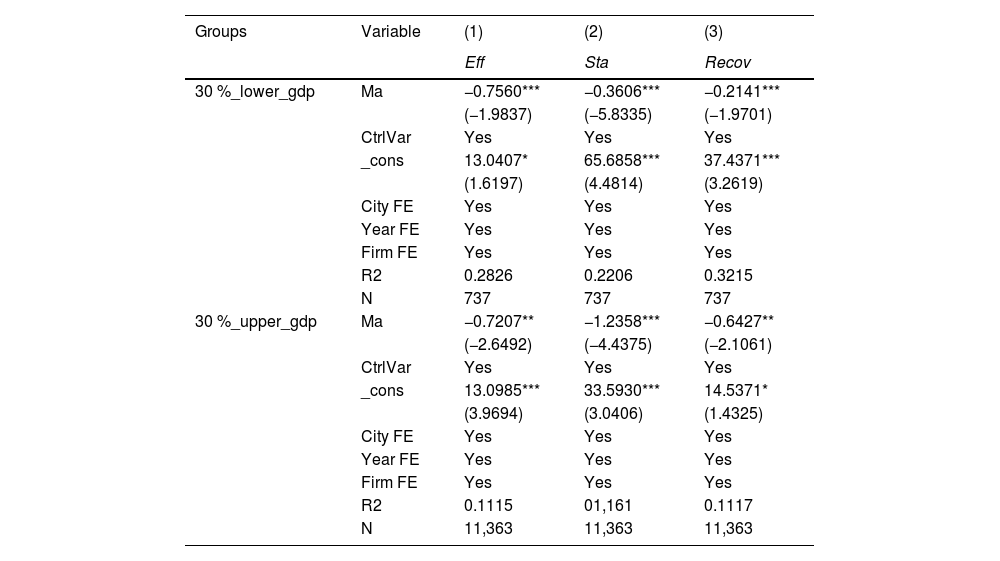
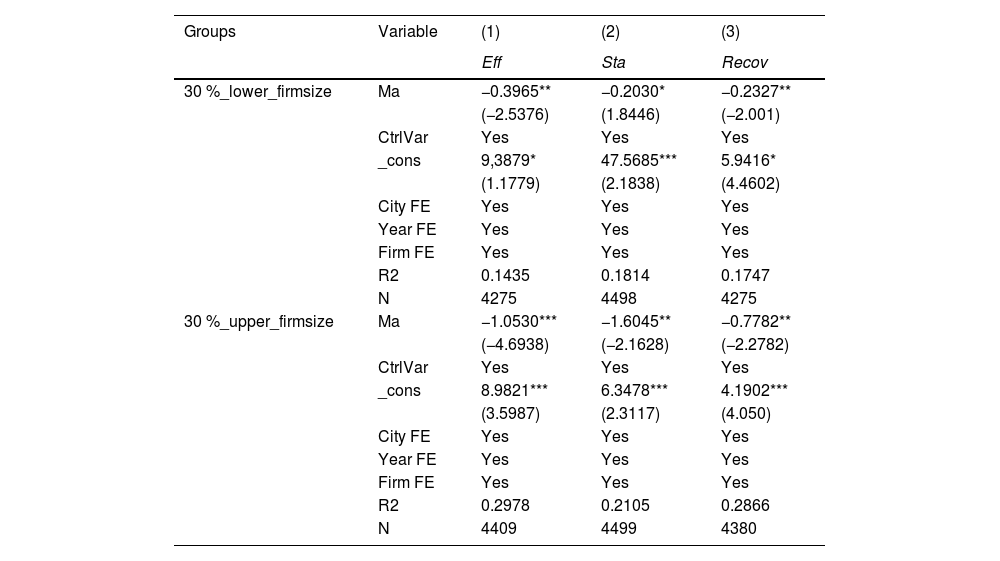
Next, we investigate the heterogeneity of market accessibility mechanisms. First, there was variation in city size, as shown in Table 7. Market accessibility operates through SC efficiency and has a comparable impact on small city enterprises relative to their counterparts in larger cities. However, market accessibility plays a more significant role in the SC stability and adaptability of enterprises in metropolitan areas. Second, heterogeneity exists based on firm size, as shown in Table 8. The underlying mechanism of market accessibility reveals that SC resilience has a stronger influence on large enterprises and weaker effect on small enterprises. Overall, the impact mechanism of market accessibility demonstrates patterns consistent with the aforementioned findings. Specifically, the promotional effect of market accessibility on enterprise innovation through SC resilience is more pronounced for firms in major urban areas and for those classified as large.
Results of heterogeneity (2).
Note: *, **, and *** indicate p < 0.1, p < 0.05, and p < 0.01, respectively.
Results of heterogeneity (3).
Note: *, **, and *** indicate p < 0.1, p < 0.05, and p < 0.01, respectively.
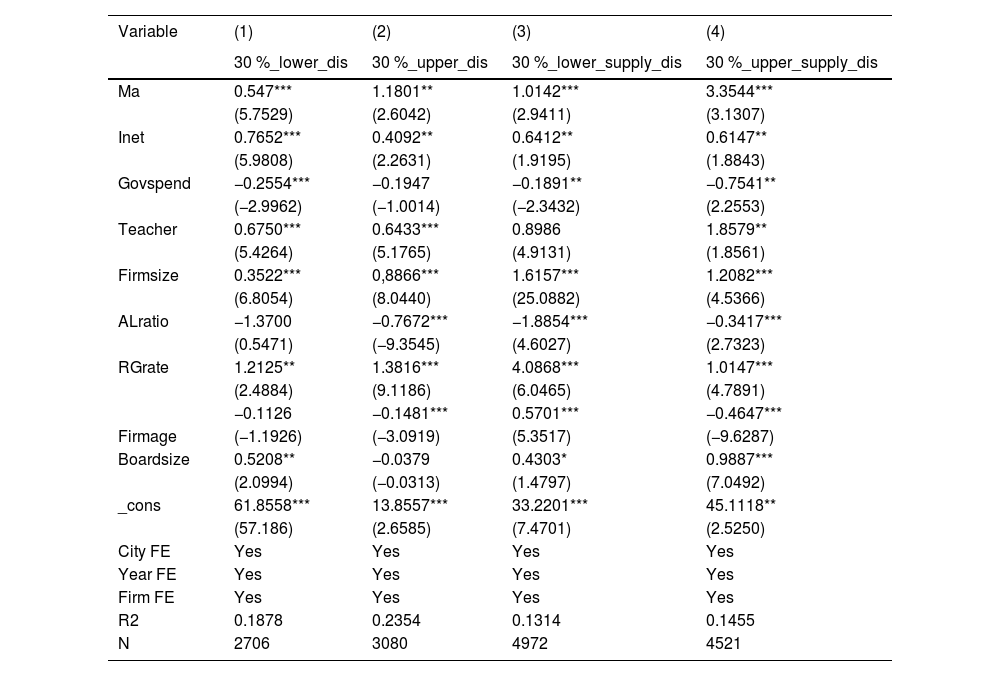
Columns (1) and (2) of Table 9 present the regression results after dividing the sample into two groups based on geographical distance. The comparison revealed that the estimated coefficient of Ma was 0.547 for both the low group and 1.1801 in the high-distance group. Furthermore, by dividing the sample into two groups according to supplier distance, the regression results are shown in Columns (3) and (4) of Table 9. The estimated coefficient of Ma in the low supplier distance group was 1.0142, whereas it increased significantly to 3.3544 in the high supplier distance group.
Results of heterogeneity (4).
Note: *, **, and *** indicate p < 0.1, p < 0.05, and p < 0.01, respectively.
“Geographical distance” refers to the cumulative distance between the city where the enterprise is located and other cities in the sample. Supplier distance” refers to the cumulative geographical distance between an enterprise and its suppliers. The test results indicate that market accessibility has a more pronounced impact on the innovation of enterprises located at greater distances, regardless of whether we consider a macro- or micro-perspective of cities or individual firms, respectively. The aforementioned conclusion aligns with common intuition. The location of an urban area or an enterprise may impose distance constraints, leading to a disconnection between the enterprise and the city's external market. Consequently, enterprises within the city will inevitably encounter challenges in achieving independent innovation as they become isolated in an “information island.” Market accessibility serves as a catalyst for strengthening connections between remote and developed regions, thereby enhancing knowledge spillover effects. For enterprises situated in geographically disadvantaged locations, market accessibility plays a prominent role and exhibits higher marginal utility.
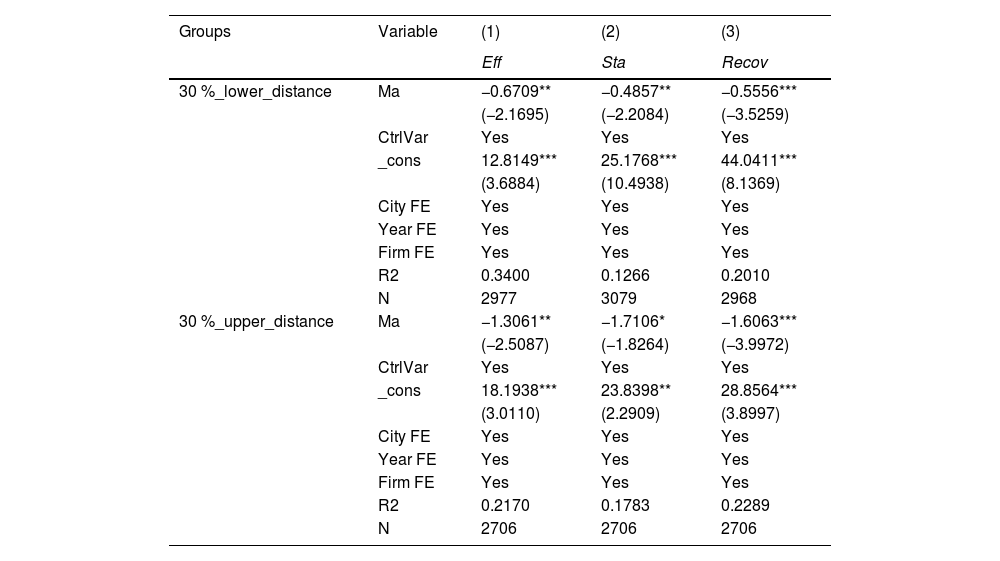
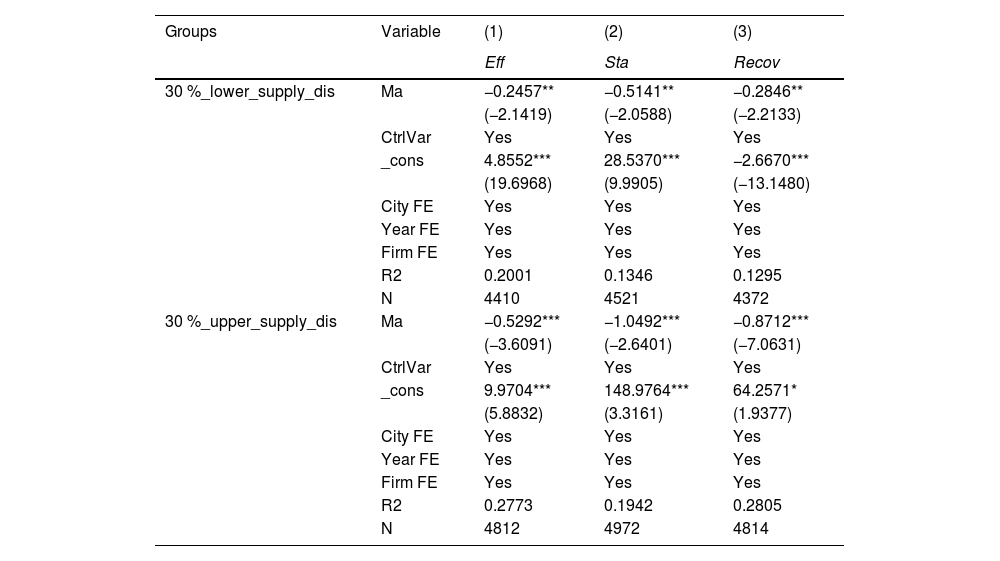
The influence mechanism of market accessibility was further analyzed by considering the heterogeneity of geographical and supplier distances. The first factor was the heterogeneity of geographical distance, as shown in Table 10. By considering SC efficiency, stability, and adaptability as pathways, the impact of market accessibility on enterprise innovation reveals that the influence of the high geographical distance group is more pronounced than that of the low geographical distance group, with a wider disparity. Second, as shown in Table 11 regarding heterogeneity in supplier distance, the mechanism effect of market accessibility on enterprise innovation reveals that the impact of market accessibility is more pronounced for the high supplier distance group than for the low supplier distance group. However, this disparity between the two groups is relatively smaller when compared to the influence of geographical distance.
Results of heterogeneity (5).
Note: *, **, and *** indicate p < 0.1, p < 0.05, and p < 0.01, respectively.
Results of heterogeneity (6).
Note: *, **, and *** indicate p < 0.1, p < 0.05, and p < 0.01, respectively.
A comparison of geographical distances showed that the overall spatial location of a city remained unaltered, whereas enhanced market accessibility mitigated the disadvantages arising from geographical factors. In terms of supplier distance, the gap between the two groups has narrowed. Market accessibility expands the range of supplier options available to enterprises. Enterprises can modify the distance between themselves and their suppliers independently. Although suppliers are indispensable, enterprises willingly accept the corresponding supplier distance. However, in certain scenarios, enhanced market accessibility provides enterprises with an opportunity to switch suppliers. Consequently, its impact is less significant than that of reducing the overall relative geographical distance of an enterprise's location.
ConclusionsThis study examines the impact of market accessibility on enterprise innovation performance through SC resilience using panel data from China's A-share listed companies from 2011 to 2021. The findings indicated the following: First, although the expansion of the external market diminishes the impact of market accessibility, it generally fosters the growth of enterprises’ innovation performance. Second, market accessibility enhances SC efficiency and adaptability, thereby promoting innovation. Third, market accessibility weakens SC stability, thus facilitating the growth of enterprise innovation performance. Market accessibility broadens the selection of suppliers available to enterprises, thereby fostering innovation. Fourth, the effect of market accessibility on firm innovation through SC resilience is more pronounced in metropolitan areas and larger corporations. Fifth, market accessibility mitigates the disadvantages of geographical distance and enhances enterprises’ SC efficiency. Simultaneously, this increases the possibility of enterprises switching suppliers. This possibility undermines SC stability while bolstering adaptability.
ImplicationsAcademic implicationsFirst, the study provided a new perspective to SC studies. In mainstream studies, the discussion on SC resilience primarily revolves around advancements in information technology and enterprise digital transformation (He et al., 2023; Yan et al., 2024). Our results take a different perspective by emphasizing the role of market accessibility in promoting the efficient functioning of SC systems, thereby offering a novel viewpoint. Second, the results indicate that the effect of market accessibility on SC resilience is not uniform. Market accessibility facilitates enterprise innovation by enhancing efficiency, and the expansion of the market scope resulting from market accessibility bolsters SC adaptability and compromises stability. Third, we analyze a new economic mechanism. Current research indicates a disconnect between the impact of market accessibility on economic development (Saidi et al., 2020) and the impact of SC management on firm innovation (Malacina & Teplov, 2022). This study aims to fill the gap between these two aspects.
Practical implicationsFor the government, enhancing market infrastructure, such as transportation and information networks, can facilitate the functioning of the SC system and foster the advancement of enterprise innovation performance. In addition, excessive government intervention in the innovation sector adversely affects enterprises’ innovative output. Policymakers should aim to facilitate market integration and optimize the business environment by providing infrastructure support for enterprises' innovation activities.
Enterprises should avoid prioritizing SC stability without considering product innovation. Market accessibility enables enterprises to expand their reach into a broader market, while providing a wider selection of suppliers. Diversifying supplier choice plays a crucial role in enhancing innovation performance. In response to growing demand in emerging markets, downstream enterprises can benefit from expanding their pool of alternative suppliers, fostering product innovation, and adapting to market dynamics. Upstream suppliers should simultaneously diversify their raw material sources and engage in moderate product innovation to ensure SC stability.
Limitations and future linesThis study has several limitations that need to be addressed in future studies. First, the role of information technology in market access is not considered. In this study, we only consider the improvement in market accessibility caused by the increase in traffic speed and use the number of Internet users to control the level of information technology in the model. The network characteristics of the information infrastructure were not considered.
Second, this study employs a regression analysis to investigate the influence of market accessibility and SC resilience on firm innovation performance. Game theory is a widely used analytical approach in SC management. Future researchers could consider developing a two-period game model wherein the speed parameter for an enterprise's recovery from SC disruption reflects its level of SC resilience for mathematical analysis.
FundingThis work was supported by the National Natural Science Foundation of China [Grant No. 71973055] and the National Natural Science Foundation of China [Grant No. 72162018].
CRediT authorship contribution statementPengcheng Liu: Writing – original draft, Methodology, Formal analysis, Data curation, Conceptualization. Jian Liu: Writing – review & editing, Validation, Supervision, Resources, Project administration, Funding acquisition, Conceptualization. Changqi Tao: Supervision, Software, Resources, Project administration, Funding acquisition.
Our deepest gratitude to the editor and anonymous reviewers for their helpful comments and constructive suggestions that helped promote the quality of this study. We would also like to thank the English Language Editing service made available by Elsevier's Author Services for providing language assistance. Of course, any remaining errors are our own.