


To identify potential markers at admission predicting the need for critical care in patients with COVID-19 pneumonia.
Material and methodsAn approved, observational, retrospective study was conducted between March 15 to April 15, 2020. 150 adult patients aged less than 75 with Charlson comorbidity index ≤6 diagnosed with COVID-19 pneumonia were included. Seventy-five patients were randomly selected from those admitted to the critical care units (critical care group [CG]) and seventy-five hospitalized patients who did not require critical care (non-critical care group [nCG]) represent the control group. One additional cohort of hospitalized patients with COVID-19 were used to validate the score.
Measurements and main resultsMultivariable regression showed increasing odds of in-hospital critical care associated with increased C-reactive protein (CRP) (odds ratio 1.052 [1.009-1.101]; P = 0.0043) and higher Sequential Organ Failure Assessment (SOFA) score (1.968 [1.389–2.590]; P < 0.0001), both at the time of hospital admission. The AUC-ROC for the combined model was 0.83 (0.76-0.90) (vs AUC-ROC SOFA P < 0.05). The AUC-ROC for the validation cohort was 0.89 (0.82–0.95) (P > 0.05 vs AUC-ROC development).
ConclusionPatients COVID-19 presenting at admission SOFA score ≥ 2 combined with CRP ≥ 9.1 mg/mL could be at high risk to require critical care.
Identificar marcadores potenciales durante el ingreso que predigan la necesidad de cuidados críticos en pacientes con neumonía causada por COVID-19.
Material y métodosEstudio autorizado, observacional y retrospectivo realizado entre el 15 de marzo y el 15 de abril de 2020; incluyó a 150 pacientes adultos menores de 75 años con índice de comorbilidad de Charlson ≤ 6 diagnosticados de neumonía por COVID-19. Se seleccionaron aleatoriamente 75 pacientes de entre los ingresados en las unidades de cuidados críticos (grupo de cuidados críticos [GC]) y 75 pacientes hospitalizados que no requirieron cuidados críticos (grupo de cuidados no críticos [GnC]) que representaron el grupo control. Se utilizó una cohorte adicional de pacientes hospitalizados con COVID-19 para validar la escala.
Medidas y resultados principalesLa regresión multivariante reflejó unos incrementos de los odds ratio de cuidados críticos hospitalarios asociados al incremento de proteína C reactiva (PCR) (odds ratio: 1,052 [1,009–1,101]; p = 0,0043) y puntuaciones en Sequential Organ Failure Assessment (SOFA) más altas (1,968 [1,389–2,590]; p < 0,0001) en el momento del ingreso hospitalario. El valor de la curva AUC-ROC para el modelo combinado fue de 0,83 (0,76–0,90) (frente a AUC-ROC SOFA p < 0,05). El valor de AUC-ROC para la cohorte de validación fue de 0,89 (0,82–0,95) (p > 0,05 frente a AUC-ROC de la cohorte desarrollo).
ConclusiónLos pacientes de COVID-19 que presentan al ingreso una puntuación SOFA ≥ 2 combinada con PCR ≥ 9,1 mg/mL podrían ser de alto riesgo a la hora de requerir cuidados críticos.
A new atypical pneumonia appeared in December 2019 that was later found to be caused by a new coronavirus (SARS-CoV-2). By April 2020, the virus had spread to 212 countries worldwide, infecting more than 1,607,467 people and causing more than 98,866 deaths1. By 9 May, 223,578 cases of infection had been diagnosed in Spain, with 26,478 related deaths2. In the early stages of infection patients may experience low grade fever or flu-like symptoms, but this can also be followed by severe respiratory failure3. Patients with SARS-CoV-2 infection have high rates of hospitalization and admission to the intensive care unit (ICU)4. A wide range of parameters have been associated with morbidity and mortality3,5–8, ranging from sex9 to increased plasma D dimer levels3, which may suggest endothelial activation. Many reports have also described an association between serious clinical deterioration and cytokine storm, characterized by the release of IL-6 and IL-1 type cytokines, and also by traditional inflammatory markers, such as C-reactive protein (CRP) and ferritin10,11. Others suggest that severity can be predicted by different serum inflammatory profiles.
Some patients with SARS-CoV-2 infection may require critical care, and this then becomes one of the main problems faced by healthcare systems during such pandemics12. It is still unclear what comorbidities, laboratory test results, or severity features are capable of predicting the potential need for these resources that lead to the collapse of the healthcare system. Good triage criteria and correctly identifying the profiles of high-risk patients could be the cornerstones of individualized management13.
In this context, we decided to evaluate our series of COVID-19 patients in order to identify markers observed at admission that could predict the need for critical care.
Material and methodPatient selectionWe conducted a retrospective study collecting data from 150 patients diagnosed with COVID-19 pneumonia. All had a confirmed diagnosis of SARS-CoV-2. Seventy-five patients were randomly selected from among those admitted to the critical care units of the Salamanca University Hospital (critical care [CC]) between 15 March and 15 April 2020. The results of an earlier pilot study in 10 patients showed that patients admitted to the critical care unit were aged under 75 years and had a Charlson comorbidity index14 of under 6. Therefore, we selected 75 patients admitted to the same hospital during the same period of time who did not require critical care, aged under 75 years and with a Charlson comorbidity index equal to or less than 6 (non-critical group [nCC]) as a control group. Parameters from the nCC were compared with those from the CC.
Exclusion criteria were patients younger than 18 or older than 76, patients with a Charlson comorbidity index greater than 6, and patients in whom essential laboratory results were missing.
ICU admission criteria were: severe refractory respiratory failure secondary to COVID-19 pneumonia, with or without respiratory distress15, and the need for intubation and mechanical ventilation. Patients were only admitted to the ICU after weighing up the benefits of admission against their underlying comorbidities and frailty.
The study was approved by the Research Ethics Committee of the Hospital Clínico de Salamanca (PI 2020 05 487). The Ethics Committee waived the requirement for informed consent.
Data collectionAll study data were collected from the medical records of patients in each group, and included clinical and anthropometric variables and laboratory results on arrival at the hospital emergency unit, prior to admission. We recorded patient-reported symptoms, onset of symptoms, date of hospital admission, date of admission to the critical care unit, and the treatment received. The Sequential Organ Failure Assessment (SOFA) score on arrival at the hospital was calculated to evaluate the patient’s severity16. All data were reviewed by 2 physicians (PAP and ESB), and discrepancies were resolved by a third investigator (LMVR).
CRP and ferritin were chosen as biomarkers of the activation of different inflammatory pathways that could be associated with worsening clinical status10,11. Four inflammatory profiles were created on the basis of blood test results.
Laboratory proceduresAll patients underwent a SARS-CoV-2 rRT-PCR (real-time reverse transcriptase polymerase chain reaction) diagnostic test on admission using a nasopharyngeal swab. Blood tests included complete blood count, coagulation profile, serum biochemical tests (including kidney and liver function, creatine kinase, lactate dehydrogenase, and electrolytes), CRP, interleukin-6 (IL-6), serum ferritin, and procalcitonin. Chest X-rays and computed tomography (CT) scans were performed on all patients if required during their stay.
DefinitionsFever was defined as an axillary temperature of at least 38 °C. COVID-19 pneumonia was described as respiratory symptoms (fever, dry cough, dyspnoea, etc.) plus infiltrates on the chest image23. Acute respiratory distress syndrome (ARDS) was defined according to the internal WHO guidelines for the new coronavirus15. Hypoxaemia was defined as a partial pressure of oxygen (PaO2)/inspired fraction of oxygen (FIO2) ratio of less than 300 mmHg17, or an SpO2/FIO2 ratio of less than 22018,19. Severe hypoxaemia was defined as PaO2/FiO2 less than 150 mmHg20. Severe refractory respiratory failure was defined as failure (increased work of breathing or hypoxaemia) of standard oxygen therapy even after administration of O2 through a non-rebreather face mask (flow rates 10-15 l/min and FiO2 of 0.60-0.95)15.
Statistical analysisData were summarised using descriptive statistics. Missing data were not imputed. Continuous variables were tested for normality using the Kolmogorov-Smirnov test. Quantitative variables are expressed as mean and standard deviation or median and interquartile range (IQR: 25–75), and qualitative variable are expressed as percentages and whole numbers. Quantitative variables were compared using non-parametric tests when the distribution was not normal (Mann-Whitney U test) and parametric when it was normal (Student’s t test). Qualitative variables were compared using the χ2 or Fisher's exact tests.
We calculated the area under the curve (AUC-ROC) of the biomarkers with a p of <0.05 between the two groups in the univariate analysis. Of these, we selected only the 4 parameters with the best AUC in order to include the fewest possible number of covariates for the sample size21. The parameters chosen were used as covariates in a multivariate model to predict the primary outcome. We excluded variables from the multivariate analysis when the differences between groups were not significant, when the number of events was too small to calculate the odds ratios, and when the variable was co-linear with another variable.
To differentiate the groups, we also calculated the cut-off points for the selected variables by calculating their sensitivity and specificity and determining the best Youden index. We then used a forward stepwise approach (logistic regression) to create a model for the selected biomarkers. Only those with a p-value < 0.05 were included in the model, and those with a p value < 0.10 remained in the model, which was developed using simulated replicated data sets, calculating a mean difference in the AUC-ROC between these models and the best biomarkers, with a 95% CI. The DeLong test was used for this purpose. The Hosmer-Lemeshow multiple regression test was used to calibrate the model. To validate the generalizability of the critical risk scale we used data from a hospital (Hospital Universitario de León) that were not included in the development cohort. The 97 patients in this validation cohort had to fulfil the same inclusion criteria as the patients in the development cohort.
Finally, we obtained the best Youden index cut-off points (CPm) for ferritin and CRP from the ROC curves of these variables by calculating the sensitivity and specificity of these points. We used these data to define 4 inflammatory profiles based on lab results: profile 1 (if CRP > CPm and ferritin > CPm), profile 2 (if CRP > CPm and ferritin < CPm), profile 3 (if CRP < CPm and ferritin > CPm), and profile 4 (if CRP < CPm and ferritin < CPm), which were then studied in the two groups. The level of significance was established at p < 0.05.
Statistical analysis was performed on SPSS 21® and Stata 15®.
ResultsBetween 15 March and 15 April, 150 patients were included in this study: 75 patients who required admission to the ICU and formed the group of critical patients (CC) and 75 patients who did not, and were included in the control group (nCC). All CC patients were intubated and connected to mechanical ventilation. Four patients were excluded from this group due to missing data, so the final sample consisted of 146 patients.
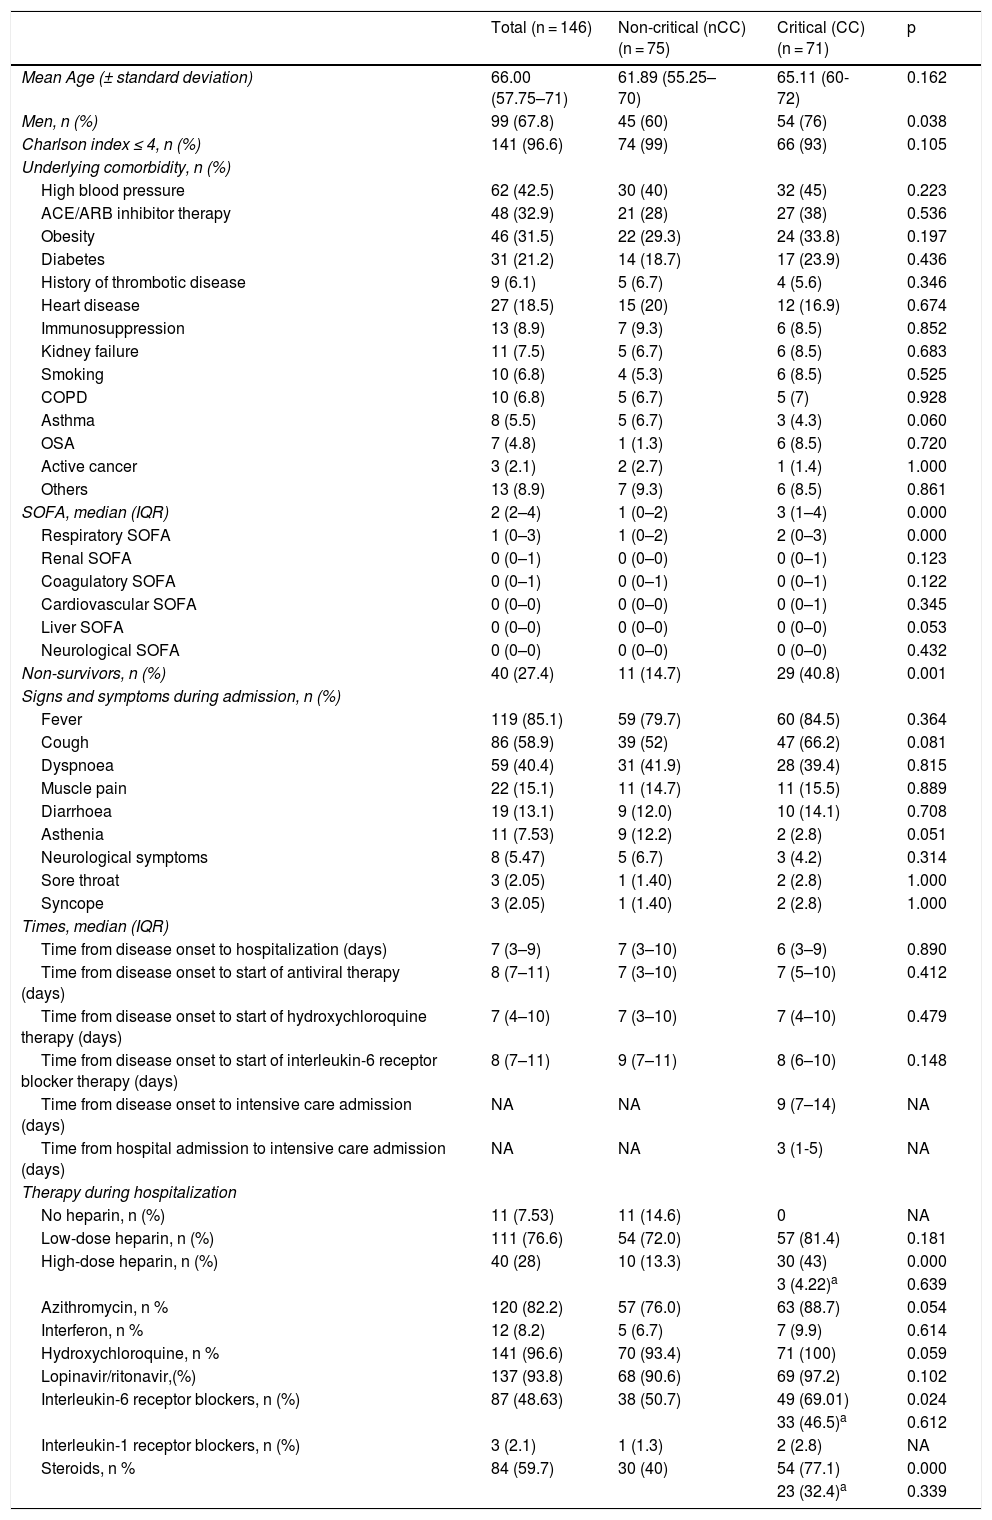
The baseline characteristics and reasons for admission to the ICU are shown in Table 1. Mean age was 66 years (IQR: 57.75–71); 68% of all patients were male (60% in the non-critical group [nCC] vs 76% in the CC group (p < 0.05)). The most common underlying comorbidities were high blood pressure (62 [42.5%]), followed by obesity (46 [31.5%]), diabetes (31 [21.1%]), and heart disease (27 [18.5%]). Our study groups were evenly matched in terms of comorbidities.
Baseline characteristics and COVID-19 parameters during admission.
| Total (n = 146) | Non-critical (nCC) (n = 75) | Critical (CC) (n = 71) | p | |
|---|---|---|---|---|
| Mean Age (± standard deviation) | 66.00 (57.75–71) | 61.89 (55.25–70) | 65.11 (60-72) | 0.162 |
| Men, n (%) | 99 (67.8) | 45 (60) | 54 (76) | 0.038 |
| Charlson index ≤ 4, n (%) | 141 (96.6) | 74 (99) | 66 (93) | 0.105 |
| Underlying comorbidity, n (%) | ||||
| High blood pressure | 62 (42.5) | 30 (40) | 32 (45) | 0.223 |
| ACE/ARB inhibitor therapy | 48 (32.9) | 21 (28) | 27 (38) | 0.536 |
| Obesity | 46 (31.5) | 22 (29.3) | 24 (33.8) | 0.197 |
| Diabetes | 31 (21.2) | 14 (18.7) | 17 (23.9) | 0.436 |
| History of thrombotic disease | 9 (6.1) | 5 (6.7) | 4 (5.6) | 0.346 |
| Heart disease | 27 (18.5) | 15 (20) | 12 (16.9) | 0.674 |
| Immunosuppression | 13 (8.9) | 7 (9.3) | 6 (8.5) | 0.852 |
| Kidney failure | 11 (7.5) | 5 (6.7) | 6 (8.5) | 0.683 |
| Smoking | 10 (6.8) | 4 (5.3) | 6 (8.5) | 0.525 |
| COPD | 10 (6.8) | 5 (6.7) | 5 (7) | 0.928 |
| Asthma | 8 (5.5) | 5 (6.7) | 3 (4.3) | 0.060 |
| OSA | 7 (4.8) | 1 (1.3) | 6 (8.5) | 0.720 |
| Active cancer | 3 (2.1) | 2 (2.7) | 1 (1.4) | 1.000 |
| Others | 13 (8.9) | 7 (9.3) | 6 (8.5) | 0.861 |
| SOFA, median (IQR) | 2 (2–4) | 1 (0–2) | 3 (1–4) | 0.000 |
| Respiratory SOFA | 1 (0–3) | 1 (0–2) | 2 (0–3) | 0.000 |
| Renal SOFA | 0 (0–1) | 0 (0–0) | 0 (0–1) | 0.123 |
| Coagulatory SOFA | 0 (0–1) | 0 (0–1) | 0 (0–1) | 0.122 |
| Cardiovascular SOFA | 0 (0–0) | 0 (0–0) | 0 (0–1) | 0.345 |
| Liver SOFA | 0 (0–0) | 0 (0–0) | 0 (0–0) | 0.053 |
| Neurological SOFA | 0 (0–0) | 0 (0–0) | 0 (0–0) | 0.432 |
| Non-survivors, n (%) | 40 (27.4) | 11 (14.7) | 29 (40.8) | 0.001 |
| Signs and symptoms during admission, n (%) | ||||
| Fever | 119 (85.1) | 59 (79.7) | 60 (84.5) | 0.364 |
| Cough | 86 (58.9) | 39 (52) | 47 (66.2) | 0.081 |
| Dyspnoea | 59 (40.4) | 31 (41.9) | 28 (39.4) | 0.815 |
| Muscle pain | 22 (15.1) | 11 (14.7) | 11 (15.5) | 0.889 |
| Diarrhoea | 19 (13.1) | 9 (12.0) | 10 (14.1) | 0.708 |
| Asthenia | 11 (7.53) | 9 (12.2) | 2 (2.8) | 0.051 |
| Neurological symptoms | 8 (5.47) | 5 (6.7) | 3 (4.2) | 0.314 |
| Sore throat | 3 (2.05) | 1 (1.40) | 2 (2.8) | 1.000 |
| Syncope | 3 (2.05) | 1 (1.40) | 2 (2.8) | 1.000 |
| Times, median (IQR) | ||||
| Time from disease onset to hospitalization (days) | 7 (3–9) | 7 (3–10) | 6 (3–9) | 0.890 |
| Time from disease onset to start of antiviral therapy (days) | 8 (7–11) | 7 (3–10) | 7 (5–10) | 0.412 |
| Time from disease onset to start of hydroxychloroquine therapy (days) | 7 (4–10) | 7 (3–10) | 7 (4–10) | 0.479 |
| Time from disease onset to start of interleukin-6 receptor blocker therapy (days) | 8 (7–11) | 9 (7–11) | 8 (6–10) | 0.148 |
| Time from disease onset to intensive care admission (days) | NA | NA | 9 (7–14) | NA |
| Time from hospital admission to intensive care admission (days) | NA | NA | 3 (1-5) | NA |
| Therapy during hospitalization | ||||
| No heparin, n (%) | 11 (7.53) | 11 (14.6) | 0 | NA |
| Low-dose heparin, n (%) | 111 (76.6) | 54 (72.0) | 57 (81.4) | 0.181 |
| High-dose heparin, n (%) | 40 (28) | 10 (13.3) | 30 (43) | 0.000 |
| 3 (4.22)a | 0.639 | |||
| Azithromycin, n % | 120 (82.2) | 57 (76.0) | 63 (88.7) | 0.054 |
| Interferon, n % | 12 (8.2) | 5 (6.7) | 7 (9.9) | 0.614 |
| Hydroxychloroquine, n % | 141 (96.6) | 70 (93.4) | 71 (100) | 0.059 |
| Lopinavir/ritonavir,(%) | 137 (93.8) | 68 (90.6) | 69 (97.2) | 0.102 |
| Interleukin-6 receptor blockers, n (%) | 87 (48.63) | 38 (50.7) | 49 (69.01) | 0.024 |
| 33 (46.5)a | 0.612 | |||
| Interleukin-1 receptor blockers, n (%) | 3 (2.1) | 1 (1.3) | 2 (2.8) | NA |
| Steroids, n % | 84 (59.7) | 30 (40) | 54 (77.1) | 0.000 |
| 23 (32.4)a | 0.339 | |||
COPD: chronic obstructive pulmonary disease; NA: not applicable; OSA: obstructive sleep apnoea; SOFA: sequential organ failure assessment.
Regarding symptoms and signs at the time of hospital admission, fever (119 [85%] patients), cough (86 [59%]) and dyspnoea (59 [40.4%]) were the most commonly reported. There were no significant differences between groups in terms of symptoms.
The mean time from onset of symptoms to hospital admission was 7 days (3-9) in both critical and non-critical patients. The time from disease onset to start of antiviral treatment was 8 days (7–11) in both groups. In the CC group, the mean time from onset of symptoms to admission to the ICU was 9 (7–14) days.
The in-hospital mortality rate was 27.4% in both groups, being significantly higher in the CC (40.8%) compared to the nCC (14.7%) group.
The different treatments administered to patients during their hospitalization are shown in Table 1. Although we observed a trend towards more hydroxychloroquine and azithromycin administration in the CC group (p = 0.05), more significant differences were observed in terms of treatment with high-dose heparin, IL-6 receptor inhibitors and corticosteroids, which were administered in 43%, 69% and 77.1% of patients in the CC group compared to 13.3% (p = 0.000), 50.7% (p = 0.024) and 40% (p = 0.000) patients in the nCC group, respectively.
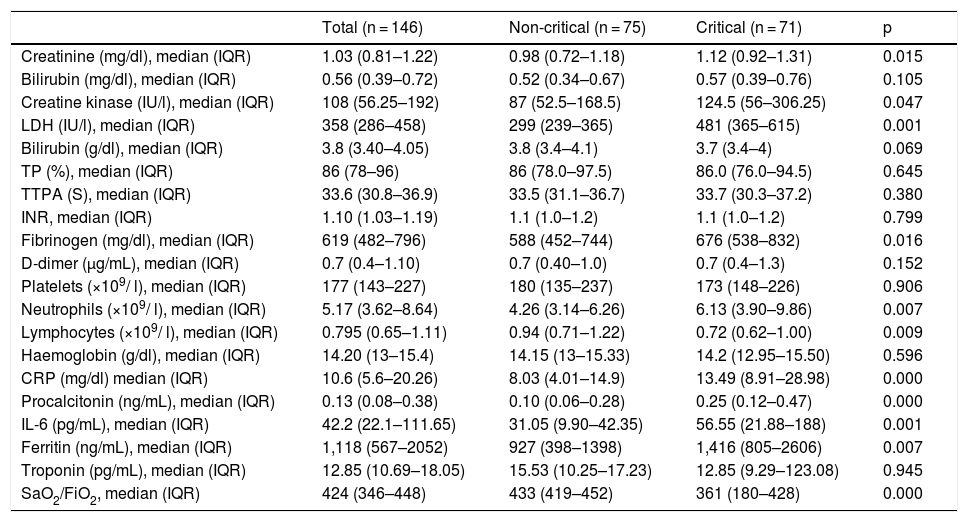
Table 2 shows the results of the haemogram, coagulation and biochemical tests performed at the time of hospital admission, including pro-inflammatory markers. In the blood count, neutropaenia and lymphcytopaenia was more frequently observed in the group of patients who required admission to critical care units. Regarding the biochemical tests, higher baseline levels of creatinine, creatine kinase and lactate dehydrogenase were found in the CC group. Patients who required admission to the ICU also had higher baseline levels of fibrinogen, IL-6, CRP, procalcitonin, and ferritin as pro-inflammatory markers. Finally, the SaO2/FiO2 ratio was significantly lower in the CC vs the nCC group. It is interesting to note that patients requiring admission to the ICU presented a considerably higher SOFA score on admission (Table 1). The SOFA score was calculated from 6 different organ system scores, In both groups, particularly in the CC group, the most important scores were obtained from the respiratory item (Tables 1 and 3).
Laboratory parameters of COVID-19 patients during hospital admission according to ultimate destination.
| Total (n = 146) | Non-critical (n = 75) | Critical (n = 71) | p | |
|---|---|---|---|---|
| Creatinine (mg/dl), median (IQR) | 1.03 (0.81–1.22) | 0.98 (0.72–1.18) | 1.12 (0.92–1.31) | 0.015 |
| Bilirubin (mg/dl), median (IQR) | 0.56 (0.39–0.72) | 0.52 (0.34–0.67) | 0.57 (0.39–0.76) | 0.105 |
| Creatine kinase (IU/l), median (IQR) | 108 (56.25–192) | 87 (52.5–168.5) | 124.5 (56–306.25) | 0.047 |
| LDH (IU/l), median (IQR) | 358 (286–458) | 299 (239–365) | 481 (365–615) | 0.001 |
| Bilirubin (g/dl), median (IQR) | 3.8 (3.40–4.05) | 3.8 (3.4–4.1) | 3.7 (3.4–4) | 0.069 |
| TP (%), median (IQR) | 86 (78–96) | 86 (78.0–97.5) | 86.0 (76.0–94.5) | 0.645 |
| TTPA (S), median (IQR) | 33.6 (30.8–36.9) | 33.5 (31.1–36.7) | 33.7 (30.3–37.2) | 0.380 |
| INR, median (IQR) | 1.10 (1.03–1.19) | 1.1 (1.0–1.2) | 1.1 (1.0–1.2) | 0.799 |
| Fibrinogen (mg/dl), median (IQR) | 619 (482–796) | 588 (452–744) | 676 (538–832) | 0.016 |
| D-dimer (μg/mL), median (IQR) | 0.7 (0.4–1.10) | 0.7 (0.40–1.0) | 0.7 (0.4–1.3) | 0.152 |
| Platelets (×109/ l), median (IQR) | 177 (143–227) | 180 (135–237) | 173 (148–226) | 0.906 |
| Neutrophils (×109/ l), median (IQR) | 5.17 (3.62–8.64) | 4.26 (3.14–6.26) | 6.13 (3.90–9.86) | 0.007 |
| Lymphocytes (×109/ l), median (IQR) | 0.795 (0.65–1.11) | 0.94 (0.71–1.22) | 0.72 (0.62–1.00) | 0.009 |
| Haemoglobin (g/dl), median (IQR) | 14.20 (13–15.4) | 14.15 (13–15.33) | 14.2 (12.95–15.50) | 0.596 |
| CRP (mg/dl) median (IQR) | 10.6 (5.6–20.26) | 8.03 (4.01–14.9) | 13.49 (8.91–28.98) | 0.000 |
| Procalcitonin (ng/mL), median (IQR) | 0.13 (0.08–0.38) | 0.10 (0.06–0.28) | 0.25 (0.12–0.47) | 0.000 |
| IL-6 (pg/mL), median (IQR) | 42.2 (22.1–111.65) | 31.05 (9.90–42.35) | 56.55 (21.88–188) | 0.001 |
| Ferritin (ng/mL), median (IQR) | 1,118 (567–2052) | 927 (398–1398) | 1,416 (805–2606) | 0.007 |
| Troponin (pg/mL), median (IQR) | 12.85 (10.69–18.05) | 15.53 (10.25–17.23) | 12.85 (9.29–123.08) | 0.945 |
| SaO2/FiO2, median (IQR) | 424 (346–448) | 433 (419–452) | 361 (180–428) | 0.000 |
APTT: activated partial thromboplastin time; CRP: C-reactive protein; LDH: lactate dehydrogenase; IL-6: interleukin-6; IQR: interquartile range; PT: prothrombin time.
Normal range: TP (11–13.5 s); APTT (27–40 s); Fibrinogen (130–400 mg/dl); D-dimer (<0.5 µg/mL); Platelet count (150 × 109/ l-400 × 109/l); Lymphocyte count (1.2–3.5 × 10⁹/l); Neutrophil count (1.4–6.5 × 10⁹/l); LDH (135–225 IU/l); CK (34–145 IU/l); PCR (<0.5 mg/mL); Creatinine (0.5–0.9 mg/mL); Bilirubin (0.15–1.2 mg/ml); Albumin (3.5–5.2 g/dl); Procalcitonin (0–0.5 ng/mL); IK6 (0–3.4 pg/mL); Ferritin (15–150 ng/mL); Troponin (0–210 pg/mL).
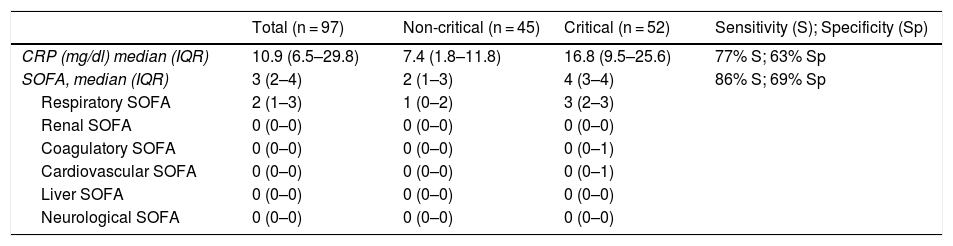
Laboratory characteristics of patients in the validation cohort, sensitivity and specificity, and cut-off points.
| Total (n = 97) | Non-critical (n = 45) | Critical (n = 52) | Sensitivity (S); Specificity (Sp) | |
|---|---|---|---|---|
| CRP (mg/dl) median (IQR) | 10.9 (6.5–29.8) | 7.4 (1.8–11.8) | 16.8 (9.5–25.6) | 77% S; 63% Sp |
| SOFA, median (IQR) | 3 (2–4) | 2 (1–3) | 4 (3–4) | 86% S; 69% Sp |
| Respiratory SOFA | 2 (1–3) | 1 (0–2) | 3 (2–3) | |
| Renal SOFA | 0 (0–0) | 0 (0–0) | 0 (0–0) | |
| Coagulatory SOFA | 0 (0–0) | 0 (0–0) | 0 (0–1) | |
| Cardiovascular SOFA | 0 (0–0) | 0 (0–0) | 0 (0–1) | |
| Liver SOFA | 0 (0–0) | 0 (0–0) | 0 (0–0) | |
| Neurological SOFA | 0 (0–0) | 0 (0–0) | 0 (0–0) |
CRP: C-reactive protein; SOFA: sequential organ failure assessment.
Multiple regression: OR SOFA: 2.46 (1.54–3.95); OR CRP: 1.08 (1.01–1.16).
Hosmer-Lemeshow test: χ2 4.71; 8 gl; p = 0.785.
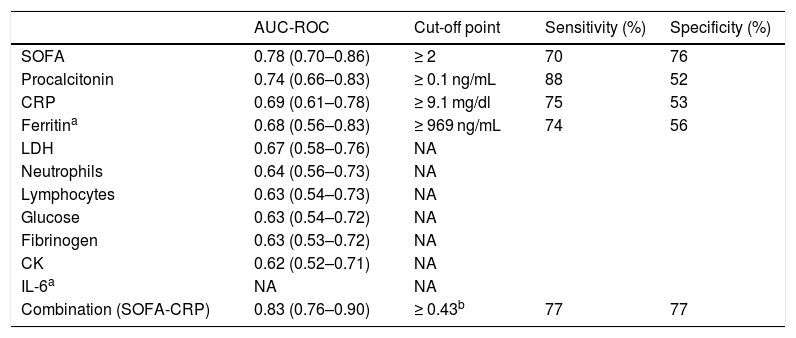
Table 4 shows the AUCs for the parameters with significant differences between the nCC and CC groups and the cut-off points of the parameters that maintained their statistical significance in the logistic regression analysis. These variables were SOFA scale ≥ 2 (70% sensitivity and 76% specificity) and CRP ≥ 9.1 (75% sensitivity and 53% specificity). We also observed that the combined SOFA score and CRP level gave a sensitivity and specificity of 77%, which was significantly higher than the ROC curves for the SOFA score as an isolated variable. The AUC observed here (0.8) suggests that the SOFA score and CRP taken together at the time of hospital admission has a high predictive value.
AUC-ROC and cut-off point, sensitivity and specificity of COVID-19 parameters to predict the likelihood of critical care at the time of admission.
| AUC-ROC | Cut-off point | Sensitivity (%) | Specificity (%) | |
|---|---|---|---|---|
| SOFA | 0.78 (0.70–0.86) | ≥ 2 | 70 | 76 |
| Procalcitonin | 0.74 (0.66–0.83) | ≥ 0.1 ng/mL | 88 | 52 |
| CRP | 0.69 (0.61–0.78) | ≥ 9.1 mg/dl | 75 | 53 |
| Ferritina | 0.68 (0.56–0.83) | ≥ 969 ng/mL | 74 | 56 |
| LDH | 0.67 (0.58–0.76) | NA | ||
| Neutrophils | 0.64 (0.56–0.73) | NA | ||
| Lymphocytes | 0.63 (0.54–0.73) | NA | ||
| Glucose | 0.63 (0.54–0.72) | NA | ||
| Fibrinogen | 0.63 (0.53–0.72) | NA | ||
| CK | 0.62 (0.52–0.71) | NA | ||
| IL-6a | NA | NA | ||
| Combination (SOFA-CRP) | 0.83 (0.76–0.90) | ≥ 0.43b | 77 | 77 |
CK: creatine kinase; CRP: C-reactive protein; IL-6: interleukin-6; NA: not applicable; SOFA: sequential organ failure assessment.
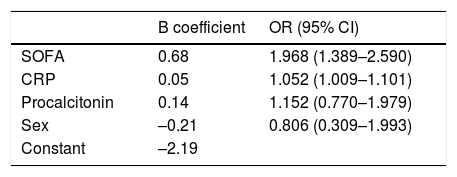
In our multivariate logistic regression model, a high SOFA score gave an odds ratio of 1,968 for the need for admission to the ICU, and a high CRP value during admission was associated with an odds ratio of 1,052 for the need for ICU admission (Table 5). The presence of high levels of procalcitonin was also associated with an odds ratio of 1.152 for the need for critical care, although it was finally eliminated due to low specificity in the AUC.
The validation cohort included 97 patients with a mean age of 65 years (57-70), of which 71 (73%) were male and 96 (96%) had a Charlson index ≤ 4. The SOFA variables collected for the validation cohort are shown in Table 3. The accuracy of the SOFA score was similar in both the validation and development cohorts, with an AUC of 0.89 in the validation cohort (95% CI: 0.82–0.95), a sensitivity of 86%, and a specificity of 72% (p = 0.236 compared to the development cohort).
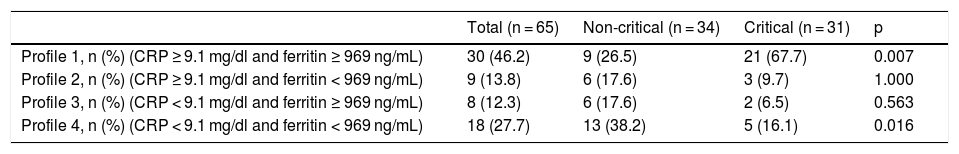
Table 6 shows the distribution of patients in the nCC and CC groups according to their inflammatory profiles on arrival at the hospital. It is interesting to note that 67.7% of patients with inflammatory profile 1 (CRP > 9.1 mg/dl and ferritin > 969 ng/mL) during admission required critical care, while only 16.1% of those admitted with inflammatory profile 4 (CRP < 9.1 mg/dl and ferritin < 969 ng/mL) required critical care.
Inflammatory profile in COVID-19 patients during admission, according to their ultimate destination.
| Total (n = 65) | Non-critical (n = 34) | Critical (n = 31) | p | |
|---|---|---|---|---|
| Profile 1, n (%) (CRP ≥ 9.1 mg/dl and ferritin ≥ 969 ng/mL) | 30 (46.2) | 9 (26.5) | 21 (67.7) | 0.007 |
| Profile 2, n (%) (CRP ≥ 9.1 mg/dl and ferritin < 969 ng/mL) | 9 (13.8) | 6 (17.6) | 3 (9.7) | 1.000 |
| Profile 3, n (%) (CRP < 9.1 mg/dl and ferritin ≥ 969 ng/mL) | 8 (12.3) | 6 (17.6) | 2 (6.5) | 0.563 |
| Profile 4, n (%) (CRP < 9.1 mg/dl and ferritin < 969 ng/mL) | 18 (27.7) | 13 (38.2) | 5 (16.1) | 0.016 |
Calculated in patients with ferritin and CRP lab results.
We developed and validated a clinical risk scale to predict the progression of critical illness among patients hospitalized for COVID-19. The model performed well, showing a precision of 0.8 based on the AUC of both the development and validation cohorts.
The results of this retrospective study show that the presence of CRP levels ≥9.1 mg/dl and a SOFA score ≥2 in COVID-19 + patients at the time of hospital admission are independent predictors, with a sensitivity and specificity of 77%, of the need for admission to the ICU. This is the first time the combination of both these markers has been used to predict admission to intensive care in COVID-19 patients.
The association of the SOFA score with severity in COVID-19 patients has already been reported in other studies5,6. However, the score of 2 observed in our series gave an acceptable AUC of 0.78 (0.70–0.86), which is in fact the cut-off point for distinguishing between septic and non-septic patients16. Although this applies to bacterial infections, viral infections can lead to sepsis, and nearly 40% of adults with community-acquired pneumonia due to viral infection develop sepsis22.
In our series, the SOFA score was shown to be a predictor of the need for critical care after correcting for the remaining main covariates, such as CRP, procalcitonin, and sex. Tables 1 and 3 show the importance of the respiratory item in the SOFA score at the time of admission, as expected.
Regarding CRP, other authors have reported that high values are related to prognosis and severity in COVID-1923,24. In our series, the role of CRP as a predictor of the need for critical care maintained its significance in the univariate analysis, and the cut-off point of 9 mg/dl proved to be the most sensitive and specific factor to discriminate between patients who will require critical care versus those who will not. The role of CRP as a predictive factor was maintained in the multivariate analysis. As CRP is mainly synthesised in response to pro-inflammatory cytokines10, particularly IL-6 and to a lesser degree IL-1, and tumour necrosis factor alpha (TNF-α), it should be determined at the time of admission, since it is more accessible than the other proxies of pro-inflammatory cytokine.
In our series, a combination of CRP and SOFA yielded an AUC of 0.83 (0.76–0.90). This is excellent for predicting the need for intensive care during admission, and to our knowledge had not been previously reported. It is also plausible on a biological level, since, as in other infectious processes25, the combination of one of the main markers of inflammation (CRP) with a validated organ failure scale (SOFA) can provide a more accurate diagnosis/prognosis in patients with COVID-19.
Another important finding in this study has been that almost 70% of patients admitted with CRP levels of over 9.1 mg/dl and ferritin of over 969 ng/mL required critical care. This suggests that these parameters can also accurately predict prognosis. An inflammatory profile consisting of CRP < 9.1 mg/dl and ferritin < 969 ng/mL would help identify patients that are unlikely to require critical care. In fact, only 16% of patients in our series with this profile required admission to the ICU.
As mentioned previously, CRP is involved in the IL-6 pathway. IL-1 and IL-6 have been shown to trigger acute activation of endothelial cells24 causing high levels of these and other cytokines in critically ill patients26. Ferritin is also involved in the IL-1 pathway10,11, therefore, the combination of CRP and ferritin may constitute an inflammatory pattern with prognostic potential.
Procalcitonin has been associated with prognosis in patients with an inflammatory response similar to that found in our series27. However, its role as a predictor of critical care was not maintained in the multivariate analysis, perhaps due to its poor diagnostic performance in viral infections28.
Sex has been described in other series as a prognostic factor8,9 of overall mortality. However, in our study, male sex did not predict an increased risk of requiring critical care. The same was true of time to hospital admission or to start of treatment. Comorbidity derived from underlying diseases upon arrival at the hospital was similar in both groups, except for asthma, which has been identified in other studies29. Regarding treatment, the group of critically ill patients received more than expected amount of high-dose heparin, interleukin receptor inhibitors, and corticosteroids, due to their severity.
Other authors have suggested that LDH, CK, and white blood cells can be prognostic factors3,5,7,30, particularly of viral load (LDH and CK)30. In our case, they were not included in the multivariate analysis because they presented a lower AUC than that required for diagnosis.
Our study has certain limitations due to its retrospective nature, and some laboratory data were missing in some patients. We used a small sample to construct the risk scale and a relatively small sample for validation purposes. Despite this small sample size, the inclusion of randomized adult COVID-19 patients is representative of the number of cases treated in critical care units.
Finally, in general and as expected, the in-hospital mortality rate in patients who required admission to the ICU was more than double that of patients not requiring critical care. The mortality rate reported here is consistent with that published in other series3, and shows that it is crucial to identify this group of patients at the time of admission. As patients with a SOFA score > 2 and high levels of CRP appear more likely to require critical care, additional therapeutic actions could be taken to reduce the need for such care and thus reduce the in-hospital mortality rate. However, further studies and prospective trials are needed to support this finding.
ConclusionCOVID-19 patients with a SOFA score ≥ 2 and CRP ≥ 9.1 mg/mL could constitute a population that is most likely to require critical care.
FundingThe authors have not received any specific grant from any financial institution in the public, commercial or non-profit sectors.
AuthorshipLMVR designed the study. Data were collected by ESB, DEM, PAP and RG. Data analysis was performed by LMVR. LMVR and JRGP wrote the manuscript with input from all authors. MVSH critically reviewed the manuscript for important intellectual content. All authors approved the final version of the study.
Conflict of interestsNone.
We would like to thank María-Victoria Mateos from the Department of Haematology for her help in reviewing this document, and also Pedro Luis Sánchez-Fernández from the Department of Cardiology and all the doctors and healthcare personnel involved in the COVID-19 Task Force.
We would also like to thank all the members of the Department of Anaesthesiology and Resuscitation: Jordana Almeida, Daniel Álvarez, Laura Alonso, Begoña Alonso, Marta Criado, Isabel de Celis, Alberto de Diego, Esther del Barrio, Carlos Espinel, Iolanda Freire, Emilio García, Isabel Garrido, Eugenia González, María Heredia, Felipe Hernández, Janna Hermmanova, Jose Luis Iglesias, Elisa Jausoro, Diego Leoz, Adela López, Rocío López, Pamela López, Virgilio Martín, Laura Nieto, M. Jesús Pascual, Diego Pérez, Isabel Pingarrón, Rosa Prieto, J.M. Rodríguez, Mercedes Rojo, Cruz Ruano, Daniel Salgado, Lucio San Norberto, Pilar Sánchez, Manuel J. Sánchez, Eduardo Sánchez, Francisco J. Sánchez, David Sánchez, Valentín Santana, Ignacio Trejo, Joaquín Valdunciel, Ana Vara, M. José Villória, Gema Yusta.
Finally, our thanks go to all the COVID-19 patients admitted to the Salamanca University Hospital, as well as their families.
Jesús F. Bermejo-Martín, MD, PhD. Biomedical research group on sepsis (BioSepsis), IBSAL. Faculty of Medicine, University of Salamanca.
Cristina Doncel. Biomedical research group on sepsis (BioSepsis), IBSAL. Faculty of Medicine, University of Salamanca.
José María Bastida, MD, PhD. Haematology Department, Salamanca University Hospital-IBSAL. Faculty of Medicine, University of Salamanca.
Azucena Hernández-Valero, MD. Department of Anaesthesia and Resuscitation, Salamanca University Hospital-IBSAL. Faculty of Medicine, University of Salamanca.
Carolina Jambrina-García Montoto, MD. Department of Anaesthesia and Resuscitation, Salamanca University Hospital-IBSAL. Faculty of Medicine, University of Salamanca.
José Sánchez-Crespo, MD. Department of Anaesthesia and Resuscitation, Salamanca University Hospital-IBSAL. Faculty of Medicine, University of Salamanca.
Pablo Alonso-Hernández, MD, PhD. Department of Anaesthesia and Resuscitation, Salamanca University Hospital-IBSAL. Faculty of Medicine, University of Salamanca.
Domingo Bustos-García, MD. Department of Anaesthesia and Resuscitation, Salamanca University Hospital-IBSAL. Faculty of Medicine, University of Salamanca.
Antonio Rodríguez-Calvo, MD, PhD. Department of Anaesthesia and Resuscitation, Salamanca University Hospital-IBSAL. Faculty of Medicine, University of Salamanca.
Raúl Alzibeíro, MD. Haematology Department, Salamanca University Hospital-IBSAL. Faculty of Medicine, University of Salamanca.
Alberto Hernández-Sánchez, MD. Haematology Department, Salamanca University Hospital-IBSAL. Faculty of Medicine, University of Salamanca.
Rocío Eiros, MD. Cardiology Department, Salamanca University Hospital-IBSAL. Faculty of Medicine, University of Salamanca.
M. Carmen Vargas, MD, PhD. Department of Anaesthesia and Resuscitation, Salamanca University Hospital-IBSAL. Faculty of Medicine, University of Salamanca.
María Ángeles Martín, MD. Department of Anaesthesia and Resuscitation, Salamanca University Hospital-IBSAL. Faculty of Medicine, University of Salamanca.
Teresa López, MD. Department of Anaesthesia and Resuscitation, Salamanca University Hospital-IBSAL. Faculty of Medicine, University of Salamanca.
José Alfonso Sastre, MD, PhD. Department of Anaesthesia and Resuscitation, Salamanca University Hospital-IBSAL. Faculty of Medicine, University of Salamanca.
José Carlos Garzón, MD, PhD. Department of Anaesthesia and Resuscitation, Salamanca University Hospital-IBSAL. Faculty of Medicine, University of Salamanca.
José Luis González, MD. Department of Anaesthesia and Resuscitation, Salamanca University Hospital-IBSAL. Faculty of Medicine, University of Salamanca.
Mar Fernández, MD. Department of Anaesthesia and Resuscitation, Salamanca University Hospital-IBSAL. Faculty of Medicine, University of Salamanca.
Belén García, MD. Department of Anaesthesia and Resuscitation, Salamanca University Hospital-IBSAL. Faculty of Medicine, University of Salamanca.
M. Magdalena Muñoz, MD. Department of Anaesthesia and Resuscitation, Salamanca University Hospital-IBSAL. Faculty of Medicine, University of Salamanca.
María Isabel Martínez, MD. Department of Anaesthesia and Resuscitation, Salamanca University Hospital-IBSAL. Faculty of Medicine, University of Salamanca.
Gonzalo García, MD. Department of Anaesthesia and Resuscitation, Salamanca University Hospital-IBSAL. Faculty of Medicine, University of Salamanca.
Agustín Díaz, MD, PhD. Department of Anaesthesia and Resuscitation, Salamanca University Hospital-IBSAL. Faculty of Medicine, University of Salamanca.
Edgard Marcano, MD. Department of Critical Care Medicine, Salamanca University Hospital-IBSAL. Faculty of Medicine, University of Salamanca.
The following is Supplementary data to this article:
The members of the COVID Working Group, Hospital Universitario de Salamanca-IBSAL, are presented in Appendix A.
Please cite this article as: Vaquero-Roncero LM, Sánchez-Barrado E, Escobar-Macias D, Arribas-Pérez P, González de Castro R, González-Porras JR, et al. Proteína C reactiva y escala SOFA: una simple escala como factor predictivo temprano de la necesidad de cuidados críticos en los pacientes con neumonía causada por COVID-19 en España. Rev Esp Anestesiol Reanim. 2021;68:513–522.
articles

www.publicationethics.org.