Introduction
Recent decades have seen the development of different methods and strategies aimed at formulating the outcomes of health services so that these can be measured and the quality of care enhanced.1-3 Some of these strategies have been designed to establish supplier profiles, compare services and identify those the yield the best results (called "benchmarks"). Identifying benchmarks has made it possible to establish goals for improvement which have been used, in the absence of standard values, as alternative reference systems.4 The theoretical basis for benchmarking in health care has been laid out in a number of articles dealing mainly with hospital care.5-8 Experiences in the primary care setting, in contrast, are scarce.9
In Barcelona, finalization of the administrative reforms in the primary care service has given way to efforts centered on fomenting high-quality service and improving service evaluation.10-12 In this connection the Consorci Sanitari de Barcelona (CSB) developed a benchmarking method as a strategy for improving the performance of primary care teams (PCT) and for increasing the transparency of the findings obtained by public health services. This latter aspect facilitates cooperation and commitment by members of a given community, and thus potentiates the social capital generated by public services.13
In developing this new dynamic it was considered fundamental to involve professionals through the formation of anadvisory group.14 In accordance with the indicators and recommendations proposed by the advisory group, we aimed to identify the PCT that produced the best overall results and to compare their performance with that of other PCT.
Methods
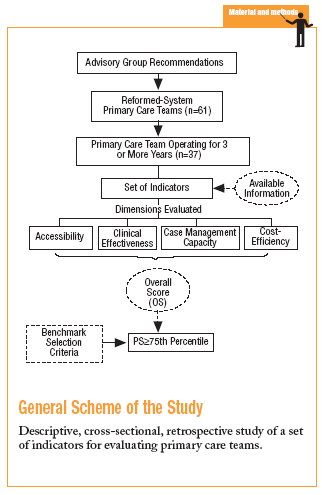
This was a descriptive, cross-sectional, retrospective study of a set of indictors for evaluating PCT, carried out in 2002. A total of 37 PCT in the city of Barcelona (northeastern Spain) that had been operating for more than 2 years were included in the evaluation; this period was considered the minimum time needed for quality improvement activities to be implemented. The PCT served a reference population of 771811 inhabitants, i.e., 51% of the city's population.
Indictors were chosen from a set of factors identified by an advisory group in 2003 as having high priority.14 A total of 57 indicators were eventually chosen for study (Annex).
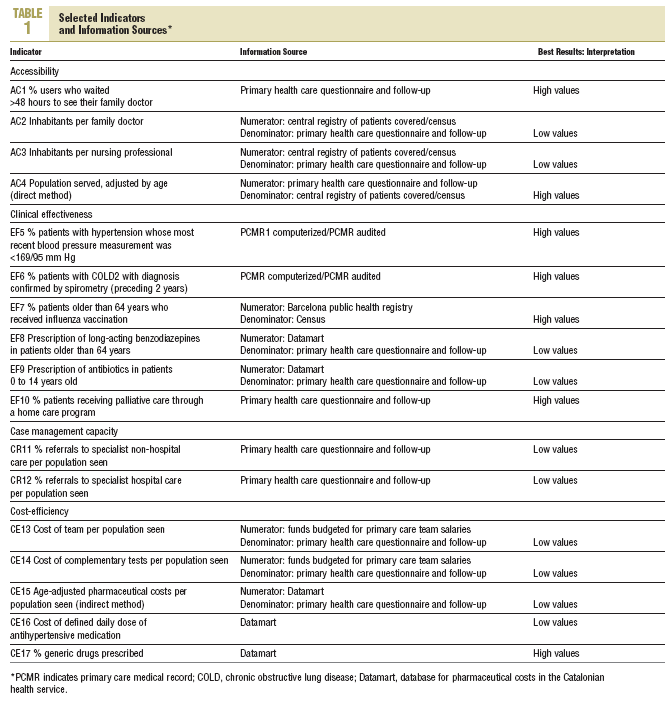
Because of the retrospective nature of the study, the choice of indicators was conditioned by the information available in different databases used by the CSB to evaluate PCT. The databases provided sufficient information for 20 of the indicators. Three indicators of prescribing practices were excluded to avoid overrepresentation, and the 17 final indicators chosen were grouped into 4 basic primary care dimensions:2,15 accessibility, clinical effectiveness, case management capacity, and cost-efficiency (Table 1). To develop the indicators and identify benchmarks we followed the recommendations for minimum methodological requirements proposed by the advisory group (Table 2).
The benchmark group was identified from the overall score for the results for each PCT, defined as the weighted sum of the scores in each of the four dimensions. In accordance with the advisory group consensus, the weighting assigned to each dimension was 30% for accessibility, 40% for clinical effectiveness, 10% for case management capacity, and 20% for cost-efficiency.
At the benchmark group we chose PCT above the 75th percentile for overall score. We excluded from the benchmark group those PCT that scored below 5 on any of the dimensions.
As descriptive variables for the PCT we used time operating under the reformed administrative system, number of visits by the population served, percentage of the population >64 years of age, and familial economic capacity index (FECI), an overall indicator incorporating information from the census (income, telephone bills, type of vehicle, property value, etc).16
The results for the benchmark group and the other PCT in each dimension are reported. Mean value and 25th, 50th, and 75th percentiles were calculated with the Tukey method, and percentage variation in the results between groups was reported. Student's t test was used to compare mean values, and the differences were considered significant at P<.05. All statistical analyses were done with version 9.0 of the SPSS.
Results
We identified 9 PCT as benchmark teams (Table 3). Two PCT that scored above the 75th percentile were excluded because they scored below 5 on case management capacity.
The benchmark group comprised teams that had been operating for longer under the reformed administrative system, with a mean of 12 years (95% CI, 8.6414.36 years), whereas mean time for the other teams was 8 years (95% CI, 6.569.58 years); this difference was statistically significant (t: 2.24; P<.031). The FECI indicated that the population served by the benchmark group had a higher economic capacity (50th percentile for the benchmark group: 75.9; for the population served by other PCT: 93.3). The percentage of the population older than 65 years was similar in the 2 groups (benchmark: 20.14%, 95% CI, 16.90-23.39; other PCT: 21.60%, 95% CI, 20.32-22.88), as was the usage rate of the population (benchmark group: 8.02 visits per person, 95% CI, 7.02-9.01; other PCT: 7.92, 95% CI, 7.31-8.53).
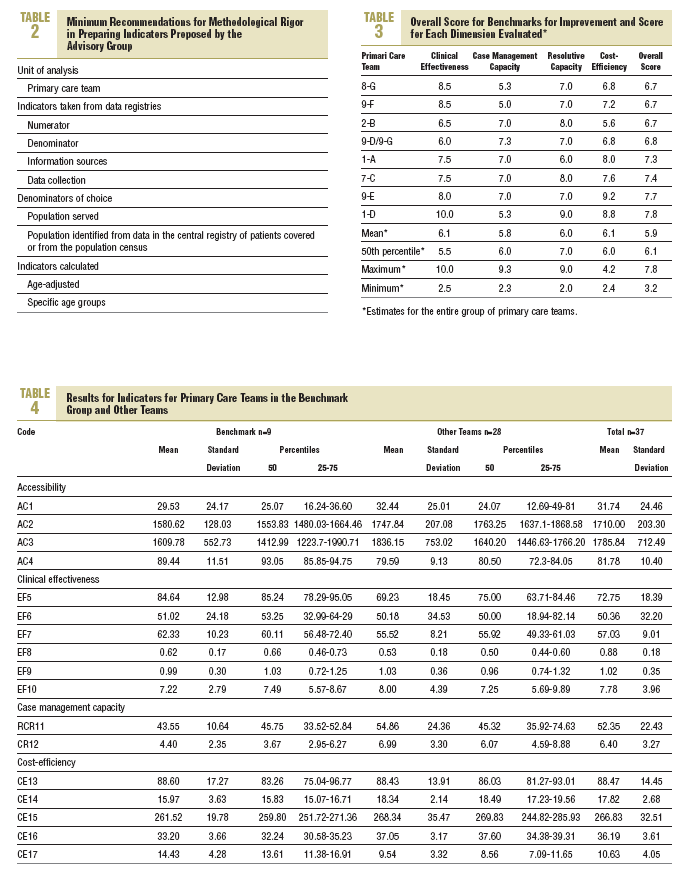
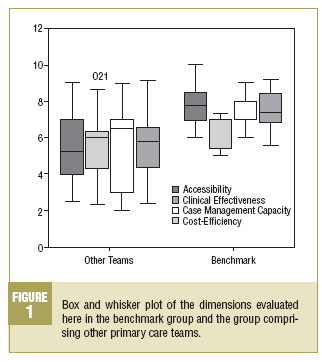
Table 4 summarizes our descriptive analysis of the 17 indicators for the 37 PCT together, and for the 9 teams in the benchmark group and the 28 teams in the other group. Figure 1 shows that the benchmark group obtained higher scores than the other PCT on all four dimensions analyzed, with the greatest difference between groups for the clinical effectiveness dimension.
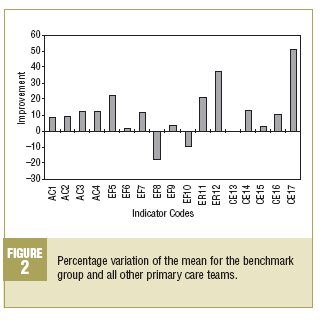
Of the 17 indicators evaluated here, scores were higher in the benchmark group than in the other PCT for 14, the same in both groups for 1, and lower in the benchmark group for 2. The benchmark group obtained better results for indicators of generic drug prescribing (51% better), hospital referrals (37%), follow-up of patients with hypertension (23%), and non-hospital referrals (21%). The indicators that showed a higher score in the group of other PCT was prescribing of benzodiazepines for patients more than 64 years of age and patients receiving palliative care at home (Figure 2).
Discussion
The methodological proposals incorporated through the benchmarking strategy made it possible to compare PCT and to identify a group of PCT that obtained better overall results in the dimensions evaluated here. The novel aspect of the system we used is that it integrated a number of indicators into a single overall score. This provided a general evaluation of PCT and also identified areas needing improvement with regard to basic attributes of primary care as the backbone of the health system.2,15
We excluded 2 PCT from the benchmark group because they did not reach the minimum score on one dimension--a criterion also used by the National Health Service in Britain.17 As in similar studies, the benchmark group did not always obtain the best results for all indicators.18 It is interesting to note that PCT in the benchmark group had been working under the reformed administrative system for significantly longer than other PCT.
The dimension for which the largest number of indicators could be studied was cost-efficiency, followed by accessibility. It was not possible to evaluate the continuity of care and user satisfaction/health outcomes dimensions. This indicates that information collection and follow-up in PCT places more emphasis on indicators of activity, structure, pharmaceutical practice, and cost indicators than on process and outcome indicators.
The lack of studies on benchmarking for primary care services limits the comparisons that can be drawn; however, indicators similar to those analyzed here are usually chosen for outcome evaluations.2,3 Influenza vaccination,2,3,19,20 the number of inhabitants per physician and nursing professional, waiting time,2,19 and the prescribing of antibiotics, benzodiazepines, and generic drugs2,21,22 are some of the outcomes identified to date.
Among the limitations of this study we note those related with a large part of the data obtained from internal registries used by the PCT, as these registries have not been validated. The representativeness of the variables obtained by sampling medical records may be affected by size of the record, and by underrecording in medical records held in computer-readable form. Nevertheless, this information was obtained from the system to evaluate contract fulfillment, which is regularly monitored, and thus no specific data recording measures were needed for the purposes of our benchmarking exercise. Another problem noted frequently is the difference in demographic characteristics between the populations being compared, and adjustment for disease severity.8,23-25 In the present study some indicators were adjusted for age of the population, others were recorded by age group, and in still other cases the indicator could not be adjusted, or adjustment was considered unnecessary. Data on morbidity in patients
seen at the centers that took part in this study were not available, so it was not possible to adjust the data for
disease severity.
Earlier studies showed that among the promoters and users of benchmarking results, including health care professionals, health authorities, service users and service providers, it is the latter who benefit most from such studies, as the results allow service providers to generate and stimulate internal dynamics for improvement.6,26
Dissemination of the results is a fundamental feature of benchmarking strategies, and the finding of our study have been sent to primary care health professionals and service providers, scientific societies, and the media. In addition, the results of the benchmarking exercise reported here are available on open access from the CSB website.27
We feel that the importance of this benchmarking experience lies in the fact that in our setting, this is the first such exercise to be promoted by the health administration in the area of primary care.28,29 The CSB should undertake further studies to determine whether the results improve after this strategy is implemented. This will require evaluation of its acceptability, the results of clinical practice, and the impact on decision-making by health care providers. Improvements will be needed in the validation of data used to measure clinical effectiveness, and in some cases it will become necessary to use a larger sample of medical records. Methods and techniques will need to be developed to measure aspects related with accessibility, case management capacity and continuity of care, among other elements. In this connection the CSB, in its further efforts to improve primary care services, is now analyzing telephone access to PCT, the use of protocols to coordinate care between the primary care center and the reference hospital, user satisfaction, and other outcome indicators that will allow us to obtain a view of the PCT for all dimensions requiring evaluation. Additional studies will be needed to determine the effectiveness of this strategy.


