


This study analyses the relationship between identification and loyalty and also compares the perceptions of two groups of key stakeholders (professors and graduates) of a public institution of higher education, as mechanisms to gain competitiveness against private institutions. To carry out this research, an on-line survey was conducted and the results were analyzed through a system of structural equations using the partial least squares technique (PLS-SEM). The results reveal that identification influences loyalty, and that there are also significant differences in the perception between professors and graduates, being the relationship between identification and loyalty more intense in the former group than the latter. Several significant implications can be derived from our research for the management of higher education institutions.
In recent years, factors such as globalization, an increase in the privatization of higher education institutions (hereinafter HEIs), a greater impact of financial crises and new information and communication technologies (ICTs), Bologna Process, have led to HEIs adopting marketing concepts, to ensure their survival (Cervera, Schlesinger, & Iniesta, 2012; Melewar, Foroudi, Dinnie, & Nguyen, 2018).
Several investigations have contrasted that the existence of shared identities or values between stakeholders and the HEI is a key element for its survival because it increases studentś success levels, the probability of making donations, feeling satisfied, as well as proposing improvement actions, defending it even when others criticize it and participating in the future actions of the institution (Stephenson & Yerger, 2014).
In HEIs, loyalty should have an impact on their success, either for example, through behavioural intentions, positive recommendations through word of mouth or in future enrolment behaviours (Heffernan, Wilkins, & Butt, 2018), and it should also be positively related to the ability of the university to attract and maintain relationships with different stakeholders over time (Iskhakova, Hoffmann, & Hilbert, 2017; Shahsavar & Sudzina, 2017).
In the context of HEIs, recent studies have analyzed the relationship between identification and loyalty from different approaches. Some studies have investigated the relationship of both variables separately. So, for example, identification is related to reputation or studentś image (Wilkins & Huisman, 2015). Loyalty has been related to the image or satisfaction of students (Casidy & Wymer, 2015; Shahsavar & Sudzina, 2017) or graduateś image (Doña & Luque, 2017). In other cases, both variables were studied jointly but in a single interest group, where identification is related to the behaviour intention of students (Balaji, Roy, & Sadeque, 2016) or professors (Takaki, Bravo, & Martinez, 2015). Although these studies seem to confirm that identification by students improves their image or behaviour intention, they do not take into account its evaluation, which produces a true loyalty towards the institution through the analysis of different stakeholders such as professors and graduates, and if at the same time, there are differences in perception in the relationship between loyalty and identification between both groups.
Therefore, the aim of this research is on the one hand, to see what kind of relationship there can be between identification and loyalty of professors and graduates and on the other hand, to explore the possible existence of significant differences in the perception of this relationship between professors and graduates.
The justification for comparing the perceptions of professors and graduates is for several reasons. An increase in market competitiveness and the implementation of the Bologna Plan (1999) have led to greater specialization and shorter years of study. This has led to HEIs having a greater number of specialized professors to meet the greater demand of graduates in postgraduate courses such as Masters and Doctorates, so identification and loyalty is vital so as not to lose competitiveness. On the other hand, due to the fact that professors and graduates have had previous experiences with the institution, this has enabled them to generate links with it and to evaluate the social and academic relevance of its training (Schlesinger, Cervera, & Calderón, 2014); in addition, their evaluations of the institution will influence both their subsequent behaviours and those of other stakeholders, either through subsequent courses or recommendations and donations (Doña & Luque, 2017). These arguments highlight the relevance of these stakeholders in the survival of HEIs.
The originality of this study is to analyze if the identification perceived by professors and graduates of a public university generates true loyalty and if there are significant differences between both groups. The results obtained will enable different managers to provide the necessary strategies to obtain competitive advantages within the university system.
The rest of the paper is structured as follows. In the following section, a review of the literature is carried out and the hypotheses that will be tested empirically are formulated. Next, the methodology used is detailed, the results obtained are shown and discussed. Finally, the conclusions and implications for management, as well as the limitations and future lines of research are collected.
2Review of literature and hypotheses2.1Identification and loyalty in higher educationThe identification and stakeholder relationship is a mechanism of maximum union between the organization and the stakeholder resulting from a voluntary, active and selective relationship, maintained by the stakeholder, with the purpose of satisfying one or more of his/her personal characteristic needs that generate commitments with the organization, helping him/her to achieve its objectives (Sen, Johnson, Bhattacharya, & Wang, 2015). Besides, this cognitive state will influence the affective states of the different stakeholders with respect to the organization, and their subsequent behaviour towards the organization (Wolter, Bock, Smith, & Cronin, 2017). The identification of stakeholders with a type of organization, such as the university, is produced when they perceive and feel that the distinctive and differentiating features of the organization are self-defined and correspond to their own, generating behavioural intentions (Ali, Zhou, Hussain, Nair, & Ragavan, 2016; Ashforth & Mael, 1992).
As for the concept of loyalty, it refers to the feeling of loyalty formed by affective and behavioural aspects (Casanoves, Kuster, & Vila, 2017). The affective components indicate that a stakeholder can show preference towards a certain organization, although that affinity feeling does not imply an acquisition of what it can offer (Bloemer & De Ruyter, 1999; Uncles, Dowling, & Hammond, 2003). The aim of the behavioural elements is to analyze the influence that loyalty has on the real and repetitive behaviour of stakeholders towards their favourite organization (Farquhar & Meidan, 2010; Oliver, 1999). Other investigations include both elements, in order to carry out a broader evaluation of loyalty (Casidy & Wymer, 2015; Coelho, Rita, & Santos, 2018).
2.2Relationship between identification and loyalty in higher educationThe social identification theory (Tajfel & Turner, 1986) is based on the fact that an individual has two types of traits: Some that come from the social order, derived from belonging to groups and others derived from their own personality. Identification between an organization and its stakeholders is constituted as a relationship process with the company, where stakeholders are not simply loyal, but also feel closely connected to the company, which involves them promoting it positively, attracting new stakeholders and even defending it when they criticize it.
While identification is necessarily linked to the causes, objectives or shared values between the organization and stakeholder, where the stakeholder can feel identified with a company even without having had previous experiences, loyalty demands previous own consumption experiences (Sen et al., 2015). As a result, identification can become an important asset for the company as a whole, as it can contribute to increasing its market value (Tuškej, Golob, & Podnar, 2013). Fig. 1 presents the research model proposed and tested in this study.

Although some previous investigations in the field of business show that identification is a significant element in the generation of attitudinal and behavioural consequences of repurchasing in different stakeholders, others have not revealed the existence of this positive and significant relationship between identification and brand loyalty. Loyalty to HEIs involves attitudinal elements such as evaluations and behavioural intentions, and will be more intense when stakeholders share values and show concern about them by identifying with them (Doña & Luque, 2017; Schlesinger et al., 2014). This is reflected for example in maintaining relationships over time (Helgesen & Nesset, 2007), providing ‘mouth-ear’ recommendations, suggestions or even making donations (Stephenson & Yerger, 2014) by their different stakeholders, which will be reinforced with the evaluations generated by identification. In this way, university stakeholders that have a certain level of identification should show a positive attitude and behaviour towards the university, which means a greater desire to continue there over time, doing different specialization courses, recommending it to other people, defending it when others criticize it and even making donations. Therefore, it can be established:Hypothesis 1 Identification of university stakeholders is directly and positively related to loyalty towards the university.
According to the stakeholder theory (Donaldson & Preston, 1995; Freeman, 2010), the survival of an organization requires achieving its different objectives through a balance between the objectives of the different stakeholders. In this sense, it will be essential to evaluate if there are significant differences between different groups (such as for example, between professors and graduates) in the perception of the identification-loyalty relationship that allows for adequate management of HEIs and making strategic recommendations to obtain competitive advantages. The differences with graduates are derived from the fact that when forming their perceptions, professors do so as a result of a greater experience and interaction with the institution. Due to having a greater link with the institution, their perceptions generate more affective bonds, which produce a positive response and performance, generate greater commitment, involvement and connection between them (Patlán & Martínez, 2017). On the other hand, professors show greater knowledge motivations, while graduates are more linked to the acquisition of results in the achievement of a degree. (Balmer & Liao, 2007; Takaki et al., 2015). Therefore, we can establish:Hypothesis 2 There are significant differences between professors and graduates in the influence of identification on loyalty.
To carry out the hypothesis contrast and achieve the objectives set out in this study, a Spanish public university was chosen: the Rey Juan Carlos University. The choice of a public university was motivated by the fact that public universities represent the 60% of the university system (50 of 84), and they are losing competitiveness compared to private universities and need to adopt identification and loyalty elements to survive. An example of this is that in the Spanish university system, private universities have multiplied by five in 20 years and 33% of graduates decide to take a Master's Degree in a private university (Fundación BBVA-Ivie, 2017). In addition, within public universities, Rey Juan Carlos University was chosen for different reasons: It is a young university, founded in 1996, and the identification-loyalty relationship is essential to compete with other institutions that are already more consolidated. It occupies the 201st place in the Europe-Teaching Ranking 2018 and appears for the first time among the 500 universities of the Chinese list Shanghai by Subject at global level in certain areas. In 2018, it also obtained four stars out of five in the QS Stars, and it stands out with five stars in employability and internationalization, and in on-line training with four stars. It is also in 3rd position of a total of 74 public and private universities in ‘Public Transparency of Spanish Universities’.
The data used in this research were collected through an on-line survey. A text was included with the questionnaires sent, where a survey access link was provided and its dissemination was requested. In order to increase participation, the same message was published on social networks. After sending it many times, 394 valid questionnaires were obtained, of which 59% correspond to women and 41% to men, 75% to professors and 25% to graduates.
3.2Scales of measurementAll the variables were measured using an ascending Likert scale, from 0 (totally disagree) to 10 (totally agree). To measure identification, three items (Mode A) were used from the scales proposed by Ashforth and Mael (1992) and Takaki et al. (2015). To measure loyalty, three items (Mode A) were used from the scales proposed by Palmer, Koenig-Lewis, and Asaad (2016).
3.3Statistical techniquesThe techniques used were PLS-SEM and SmartPLS3 V.3.2.7 software (Ringle, Wende, & Becker, 2015). PLS-SEM is a multivariate analysis technique which is noted for its prediction of dependent variables by estimating path models not based on covariance (CB-SEM), but it is based in the estimation of ordinary least squares and in the analysis of principal components and enables the justification of moderating effects through multigroup analysis (Hair, Sarstedt, Ringle, & Gudergan, 2018; Rigdon, Sarstedt, & Ringle, 2017). The multigroup analysis was contrasted by MGA and permutations since they constitute non-parametric methods that have the advantage of not imposing data distribution. The permutation method also has the advantage of not imposing hypotheses with direction and is considered the most reliable and recommended method (Hair et al., 2018). The main limitation of PLS-SEM is that it does not present a conclusive result model fit index. The use of a fit index is in a very early stage of development and is generating controversy (Hair, Hult, Ringle, & Sarstedt, 2017; Rigdon et al., 2017). PLS-SEM focus on prediction modelling and in this context fit index (as put into effect by SMRS) and the exact fit test offers little value. In fact, their use can even be harmful as researchers may be tempted to sacrifice predictive power to achieve better “fit” (Hair et al., 2017). Therefore, all these arguments justify that the technique is valid.
The evaluation of data by means of PLS requires a minimum sample size with the objective of the method being robust and the results being valid (Hair et al., 2018). Authors such as Chin and Newsted (1999) and Hair et al. (2018) suggest using the power method instead of the traditional method of 10 cases (Barclay, Higgins, & Thompson, 1995), due to its low precision. The G*Power 3.1.9.2 software was used to obtain the minimum sample size necessary to have sufficient test power (Faul, Erdfelder, Lang, & Buchner, 2007), recommended by authors as Hair et al. (2018). The results require a minimum sample size of 55 cases for a power test of 80%, minimum requirement (Cohen, 1988). Our research meets these requirements by obtaining 394 valid cases, of which 295 are professors and 99 are graduates, which shows a power test clearly superior to the minimum required. This sample allows us to infer the population results with an error of ±4.7% for a level of confidence of 95% considering the situation of the most unfavourable population variance p=q=50%.
4ResultsAs shown in Table 1, the average identification level of professors is between 5.9 and 5.6, while for graduates its average value is between 5.4 and 4.8. Regarding loyalty, the average level for professors ranges from 4.4 to 5, and for graduates it is 3.7. These results show that professors feel a greater attachment and loyalty to the institution than graduates.
Items used in the proposed scale and mean and deviation.
| Professors | Graduates | ||||
|---|---|---|---|---|---|
| Identification | Based on Ashforth and Mael (1992); Takaki et al. (2015); Balaji et al. (2016) | Mean | Standard Deviation | Mean | Standard Deviation |
| IDENTF1 | When someone speaks well about my university, I feel proud | 5.969 | 3.413 | 5.422 | 3.383 |
| IDENTF2 | I consider the success of my university as my success | 5.722 | 3.584 | 4.872 | 3.941 |
| IDENTF3 | I feel that I am part of my university | 5.676 | 3.387 | 4.809 | 3.594 |
| Loyalty | Based on Hennig-Thurau, Langer, and Hansen, (2001); Palmer et al. (2016) | Mean | Standard Deviation | Mean | Standard Deviation |
| LOYAL1 | If I had to take other courses, conferences or professional improvement studies I would surely consider my university as the first option | 4.418 | 3.685 | 3.739 | 3.797 |
| LOYAL2 | If someone asked me for advice, I would recommend my university | 5,086 | 3.545 | 3.895 | 3.911 |
| LOYAL3 | I would encourage family and friends to study at my university | 4,906 | 3.584 | 3.700 | 3.989 |
Evaluating the measurement instrument involves analysing first the reliability and validity of the latent variables (LVs) (Chin, 1998; Hair, Hult, Ringle, & Sarstedt, 2016). This involves analysing the individual reliability of the indicators on the latent variables through their loadings and the reliability of the internal scale or consistency through Cronbach's Alpha (CA), composite reliability (CR) and the Dijkstra-Henseler statistics (rho_A). For the validity analysis it is necessary to analyze convergent validity through the average variance extracted (AVE) and discriminant validity through the heterotrait-monotrait ratio (Hair et al., 2017).
In general, to consider the indicator loadings on the LVs valid, they must be ≥0.7 (Carmines & Zeller, 1979; Rasoolimanesh, Roldán, Jaafar, & Ramayah, 2017). Table 2 shows that the indicator loadings on their LVs are greater than 0.7. To evaluate the internal consistency of the scale, different coefficients are analyzed: CA that requires values greater than 0.7 (Hair et al., 2017; Nunnally & Bernstein, 1994), the CR whose adequate values are greater than 0.6 (Bagozzi & Yi, 1988) or 0.7 (Chin, 2010; Hair et al., 2017) and recent studies show that the rho_A coefficient requires values greater than 0.6 (Dijkstra & Henseler, 2015; Schuberth, Dijkstra, & Henseler, 2018). Table 2 indicates that the CA, CR, and rho_A of the LVs obtain values higher than 0.7, so the results are reliable.
Reliability and convergent validity of the measuring instrument.a
| Factor | Indicator | Loading | CA | CR | rho_A | AVE |
|---|---|---|---|---|---|---|
| F1. Identification | IDENTF1 | 0.918*** | 0.918 | 0.948 | 0.919 | 0.860 |
| IDENTF2 | 0.936*** | |||||
| IDENTF3 | 0.928*** | |||||
| F2. Loyalty | LOYAL1 | 0.941*** | 0.963 | 0.977 | 0.967 | 0.931 |
| LOYAL2 | 0.977*** | |||||
| LOYAL3 | 0.977*** |
Reliability and convergent validity of the measuring instrument * denotes a significant loading at 0.05; *p<0.05; **p<0.01; ***p<0.001
Convergent validity sustains that the indicators of a variable are positively correlated with it. To establish convergent validity, the AVE must be higher than 0.5 (Chin, 2010; Hair et al., 2018; Rasoolimanesh, Ringle, Jaafar, & Ramayah, 2017). Table 2 shows that the AVE of the constructs is greater than 0.5.
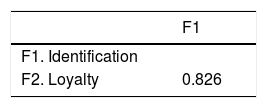
Discriminant validity indicates to what extent a given variable differs from the rest (Hair et al., 2017). To analyze discriminant validity, the heterotrait-monotrait ratio (HTMT) was established as a better criterion than the Fornell-Larcker and cross loading criteria, since these only work well with high sample sizes and very heterogeneous loading patterns (Henseler, Hubona, & Ray, 2016; Rigdon et al., 2017). To evaluate discriminant validity, more conservative studies suggest values below 0.85 (Kline, 2015; Rasoolimanesh, Ringle, et al., 2017). Table 3 indicates that the different LVs are lower, with a value of 0.827, so there are no discriminant validity problems in this model.
The structural analysis requires a study of the possible existence of multicollinearity through the Variance Inflation Factor (VIF) and hypothesis contrast of the structural model through a re-sampling of 5,000 subsamples as recommended by Hair et al. (2018). To analyze multicollinearity, VIF values below 5 are suggested (Hair et al., 2018). Table 4 indicates that the VIF value is 2.476, so there are no multicollinearity problems in this model. It also shows the identification influences loyalty positively and significantly (H1; β=0.367; p<0.001), which leads us to conclude that these results provide statistical support for Hypothesis 1.
Multicollinearity and hypothesis contrast of the structural model (Hypothesis 1).
| Hypothesis | VIF | Standardized beta | T value (bootstrap) |
|---|---|---|---|
| H1: Identification→Loyalty | 2.476 | 0.367*** | 8.148 |
R2 (loyalty)=0.725; f2 (loyalty)=0.214; Q2 (loyalty)=0.638.
R2 (loyalty graduates)=0.479; f2 (loyalty graduates)=0.921.
Multicollinearity and hypothesis contrast of the structural model (Hypothesis 1) * denotes a significant direct and positive effect at 0.05; bootstrapping based on n=5.000 sub-samples: *p<0.05; **p<0.01; ***p<0.001 (based on Student-t distibution t (4999) on tailed test); t (0.05:4999) =1.64791345; t (0.01;4999) =2.333843952; t=(0.001;4999)=3.106644601.
After testing the statistical significance and, therefore, the effective confirmation of the hypotheses proposed, the most commonly used measure to evaluate the structural model is the coefficient of determination R2 (Hair et al., 2017). As shown in Table 4, the endogenous latent construct (loyalty) obtains a value R2 of 0.725. In scholarly research focus on marketing issues R2 values of 0.75 or 0.50 for endogenous latent variables, be respectively considered as substantial or moderate (Hair et al., 2017). In addition, the f2 statistic value is of 0.196. The guidelines for assessing f2 values between 0.15 and 0.35 represent a medium effect (Cohen, 1988).
In order to evaluate the model's predictive relevance we also examine Stone-Geisser Q2 value (Geisser, 1974; Stone, 1974). Q2 values estimated by the blindfolding procedure larger than 0 suggest that the model has predictive relevance (Chin, 1998; Hair et al., 2017). Table 4 displays a Q2 value of 0.638, so the model has relevance predictive.
Apart from the conceptual concerns expressed in the methodology in relation to the fit index, some researchers consider that it makes sense in a type A model insofar as it is trying to replicate the results of CB-SEM (Hair et al., 2017). For fit index tests, some researchers as Henseler (2017) suggest using the residual root mean residual (SRMR). The measures behaviours have not been researched in PLS-Sem context in depth, and threshold values have not been derived yet. Following a conservative approach, an SRMR value of less than 0.08 is appropriate (Hu & Bentler, 1998). We obtained an SMRS value of 0.021, so the model indicates a good fit.
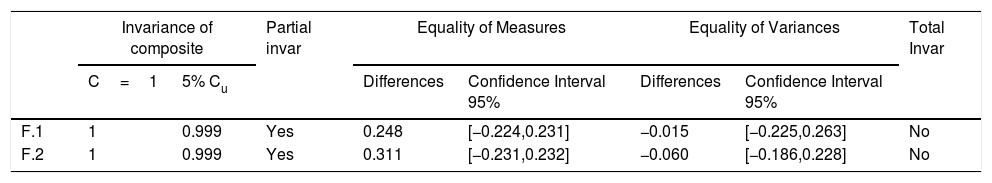
Before carrying out a multigroup analysis (to contrast Hypothesis 2), it is necessary to determine the invariance of the measuring instrument by using the MICOM (Measurement Invariance of Composite Models) procedure (Hair et al., 2018; Rasoolimanesh, Roldán, et al., 2017). This method involves three steps: (1) calculating the invariance of the configuration; (2) calculating the invariance of the composite; and (3a) evaluating the equality of measures, as well as (3b) the equality of variances (Hair et al., 2018). The invariance of the configuration is established and the same indicators and configuration of the PLS algorithm are used for both groups. The results of Table 5 show partial invariance for the two groups, which is a sufficient requirement to be able to compare the differences between groups (Hair et al., 2018; Rasoolimanesh, Ringle, et al., 2017; Rasoolimanesh, Roldán, et al., 2017).
MICOM procedure results.
| Invariance of composite | Partial invar | Equality of Measures | Equality of Variances | Total Invar | ||||
|---|---|---|---|---|---|---|---|---|
| C=1 | 5% Cu | Differences | Confidence Interval 95% | Differences | Confidence Interval 95% | |||
| F.1 | 1 | 0.999 | Yes | 0.248 | [−0.224,0.231] | −0.015 | [−0.225,0.263] | No |
| F.2 | 1 | 0.999 | Yes | 0.311 | [−0.231,0.232] | −0.060 | [−0.186,0.228] | No |
N=5.000 sub-samples.
The results of multigroup analyses are analyzed using two non-parametric methods: Henseler-MGA (Rasoolimanesh, Ringle, et al., 2017) and the permutation-based method (Dibbern & Chin, 2010; Rasoolimanesh, Roldán, et al., 2017). These two techniques evaluate the differences between the path coefficients between two groups and constitute the most conservative techniques of PLS-SEM (Hair et al., 2018; Rasoolimanesh, Ringle, et al., 2017). In PLS-MGA a p-value of the differences between the path coefficients lower than 0.05 or higher than 0.95 at the level of 5% indicates the existence of significant differences in the two groups (Hair, Ringle, & Sarstedt, 2011; Rasoolimanesh, Roldán, et al., 2017; Reinartz, Haenlein, & Henseler, 2009). The permutation technique in turn indicates that there are significant differences between groups at the significance level of 5% only when the p-value is less than 0.05 (Dibbern & Chin, 2010; Hair et al., 2018; Rasoolimanesh, Ringle, et al., 2017), and its main advantage is that it is the most reliable technique and does not need to indicate the direction of the hypothesis (Dibbern & Chin, 2010; Hair et al., 2018).
Table 6 shows that there are significant differences between professors and graduates in the relationship between identification and loyalty, both through the permutation method (p<0.05) and the PLS-MGA (p<0.01). In addition, the relationship between identification and loyalty is more intense among professors than graduates. Therefore, the results obtained also provide statistical support for Hypothesis 2.
Multigroup results (Hypothesis 2).
| Path coefficient professors | Path coefficient graduates | Path coefficient original difference | Confidence interval 95% | p-Value Differencestwo tails | Acceptance | |
|---|---|---|---|---|---|---|
| p-Value of permutation | p-Value MGA | |||||
| 0.395 | 0.067 | 0.328 | [−0.268, 0.263] | 0.015* | 0.005** | Yes/Yes |
Multigroup results (Hypothesis 2) * denotes a significant differences at 0.05; bootstrapping based on n=5.000 sub-samples: *p<0.05; **p<0.01; ***p<0.001 (based on Student-t distibution t (4999) two-tailed test); t (0.05; 4999)=1.960; t (0.01; 4999)=2.577; t (0.001; 4999)=3.292.
R2 (loyalty professors)=0.714; f2 (loyalty professors)=2.501.
R2 (loyalty graduates)=0.479; f2 (loyalty graduates)=0.921.
The results obtained in this research represent a contribution to the strategic management of higher education institutions. On the one hand, they empirically confirm the positive and significant influence of identification on loyalty that had previously been analyzed in other papers at theoretical level or generalized results that had been found in business contexts (Bhattacharya & Sen, 2003; Elbedweihy, Jayawardhena, Elsharnouby, & Elsharnouby, 2016; Kang, Alejandro, & Groza, 2015; Ruiz & Marín, 2008). The results ensure that in the HEI field, identification influences loyalty directly and significantly (Hypothesis 1). This hypothesis has already been corroborated by previous studies (Cervera, Schlesinger, Iniesta, & Sánchez, 2012; Heffernan et al., 2018; Palmer et al., 2016), which shows that the results of this research are robust with those shown in previous research.
On the other hand, it makes an original contribution when evaluating the differences in perceptions between professors and graduates in the identification on loyalty relationship, an aspect that according to our previous review knowledge has not been addressed until now. The result of the multigroup analysis makes our contribution more significant, revealing the existence of significant differences in the perception between professors and graduates in relation to the positive effect of identification on loyalty (Hypothesis 2). The effect of positive perceptions of identification on loyalty is much higher in professors than in graduates.
6ConclusionsThe research highlights the importance that identification has for professors. This may be due to the fact that the Universidad Rey Juan Carlos is a young university, where the highest level of identification and loyalty of professors comes from a cognitive rather than affective component. On the other hand, the fact that the Rey Juan Carlos University has been in the media spotlight recently regarding postgraduate degrees may have influenced graduates in a less objective way, providing less identification and loyalty.
The comparison between professors and graduates in the perception of the influence of identification on loyalty represents a theoretical contribution to the literature. In addition, this contribution can be more significant due to the fact of performing this analysis through the MICOM approach to evaluate the invariance of PLS-SEM, and two statistical techniques are used, which are the permutation method and the PLS-MGA method. This multiple method provides greater rigour and robustness to the results obtained and has been developed in few papers and in other contexts (Rasoolimanesh, Ringle, et al., 2017; Rasoolimanesh, Roldán, et al., 2017).
Some relevant implications for the management of universities can be drawn from the results. The findings highlight that proper management of identification with the university will generate key attitudes and behaviours for the survival of HEIs such as advocacy, attraction, retention, temporary union, recommendations and even donations by their different stakeholders. On the other hand, in the influence of identification on loyalty, there are significant differences between professors and graduates, being the bond more intense in professors than in graduates. This shows that graduates perceive HEIs as an instrument for obtaining a degree (Balmer & Liao, 2007; Takaki et al., 2015). It may also suggest that the loyalty of professors may not be true loyalty but a latent or changing loyalty (Dick & Basu, 1994; Kotler & Keller, 2012) caused by greater barriers of change of the public sector and in graduates these barriers disappear when they decide to take a postgraduate course due to an increase in the training programmes offered. These aspects suggest that university managers should increase graduates’ bonds during their university years and carry out actions aimed at maintaining this bond when they do not belong directly to it. In this sense, an important issue to be taken into account by university administrators would be the integral management of communications and the reinforcement of the internal and external media of HEIs.
This research is subject to a number of limitations. One of these limitations is related to the low response rate, although the relevant statistical analyses have been carried out to confirm the statistical robustness of the results obtained. On the other hand, the fact of carrying out this research in a specific period and for professors and graduates of a university could imply a limitation for the implementation of HEIs in general. Therefore, for future lines of research, it is suggested to expand the sample to different stakeholders such as managers, companies and society in general, in order to achieve greater representativeness and generalization of the results. Subsequently, the external validity of the results obtained by replicating the study in other countries or university areas could be evaluated. Finally, it would be interesting to include other variables in these stakeholders such as reputation, legitimacy and satisfaction.