


This paper analyses the influence of eco-innovation on the dynamics of firm performance in the context of a circular economy. From a firm-level approach, we investigate whether firms whose innovation strategies simultaneously aim at significant reductions in material and energy consumption and high environmental awareness (circular eco-innovators) have a higher probability of both reaching (entry) and remaining (persistence) in the group of high-performing firms (top of high-productivity firms). The sample data are from a panel of Spanish manufacturing firms for the period 2003–2016. To deal with endogeneity problems, a two-step methodology is used combining survival models and matching techniques. The results show higher firm productivity for circular eco-innovators at entry and persistence in the upper part of the productivity distribution. The study concludes that circular eco-innovations effectively promote more persistent and resilient performance in Spanish manufacturing firms.
Since Turner and Pearce (1990), there has been a growing interest in developing business economic models compatible with a more sustainable use of natural resources and natural capital conservation. In recent years, the concept of circular economy (CE) has emerged as a solution to achieving this change, on the basis that a productive system and the environment can coexist and feed each other. CE is defined as ‘an economic system that is based on business models which replace the ‘end-of-life’ concept with reducing, alternative reuse, recycling and recovery of materials in production/ distribution and consumption processes, thus operating at the micro level (products, companies, consumers), meso level (eco-industrial parks) and macro level (city, region, nation and beyond), with the aim to accomplish sustainable development, which implies creating environmental quality, economic prosperity and social equity, to the benefit of current and future generations’ (Kirchherr et al., 2017: 224–5). Thus, CE is proposed as an alternative to the traditional linear production system. Rather than take-make-waste, CE aims to transform our economy by extending the useful life of products, reusing, remanufacturing (repairing or reconditioning) and recycling to achieve resource circularity and the regeneration of nature (EMF, 2022).
The concept of CE has advanced significantly all over the world in recent years. In this regard, the European Union (EU) has been at the forefront of implementing policies to support the transition to a more CE. Thus, ‘Closing the Loop - An EU Action Plan for the Circular Economy’ outlines the first EU strategy for supporting the transition from a linear to a CE in 2020. This transition is one of the main objectives of the European Green Deal, which is designed to reduce the pressure on natural resources and achieve sustainable growth and jobs. However, European funds are not the only factor affecting the transition because there are significant regional disparities in the evaluation of the performance of CE in European regions (Silvestri et al., 2020). On this sense, some countries such as Spain, Germany and Belgium are progressing in CE while others are lagging, particularly in Central and Eastern Europe (Mazur-Wierzbicka, 2021). These results call for a deep understanding of the role of different stakeholders -citizens, institutions, companies, academia, consumers, waste pickers, designers, policymakers, governments and firms- in this transition (Valencia et al., 2023). Although numerous scholars have conducted literature reviews to advance the definition of CE and its related dimensions (Kirchherr et al., 2017) or explain its relation to eco-innovation (Prieto-Sandoval et al., 2018), empirical research at the micro level is still scarce (Korhonen et al., 2018).
Firms play a major role in the transition to CE. To achieve better management of natural resources and minimise negative environmental impact, circular business models must be adopted by both large firms and SMEs. Therefore, innovations designed to implement minimisation and efficient use of scarce resources -eco-innovations- are needed for the configuration of circular business models (Pieroni et al., 2019; Sehnem et al., 2022).
In line with previous literature (de Jesus et al., 2018; Kiefer et al., 2021; Scarpellini et al., 2020), eco-innovation and CE cannot be separated. However, it is worth noting the need to disentangle the interrelationship between both concepts and their consequences for firm performance (Scarpellini et al., 2020). Firms with more experience in eco-innovation continuously improve their profits because of cost savings and efficiency (Darmandieu et al., 2022; Leyva-de la Hiz et al., 2019). Thus, the adoption of circular eco-innovations must be aligned to a better or more stable competitive advantage (persistence of high performance).
Indeed, previous literature has confirmed the positive effect of eco-innovation on firm performance compared to other forms of innovation. However, the significance and magnitude of the interrelationship between eco-innovation and firm performance varies depending on the indicator used to measure performance (Hizarci-Payne et al., 2021). Moreover, with only a few exceptions (Colombelli et al., 2021; Leoncini et al., 2019), almost no research addresses the asymmetric impact of eco-innovation on firm performance.
Based on the evidence above, several research gaps have been identified. First, there is a lack of large-sample studies that analyse the influence of circular eco-innovations on firm performance. Although the literature addressing the effect of eco-innovation on firm performance is relatively abundant, there is a scarcity of studies that analyse the influence of circular eco-innovations on performance using a large sample of firms (Geissdoerfer et al., 2017; Kristensen & Mosgaard, 2020). Second, most previous literature analyses the effect of eco-innovation on firm performance focusing only on a specific point in time (e.g., the short run), lacking a dynamic perspective. Finally, most studies use subjective measures (constructs from diverse items gathered in survey responses) or performance indicators related to financial or employment growth instead of measures linked to operational performance (Hizarci-Payne et al., 2021).
To achieve the objectives of this research, we first define circular eco-innovators as firms that place a high level of importance on the reduction of material use, energy and environmental damage in their innovation strategy. We then analyse the top terciles of firm performance, comparing circular eco-innovators with those that are not. Specifically, we examine not only the factors that influence the adoption of circular eco-innovations, but also the factors that influence entry into a high-performance group and persistence (non-exit) at that top tier. This means that, based on two different streams of literature (eco-innovation and persistence), we attempt to answer the following research questions:
RQ.1
Are there differences in the performance between firms that are circular eco-innovators and those that are not?
RQ.2
Does being a circular eco-innovator influence the likelihood of improving firm performance (entry into the high-performing firms’ group)?
RQ.3
Does being a circular eco-innovator influence the likelihood of maintaining high level of performance (exit from the high-performing firms’ group)?
Based on a large sample of firm data from more than 6000 Spanish manufacturers during the period 2003–2016, the main objective of this research is to analyse the influence of circular eco-innovations on firm performance in the context of CE. In doing so, the paper makes four important contributions to the field. First, it sheds light on the influence of circular eco-innovations on productivity dynamics at the firm level. Second, dynamic panel estimation techniques and matching estimators are used to control for endogeneity bias due to self-selection to distinguish between ‘treated’ firms (circular eco-innovators) and ‘untreated’ firms (non-circular eco-innovators).Third, and relevant to a more coherent understanding of firm performance within the CE paradigm, the paper considers a measure of operational performance, labour productivity, to gain more insights on the influence of eco-innovations on the transition to CE. Finally, the article explores the influence of short- and long-term strategic capabilities of companies and the competitive environment to better understand the influence of individual and contextual factors on the adoption of circular eco-innovations by firms.
The paper is organised as follows. Section 2 presents the literature review and the theoretical framework, which is based on eco-innovation literature and ‘persistence literature’. Section 3 describes the database, some descriptive statistics and the methodological strategy. Section 4 presents and discusses the main results, and Section 5 summarises the main conclusions.
2Literature review, theoretical framework and hypotheses2.1Eco-innovation and circular economy: circular eco-innovationsBased upon the Porter and van der Linde (1995) win-win argument, eco-innovations are very useful for obtaining both environmental (e.g., by reducing pollution and waste) and economic (e.g., through cost savings or by setting higher prices for eco-products) benefits. CE is presented as an alternative to the traditional linear model. It shifts from ‘extract-produce-consume-dispose’ to ‘reduce-recycle-recover’, but this transition requires the efforts of firms, consumers, governments and society.
For firms, ‘eco-innovation is a starting point in the transition to CE supported by innovation’ (p. 245). Perhaps eco-innovation is not enough, but it is a necessary tool to drive a ‘transformative’ and ‘systemic’ transition to CE (de Jesus et al., 2018). Although it is recognised that other dimensions beyond technological changes are needed for this transformation, ‘technological eco-innovation seems to enjoy wider popularity as a heuristic for the transition to CE’. Therefore, eco-innovation and CE are closely linked and the transition to a CE without this specific type of innovation is unlikely (de Jesus et al., 2018).
Given this mutual interdependence between eco-innovation and CE, it is possible to identify previous literature that seeks to define ‘circular’ eco-innovations (de Jesus et al., 2018; Kiefer et al., 2021; Scarpellini et al., 2020). As de Jesus et al. (2018) argue, eco-innovation makes it possible to operationalise the changes required to achieve the CE techno-economic paradigm.1 Although they support that ‘EI-driven techno-economic transition to a CE requires specific solutions, i.e., different forms of EI-driven “clean congruence” at distinct levels of operation (target, mechanisms, and impact)’, there is a clear overlap between eco-innovation and CE. Thus, circular models are implemented through the adoption of product, process, marketing and organisational eco-innovations at the micro level (targets).
From the perspective of dynamic capabilities, the interrelationship between eco-innovation and CE-oriented activities in empirical studies has also been shown (Prieto-Sandoval et al., 2018; Scarpellini et al., 2020). Beyond technological and non-technological innovations (incremental and radical), CE implies the development of new business models and dematerialisation, the redesigning of products and processes, improving efficiency and clean production, life-cycle extension, inter-actor symbioses and valorisation of products and waste (de Jesus et al., 2018). Therefore, firms need to develop new (and dynamic) capabilities to sense, seize and address CE opportunities (Khan et al., 2020; Prieto-Sandoval et al., 2018; Scarpellini et al., 2020).
Firms adopt common procedures, routines and capabilities to adopt eco-innovations and move towards CE (Scarpellini et al., 2020). In addition, firms that have previously demonstrated capabilities related to eco-innovation can leverage their existing skills to implement CE more easily. This prior experience with eco-innovation provides a solid foundation for adopting CE practices (Jakhar et al., 2019). Therefore, it is also possible to identify eco-innovation as a prerequisite for adopting circular business models.
The empirical evidence also reinforces the theoretical basis by highlighting the key role of eco-innovations in facilitating the transition to a CE. Eco-innovations are the perfect tools achieving some of the goals of a more CE such as material resource efficiency (Cainelli et al., 2020; Kiefer et al., 2021; Scarpellini et al., 2020). They are a necessary, but not sufficient, precursor to this transition. Moreover, there is a clear overlap between the objectives of eco-innovation and activities aligned with the principles of CE. Therefore, it is relevant to analyse the effects of circular eco-innovations on performance.
2.2The influence of circular eco-innovations on performanceAlthough the studies explicitly referring to circular eco-innovations are few, there is abundant empirical literature exploring the relationship between eco-innovation and economic performance. However, the results are not fully conclusive (Zheng & Iatridis, 2022). While most studies note a positive relationship between eco-innovation and firm performance (Caravella & Crespi, 2022; Leoncini et al., 2019; Triguero et al., 2017), others find a neutral (Doran & Ryan, 2016; Horbach & Rammer, 2019) or a negative relationship (Cainelli et al., 2011; Madaleno et al., 2020). Although these different findings are attributable to the samples, periods, econometric techniques and performance measures used, it is interesting to briefly review the empirical findings.
The positive influence of eco-innovations on employment growth in Italian (Caravella & Crespi, 2022; Leoncini et al., 2019), German (Horbach & Rammer, 2019) and Spanish firms (Triguero et al., 2017) has been shown. The positive influence of eco-innovations on sales growth has also been verified in some studies. However, it seems that eco-innovation does not always improve firm performance in the short run. Using a large sample of European firms from 13 countries (CIS 2014), Madaleno et al. (2020) find a negative effect of eco-innovation on sales and employment growth. Similarly, Cainelli et al. (2011) find a non-positive influence of eco-innovation on employment and turnover for Italian service firms at the end of the 1990s.
Similar evidence is found in studies focused on the effect of eco-innovation on profitability or financial performance. Horbach and Rammer (2019) find that circular eco-innovations only affect the 25th but not on 75th percentiles of turnover growth in German firms. This contrasts with the positive effect of eco-innovation on the performance (measured by the book value of total assets) of Malaysian energy companies, as shown by Johl & Toha, 2021. Similarly, other authors suggest that the positive effects of eco-innovation on performance are limited to specific sectors, countries or types of innovation (Flachenecker & Kornejew, 2019). This occurs when such eco-innovations improve the efficiency of materials use or energy consumption (Rexhäuser & Rammer, 2014; Ghisetti & Rennings, 2014), but not for end-of-pipe eco-innovations, which could even worsen profitability.
The results on the impact of eco-innovation on productivity are also inconclusive. Cainelli et al. (2011) show a low productivity effect of eco-innovation based on the behaviour of Italian service firms. Antonietti and Marzucchi (2014) confirm the positive influence of eco-innovations on total factor productivity. However, Doran and Ryan (2016) find no significant impact on labour productivity for Irish manufacturing firms. While the former study shows that only eco-innovations that reduce material use can increase productivity (only for firms with medium to high productivity), the latter argues that there is no trade-off between eco-innovation and higher sales per worker for eco-innovators due to the lack of stringency in environmental regulation. Doran and Ryan (2016) also find that eco-innovations for reducing CO2 and recycling waste, water and materials have a positive influence on turnover per employee, while the effect is negative for eco-innovations that recycle the product after use. By contrast, Horbach and Rammer (2019) do not find significant influence of nine types of eco-innovations on labour productivity growth in manufacturing firms located in Germany in any percentile.
Using a cross-data set of 5100 SMEs in 28 European countries for the year 2016, Horbach and Rammer (2019) and Demirel and Danisman (2019) show that most circular eco-innovations fail to boost the sales growth of SMEs. Therefore, we can state that the Porter-like effects (the virtuous circles between eco-innovations and performance) sometimes seem to be present, at least in the short run, but this is not always guaranteed.
Notwithstanding the different effects of eco-innovation on employment, sales and labour productivity could turn out positive in the long run (Cainelli et al., 2011). According to these authors, green markets need to be mature to recover profits. Since the adoption of circular eco-innovations could have different effects in the short and long run, different paces of growth must be considered (Gusmerotti et al., 2019; Kiefer et al., 2021).
2.3Theoretical framework and hypotheses development: circular eco-innovations and high-performing firmsSince ‘(eco)-innovation is a factor that generates disruption and reformulation and decisively contributes to the success of the CE’ (Sehnem et al., 2022, p. 246), firms must adopt eco-innovations to gain or maintain their competitive advantage in the transition to the CE paradigm.
CE business benefits include cost savings on energy and raw materials and avoiding the payment of environmental taxes (Korhonen et al., 2018). The reuse or use of renewable waste can improve efficiency and the market value of firms. Despite the so-called ‘rebound effect’ in a context of growing demand (Zink & Geyer, 2017), CE business makes environmental sustainability and conservation of physical and natural resources compatible with firms’ competitiveness (Sarfraz et al., 2021). Therefore, evidence of a positive relationship between more circular innovations and high performance may be an incentive to adopt circular eco-innovations.
CE strategies involve substantial modifications of production systems, and this shift improves firm sustainable performance (Jabbour et al., 2020). Linking sustainability to firm value implies planning production throughout the product value chain. It is, in fact, a substantial change that entails more than cost savings and profit maximisation, changing the role of supervision, coordination and dynamism through the production cycle to make sustainability a key factor boosting firm profits (Sonnemann & Margni, 2015). This organisational change also facilitates access to new markets, develops new products and services and creates new business models (Korhonen et al., 2018). Indeed, new business opportunities called circular advantages (Lacy & Rutqvist, 2015) represent a disruptive change in production and consumption supported by new technologies and changes in industrial engineering.
As Coad and Rao (2008) argue, a firm ‘may grow for a number of reasons that may or may not be related to innovative activity’ (p. 633), but ‘innovativeness is of crucial importance for the “superstar” high-growth firms’ (p. 635). Therefore, the effect of innovative activities on performance has been empirically validated in different sectors and economic contexts (Coad & Scott, 2018; Coad et al., 2016).
Focusing on the performance of high-growth firms, Leoncini et al. (2019) show that the use of green technologies drives greater resource efficiency (i.e., reduction of material and energy) and job creation. Eco-innovative firms achieve the double-win effect and can reinvest extra returns unlike non-eco-innovators. Similarly, Caravella & Crespi, 2022 show that employment grows faster in eco-innovative firms than in non-eco-innovative firms in Italy.2 This positive result is also confirmed by Colombelli et al. (2021), who use sales growth to measure the performance of firms in Germany, France, Italy, Spain and Sweden over the period 2002–2011. Although these two studies focus on high-growth firms (gazelles) and use patent data to measure eco-innovation, they provide some interesting clues about the potential relationship between eco-innovation and firm performance. Our starting hypothesis is that the adoption of circular eco-innovations encourages top performance at the firm level. To our knowledge, no similar study exists. However, previous arguments and empirical literature related to eco-innovation allow us to state the following hypothesis:
H1
Circular eco-innovations will increase the probability of achieving top-tier firm performance.
Although previous research has overlooked the sequential process of transitioning to CE, it is necessary to consider the path dependence process (Darmandieu et al., 2022; Leyva-de la Hiz et al., 2019) and the long-term implications of adopting circular eco-innovations for the firm (Kiefer et al., 2021; Pieroni et al., 2019). There is empirical evidence based on the theory of ‘persistence of profits’ about the link between the persistence of corporate profits and competitive advantage (Geroski & Jacquemin, 1988; Wibbens, 2019). What characterises leading firms is not the short-term achievement of high profits but rather staying at the top of the distribution for a long time (Wiggins & Ruefli, 2002). In fully competitive markets, firms are very heterogeneous (Cefis, 2003; Dosi et al., 2016), and the most persistent in profit rates are characterised by making a continuous effort to innovate (Roberts, 1999; Waring, 1996; Jacobsen, 1988). On this basis, we know that there is a positive relationship between innovation and persistence of profits or staying in the group of high-performing firms, but we do not know whether this happens with circular eco-innovation.
As previous literature suggests, persistent profits indicate that a firm has a strong market position or unique resources that competitors cannot easily replicate (e.g., circular advantage). Persistence is also often seen as a sign of long-term competitive advantage (Lin et al., 2014). It is associated with the ability of a firm to maintain its competitive advantage and continue to generate above-average returns (the duration of that competitive advantage).3 Changes in the production model and the strategic reorientation implicit in CE business will not be assumed without risks and might also entail a decrease in firms’ competitiveness (Daddi et al., 2019). However, has been shown that CE business models help to consolidate high performance for long periods of time (Jabbour et al., 2020). Similarly, Fulton et al. (2012) highlight that companies well qualified in their environmental, social and governance policies tend to lead the market in the medium (3–5 years) and long term (5–10 years).
In this paper, we propose that circular eco-innovations, beyond improving the image of the company or corporate social responsibility, are planned and have consequences in the long term. Given that the adoption of these innovations can lock in the company for a long period because of their higher costs, variety and complexity (Gusmerotti et al., 2019; Kiefer et al., 2021), CE principles are integrated in the firm's long-term innovative strategy. Thus, special attention is paid to continuous innovations, routines and procedures to cope with the challenges of earning the economic, environmental and social benefits of transitioning to CE (Pieroni et al., 2019). Firms with high innovative capabilities can more easily adopt circular eco-innovations of their tailored structures, which adapt quickly to the rapid changes implicit in the transition to CE (Jakhar et al., 2019). Therefore, we expect a positive relationship between circular eco-innovations and persistence at the top of the performance distribution. Specifically, we propose the following hypothesis:
H2
Circular eco-innovation will increase the probability of persistence in the top tier of firm performance.
3Sample data descriptive analysis and research methodology3.1Sample data and descriptive analysisThe sample data is the Spanish Technological Innovation Panel (PITEC), which covers Spanish firms during the period 2003–2016. It comes from the Spanish National Statistics Institute (INE) in collaboration with the Spanish Science and Technology Foundation (FECYT) and the Foundation for Technological Innovation (COTEC). It is a firm database focused on technological and innovative strategies. Additionally, it includes questions about different types of innovation, firm performance and the main goals of innovation behaviour, including environmental objectives. In addition, to make the results more representative, the estimates are weighted by the number of companies operating in each sector and year based on data from the Directorio Central de Empresas (Central Business Directory), which is compiled by the National Statistics Institute (INE).
We consider only manufacturing firms, specifically, those included in sectors 3 to 24 according to the 2-digit NACE-2009 classification. The main advantage is that the sample includes only firms that use raw materials, parts and components to assemble finished goods. Such a selection is essential given the differences in input use, transformation and delivery that are specific to these industries and their implications for the circular eco-innovation. Nonetheless, two limitations must be considered. First, it is not a pure panel since the response from firms does not refer to the current financial year but to their activity in the last two years. Second, although the survey includes questions related to environmentally friendly practices, more information is required to determine whether firms are fully engaged in a CE. For this reason, we talk about companies with circular eco-innovations in this research.
The circularity variable (circular eco-innovator) is built on the basis of categorical variables from 1 to 4 indicating whether the company has a high, medium, low or no relevant interest in the reduction of energy and materials per unit produced and the improvement or reduction of environmental impact. Thus, a firm is a circular eco-innovator (value equal to one) if it simultaneously presents high and medium interest in both variables, and it is not a circular eco-innovator (value equal to zero) otherwise.4
Some descriptive results are shown in Table 1. In Spanish manufacturing, there is still little interest in eco-sustainable practices. Only one third of companies show a high or medium interest simultaneously in reducing materials and energy per unit produced and reducing or improving environmental impact. Distinguishing by type of practice, medium-high interest in reducing materials and energy affects 38.66% of companies, which is less frequent than a medium-high interest in environmental impact (48.94%).
Definition and descriptive statistics of circular eco-innovations and their components.
| Variable | Definition | Obs. | High (%) | Medium (%) | Low (%) | Not Relevant (%) | Std. Dev. |
|---|---|---|---|---|---|---|---|
| Material & energy reduction | Firm's interest in reducing materials and energy per production unit: 1 = High; 2 = Medium; 3 = Low; 4 = Not relevant. | 51,939 | 12.44 | 26.22 | 29.74 | 31.60 | 1.019 |
| Environmental impact | Firm's interest in reducing and improving environmental impact: 1 = High; 2 = Medium; 3 = Low; 4 = Not relevant. | 51,940 | 21.54 | 27.40 | 18.59 | 30.47 | 1.152 |
| Circular eco-innovation | Indicates whether the company has a high or medium level of interest in simultaneously reducing energy and materials per production unit and reducing and improving environmental impact: =1 if material & energy reduction 〈 3 & environmental impact < 3; =0 if material & energy reduction 〉 2 & environmental impact > 2. | 49,048 | 32.33 | 67.67 | 0.468 | ||
Source: PITEC.
Regarding the firm's performance variable, the PITEC does not offer data on operational profits. For this reason, we measure performance by the labour productivity of the firm, measured by sales per employee.5Fig. 1 shows the annual rate of change in labour productivity together with its two determinants: the annual variation in sales and number of employees. From this data, we can further analyse the suitability of productivity as the main dependent variable of the study. Although, as can be observed, the behaviour of sales in Spanish manufacturing firms is clearly more volatile than that of employees, both variables follow similar trends. Therefore, in all years, changes in labour productivity can be explained by similar behaviour in both the products and labour markets. Consequently, the measure of sales per employee will adequately capture the firm's performance in terms of its productive efficiency.6
.")
The evolution of labour productivity in Spanish manufacturing clearly shows a better performance for firms with circular eco-innovations (Fig. 2). Except for 2004, firms with circular eco-innovations have a productivity advantage of between 25,000 and 35,000 euros compared to firms with non-circular eco-innovations.

The tercile distribution of labour productivity by year and sector constitutes the basis for calculating the mobility and persistence of firm performance.7 First, we consider that a firm improves its performance or upward mobility (Hypothesis 1) if it is in the 3rd tercile in period 't' when it was in the 2nd or 1st tercile in the previous year ('t-1′). On the other hand, there will be persistence in the upper part of the distribution (Hypothesis 2) when the company was in the 3rd tercile in 't-1′ and maintained its position in year 't'.
As a first approach to the degree of mobility and persistence, the transition matrices between t and t-1 have been calculated for terciles of sales over total employees (proxy of labour productivity). We distinguish between firms with and without circular eco-innovations (Table 2). The results suggest better performance for firms that adopt circular eco-innovations in terms of: a) a higher probability of reaching the top of the productivity distribution; b) a lower probability of moving down from the 3rd tercile; and c) greater persistence in the highest terciles, especially in the 3rd tercile, where the difference over firms without circular eco-innovations exceeds three percentage points.
Sales per employee. Transition matrices. Terciles.
| t | Tercile 1 | Tercile 2 | Tercile 3 | ||
|---|---|---|---|---|---|
| t-1 | Tercile 1 | No circular eco-innovator | 83.94 | 14.58 | 1.49 |
| Circular eco-innovator | 82.78 | 15.70 | 1.52 | ||
| Tercile 2 | No circular eco-innovator | 14.20 | 73.72 | 12.08 | |
| Circular eco-innovator | 12.36 | 74.30 | 13.34 | ||
| Tercile 3 | No circular eco-innovator | 2.19 | 13.79 | 84.02 | |
| Circular eco-innovator | 1.14 | 11.79 | 87.06 | ||
Source: PITEC.
Figs. 3 and 4 show, respectively, the hazard rate of promotion to the 3rd tercile and the survival function of remaining in this tercile based on the semiparametric estimation by Kaplan and Meier (1958). In addition, the Wilcoxon and Log-rank tests allow us to know whether the differences by type of company are significant.
 into the 3rd tercile by eco-innovation status. Kaplan–Meier estimates.")

In line with our initial hypotheses, firms adopting circular eco-innovations show better performance than firms adopting conventional innovations. Both the probability of entry (H1) and persistence in 3rd tercile (H2) are significantly higher in companies with CE innovative practices. The differences are statistically significant and seem to have remained stable for 15 years.
3.2MethodologyWhen designing the methodological strategy, the presence of endogeneity and reverse causality between the two main variables of the study must be considered. First, endogeneity will be determined because most of the drivers of the explanatory variable (level of adoption of circular eco-innovations) will also be drivers for the explained variables (climbing and persistence in the 3rd performance tercile). Second, it is difficult to know the direction of causality between both variables. Thus, the adoption of circular eco-innovations could promote entry into and persistence at the top of the productivity distribution, but at the same time, high-performance firms might encourage the implementation of circular eco-innovations.
We need to quantify whether the probability of entry into and persistence in the 3rd tercile is significantly different for firms that adopt circular eco-innovations without including the variable that captures this status in the entry and persistence performance equations. A two-step methodological strategy is proposed in order to deal with these problems.
In the first step, we split the sample of firms into two groups using matching techniques: the group of treated firms, or firms with circular eco-innovations, and the control group, those firms that do not have circular eco-innovations.
The degree of similarity of characteristics between groups is determined by a score, or propensity score, which is the probability of receiving the treatment. This is, in practical terms, the predicted probability of adopting circular eco-innovations estimated by a random effects probit. In this step, we have considered the same variables as in previous empirical literature about the drivers of eco-innovation. In particular, they include variables related to firms’ dynamic capabilities and resources (Arranz et al., 2020; Jové-Llopis & Segarra-Blasco, 2018; Sáez-Martínez et al., 2016). In line with Triguero et al. (2018), open innovation and collaboration with external sources are also considered. The equation for the adoption of circular eco-innovations (Circular eco-innovation) is defined by:
where, for each company (i), each sector (j) and each year (t), Circular ecoinnovation is a binary variable, Int.R&D and Ext.R&D identify whether firms have internal and external R&D expenditures and Group records whether the company belongs to a business group. The open innovation variables are determined by cooperation for innovation (Cooperation) and whether the company uses information from external sources: competitors (Competitors), suppliers (Suppliers), clients (Clients) and other sources (Oth.Sourc). Additionally, we consider the variable Young as a proxy for age, indicating whether the firm was established within the last three years. This variable is slightly different from the one that is introduced in the survival model (number of years the firm has been in existence) to avoid collinearity problems. Size in logarithms (Size), investments in tangible assets (Tang.Invest) and control variables for sector (Sector) and year (Year) are also included.
In the second step, we specify two independent functions that, by means of a survival model, compute the estimated (predicted) probabilities of promotion and persistence in the upper tercile for each company. In both cases, these are discrete choice models that will be estimated using a random effects probit. The promotion (climbing) and persistence functions are defined as follows:
where, for each firm (i), each sector (j), each spell (s) and each period (t), Prob(Entry) is the probability of entry into the 3rd tercile, which will be equal to 1 if the company was in a tercile different to 3 at t-1 and is in the 3rd tercile at t, and equal to zero otherwise. Prob(Exit) is the hazard rate of the 3rd tercile, complementary to the survival probability in that tercile. It takes the value 1 if the firm is in the 3rd tercile in t-1 and leaves it in t, and zero otherwise (if the firm remains in the 3rd tercile in both t and t-1).8

In line with most of the previous literature on ‘persistence of profits’ (Bartoloni & Baussola, 2009; Cable & Mueller, 2008; Gschwandtner & Cuaresma, 2013), we consider the innovation capacity of the firm, that is, product and process innovation (Product Innov. and Process Innov.), the degree of internationalisation, which identifies whether the firm is an exporter (Export), and human capital, based on the percentage of employees with a university education (Human K.). Specific characteristics of the firm, based on variables with low short-term variability such as belonging to a business group (Group), firm size through a categorical variable which indicates whether the company is large, medium or small (Size Cat.) and firm age in number of years (Age), are also included. Finally, variables related to the competitive environment are considered: whether the firm operates in a highly concentrated market (Concentr.) and a categorical variable indicating the degree of technological intensity (Tech.Degree), which depends on whether firms are operating in a high, medium, or low technology sector. Finally, we include a variable inherent to the survival models: Spell Dur., which measures the effect of previous experience in terms of consecutive years without being in the 3rd tercile (Eq. (2)) and the number of consecutive years that the company remains in the 3rd tercile (Eq. (3)). The empirical framework and the variables used to contrast Hypotheses 1 and 2 are presented in Fig. 5 to illustrate our proposal.

We want to know the probability of entry and persistence at the top degree of productivity when firms adopt circular eco-innovations, and we want to know the probability of entry and persistence of high performance if they do not adopt circular eco-innovations. Thus, we obtain, for each observation of the treated group (control), at least one observation with similar characteristics in the control group (treated) to assign its probabilities of entry and persistence in the 3rd tercile (productivity performance). For each observation, we have the probability of entry or persistence with and without circular eco-innovations. For instance, if we consider the model of entry into the 3rd tercile for a company that belongs to the control group (without circular eco-innovations), we will have the entry probability that was estimated in Eq. (3). Through matching techniques, the probability of entry into the 3rd tercile for firms that adopt circular eco-innovations is also calculated (it will be equal to the entry probability of firms with similar characteristics in the treatment group).
Thus, in each group and for the whole sample, it is possible to estimate the average difference between adopting and not adopting circular eco-innovations in the probability of entry into and persistence in the 3rd tercile for productivity. Usually, two magnitudes are considered: the mean of differences for the entire sample or Average Treatment Effect (ATE), and the mean difference considering only the treated group or Average Treatment Effects on Treated (ATT). The sign of the difference and its level of significance determine the level of fulfilment of Hypotheses 1 and 2.
To test the robustness of the estimates, five different models have been estimated: four models using propensity score matching (PSM) by the nearest neighbour (NN1, NN3, NN5,and NN7), and an alternative model of weighted inverse probability (‘inverse probability weighting’ or IPWRA) that is doubly robust since it allows us to enter all the equations and simultaneously weight the observations based on the number of times they have been used with other observations from the alternative group.
4ResultsTable 3 presents the main results of the circular eco-innovations function (Eq. (1)). Based on this model, we estimate the predicted probability of being a circular eco-innovator, and this probability constitutes the propensity score of our matching models.
Adoption of circular eco-innovations. Random effects probit. Marginal effects.
| 3.1 | 3.2 | 3.3 | 3.4 | 3.5 | 3.6 | |
|---|---|---|---|---|---|---|
| Int.R&D(t-1) | 0.085*** | 0.076*** | 0.076*** | 0.072*** | 0.068*** | 0.062*** |
| (0.002) | (0.002) | (0.002) | (0.002) | (0.002) | (0.002) | |
| Ext.R&D(t-1) | 0.009*** | 0.012*** | 0.012*** | 0.013*** | 0.002 | 0.003 |
| (0.002) | (0.002) | (0.002) | (0.002) | (0.002) | (0.002) | |
| Group | 0.002 | −0.001 | 0.002 | 0.000 | −0.000 | −0.000 |
| (0.003) | (0.003) | (0.003) | (0.003) | (0.003) | (0.003) | |
| Cooperation(t-1) | 0.026*** | 0.011*** | ||||
| (0.002) | (0.002) | |||||
| Competitors(t-1) | 0.070*** | 0.034*** | ||||
| (0.002) | (0.002) | |||||
| Suppliers(t-1) | 0.077*** | 0.050*** | ||||
| (0.002) | (0.002) | |||||
| Clients(t-1) | 0.067*** | 0.023*** | ||||
| (0.002) | (0.002) | |||||
| Oth.Sourc.(t-1) | 0.092*** | 0.061*** | ||||
| (0.002) | (0.002) | |||||
| Young(t-1) | 0.017** | 0.016* | 0.017* | 0.016* | 0.011 | 0.021** |
| (0.008) | (0.009) | (0.009) | (0.009) | (0.009) | (0.009) | |
| Size(t-1) | 0.041*** | 0.045*** | 0.044*** | 0.045*** | 0.045*** | 0.042*** |
| (0.002) | (0.002) | (0.002) | (0.002) | (0.002) | (0.002) | |
| Tang.Invest. (t-1) | 0.004*** | 0.003*** | 0.003*** | 0.003*** | 0.003*** | 0.003*** |
| (0.000) | (0.000) | (0.000) | (0.000) | (0.000) | (0.000) | |
| Sector | Yes | Yes | Yes | Yes | ||
| Year | Yes | Yes | Yes | Yes | ||
| Observations | 45,185 | 42,066 | 42,066 | 42,066 | 42,066 | 42,066 |
| Number of firms | 6185 | 6073 | 6073 | 6073 | 6073 | 6073 |
Signification level: *p < 0.05; **p < 0.01; ***p < 0.001.
First, size is decisive. Larger companies are more likely to adopt circular eco-innovations. These results confirm that the lack of resources of SMEs is a barrier to adopting this type of eco-innovation, due to problems accessing the required capital and the uncertain returns on investment (Garcés-Ayerbe et al., 2019). As we expected, these results are in line with previous studies on the drivers of eco-innovation (del Río et al., 2010).
We also find a high and positive impact of the variables R&D and open innovation. In this regard, internal and external R&D contribute to fostering circular eco-innovations. This result is consistent with the evidence found in earlier studies on circular eco-innovations (Demirel & Dannisman, 2019; Scarpellini et al., 2020). In addition, cooperation with other competing companies and the acquisition of information from suppliers, customers and other external sources are positive and significant. These findings corroborate the important role that external sources of knowledge play in the adoption of circular eco-innovations. As shown by previous evidence, the higher complexity of knowledge needed to eco-innovate justifies the need for knowledge from a wide variety of external partners, especially in eco-innovation (Ghisetti et al., 2015; González-Moreno et al., 2019; Marzucchi & Montresor, 2017; Mothe et al., 2018).
The youngest companies seem to play a leading role in the adoption of circular eco-innovations. Age therefore seems to act as a barrier to the adoption of this type of innovation. From the various tests carried out, it should be noted that, in broad terms, firm variables especially those that refer to innovation, tend to be more significant than external factors. Specification 3.6 shows the predicted probability of adopting circular eco-innovation when controlling for the rest of the explanatory variables (including sector and year dummies).
Table 4 shows the results of the entry and persistence models (Eqs. (2) and (3)). These are the reference probabilities for the matching models. As expected, variables related to innovation are crucial. However, we find slight differences between product and process innovators. Product innovation seems to be decisive in moving up to the top of the distribution (positive and significant sign in the input model) and in remaining in the 3rd tercile (negative and significant sign). Process innovation also helps persistence (negative and significant sign), but the results for the promotion from the 1st or 2nd terciles do not seem as clear (inconsistency of sign among the estimates and lack of significance).
Survival models. Results for entry and persistence in 3rd tercile. Random effects probit. Marginal effects.
| Entry probability to 3rd tercile (of sales per employee) Prob(Entry) | Exit probability from the 3rd tercile (of sales per employee) Prob(Exit) | |||||||
|---|---|---|---|---|---|---|---|---|
| 4.1 | 4.2 | 4.3 | 4.4 | 4.5 | 4.6 | 4.7 | 4.8 | |
| Product Innov. | 0.007*** | 0.006*** | −0.019*** | −0.020*** | ||||
| (0.001) | (0.001) | (0.002) | (0.002) | |||||
| Process Innov. | 0.001* | −0.000 | −0.019*** | −0.013*** | ||||
| (0.001) | (0.001) | (0.002) | (0.002) | |||||
| Export | 0.015*** | 0.015*** | 0.015*** | 0.015*** | −0.032*** | −0.032*** | −0.035*** | −0.032*** |
| (0.001) | (0.001) | (0.001) | (0.001) | (0.003) | (0.003) | (0.003) | (0.003) | |
| Human K. | 0.000** | 0.000*** | 0.000*** | 0.000* | −0.000*** | −0.000*** | −0.000*** | −0.000*** |
| (0.000) | (0.000) | (0.000) | (0.000) | (0.000) | (0.000) | (0.000) | (0.000) | |
| Group | 0.026*** | 0.026*** | 0.026*** | 0.026*** | −0.031*** | −0.032*** | −0.034*** | −0.034*** |
| (0.001) | (0.001) | (0.001) | (0.001) | (0.002) | (0.002) | (0.002) | (0.002) | |
| Size Cat. (Medium)1 | 0.000 | 0.000 | 0.000 | −0.000 | −0.018*** | −0.018*** | −0.021*** | −0.019*** |
| (0.001) | (0.001) | (0.001) | (0.001) | (0.003) | (0.003) | (0.003) | (0.003) | |
| Size Cat. (Large)1 | 0.002 | 0.002 | 0.002 | 0.001 | −0.026*** | −0.025*** | −0.032*** | −0.029*** |
| (0.002) | (0.002) | (0.002) | (0.002) | (0.005) | (0.005) | (0.004) | (0.004) | |
| Age | 0.000 | 0.000 | 0.000 | 0.000 | 0.000** | 0.000*** | 0.000*** | 0.000*** |
| (0.000) | (0.000) | (0.000) | (0.000) | (0.000) | (0.000) | (0.000) | (0.000) | |
| Concentr. | −0.003*** | −0.003*** | −0.003*** | −0.003*** | 0.008*** | 0.008*** | 0.007*** | 0.009*** |
| (0.001) | (0.001) | (0.001) | (0.001) | (0.002) | (0.002) | (0.002) | (0.002) | |
| Tech. Degree (Medium)2 | −0.005*** | −0.005*** | −0.033*** | −0.035*** | ||||
| (0.001) | (0.001) | (0.003) | (0.003) | |||||
| Tech. Degree (Low)2 | −0.007*** | −0.006*** | −0.043*** | −0.046*** | ||||
| (0.001) | (0.001) | (0.003) | (0.003) | |||||
| Spell Dur. | −0.049*** | −0.049*** | −0.049*** | −0.049*** | −0.111*** | −0.111*** | −0.110*** | −0.110*** |
| (0.001) | (0.001) | (0.001) | (0.001) | (0.001) | (0.001) | (0.001) | (0.001) | |
| Observations | 40,191 | 40,191 | 40,191 | 40,191 | 19,941 | 19,941 | 19,941 | 19,941 |
| Number of spells | 7469 | 7469 | 7469 | 7469 | 4601 | 4601 | 4601 | 4601 |
Signification level: *p < 0.05; **p < 0.01; ***p < 0.001. References:(1)Size Cat.(Small), (2)Tech.Degree(High). Robust estimations of heteroskedasticity.
According to previous literature, internationalisation is crucial for competitiveness (Gschwandtner, 2012; Wagner, 2002). Both being an exporter and belonging to a business group increase the probability of entry into the top of the productivity distribution (positive and significant sign) and reduce the probability of leaving the leader group (negative and significant sign). Human capital seems to be important for promotion and persistence in 3rd tercile, although the magnitude of the effect is very small (close to zero).
Size again plays against smaller companies, but it is decisive only for persistence at the top of the productivity distribution. As we expected, medium and large companies are more prone to climbing to and remaining in the 3rd tercile, but the results are significant only for persistence, not for entry into the group of high-performing firms.
Regarding the variables related to the firm environment, first, companies operating in highly concentrated markets reduce their probability of persistence in the 3rd tercile, maybe because of pressure exerted by the most powerful companies. Additionally, the negative sign of the entry models also indicates greater difficulties in climbing to the 3rd tercile.
Firms in high-tech intensive sectors appear to have greater mobility between groups. Thus, with respect to the medium- and low-tech sectors, firms that belong to high-tech sectors present a greater probability of promotion but, at the same time, a greater probability of leaving the highest tier of the productivity distribution. The coefficients are similar in all specifications, confirming the robustness of the models. To calculate the estimated probabilities of entry and persistence used in the matching models, we have selected specifications 4.4 and 4.8.
Table 5 shows the ATT and ATE results considering different matching techniques. In broad terms, all the specifications seem to confirm our starting hypotheses. Firms with circular eco-innovations show significantly greater probabilities (positive sign) of climbing to the top of the productivity distribution and a lower probability (negative sign) of leaving the 3rd tercile. Based on these results, circular eco-innovators show a greater ability to reach the upper part of the productivity distribution. Thus, Hypothesis 1 is supported. Moreover, circular eco-innovators also show a greater propensity to remain in the upper part of the productivity distribution (Hypothesis 2 is supported). The signs are quite similar in all estimated models, although there are some differences in significance depending on whether the entire sample is considered (ATE) or only the treated part (ATT). Thus, it can be summarised that, in general, the estimates support that firms that adopt circular eco-innovations perform better.
Results for Matching models. ATE and ATT of the difference between firms with and without circular eco-innovations.
| Circular eco-innovator versus No circular eco-innovator | |||
|---|---|---|---|
| ATE | ATT | ||
| NN7 | 3rd tercile exit | −0.000 | −0.004** |
| 3rd tercile entry | 0.002** | 0.001* | |
| NN5 | 3rd tercile exit | −0.001 | −0.004* |
| 3rd tercile entry | 0.002** | 0.001* | |
| NN3 | 3rd tercile exit | −0.000 | −0.004** |
| 3rd tercile entry | 0.002** | 0.001 | |
| NN1 | 3rd tercile exit | −0.002 | −0.005** |
| 3rd tercile entry | 0.002** | 0.000 | |
| IPWRA | 3rd tercile exit | −0.009 | −0.012** |
| 3rd tercile entry | 0.004 | 0.006* | |
Signification level: *p < 0.05; **p < 0.01; ***p < 0.001.
To contrast the goodness of the matching models, Table 6 presents, for the propensity score, the mean differences and the variance ratio between the treatment probability (probability of being a circular eco-innovator) and the counterfactual probability (probability of not being a circular eco-innovator) in the original sample (unmatched) and the matched sample. In all cases, the suitability of the matching models is confirmed: the firms in the matched sample exhibit very small differences (close to zero) in their propensity scores, and the variance ratio between the probability of engaging in circular eco-innovation and not engaging in it is close to one. These results contrast with the larger differences and variance ratios further from one observed in the original (unmatched) sample. This ensures that the differences between the considered firms are exclusively due to the differential effect of engaging in or not engaging in circular eco-innovation.
Balance tests for matching models. Mean differences and variance ratio in the propensity score (probability of being a circular eco-innovator).
| ATE | ATT | ||||||||||||
|---|---|---|---|---|---|---|---|---|---|---|---|---|---|
| Stand. differences | Var. ratio | #Obs. | Stand. differences | Var. ratio | #Obs. | ||||||||
| Unmatch. | Match. | Unmatch. | Match. | Unmatch. | Match. | Unmatch. | Match. | Unmatch. | Match. | Unmatch. | Match. | ||
| NN7 | 3rd tercile exit | 0.787 | 0.010 | 1.435 | 1.053 | 14,824 | 29,648 | 0.787 | 0.018 | 1.435 | 1.064 | 14,824 | 11,376 |
| 3rd tercile entry | 0.654 | 0.007 | 1.399 | 1.009 | 26,308 | 52,616 | 0.654 | 0.006 | 1.399 | 1.003 | 26,308 | 16,308 | |
| NN5 | 3rd tercile exit | 0.787 | 0.011 | 1.435 | 1.053 | 14,824 | 29,648 | 0.787 | 0.020 | 1.435 | 1.064 | 14,824 | 11,376 |
| 3rd tercile entry | 0.654 | 0.007 | 1.399 | 1.007 | 26,308 | 52,616 | 0.654 | 0.005 | 1.399 | 1.001 | 26,308 | 16,308 | |
| NN3 | 3rd tercile exit | 0.787 | 0.008 | 1.435 | 1.047 | 14,824 | 29,648 | 0.787 | 0.016 | 1.435 | 1.055 | 14,824 | 11,376 |
| 3rd tercile entry | 0.654 | 0.007 | 1.399 | 1.008 | 26,308 | 52,616 | 0.654 | 0.005 | 1.399 | 1.001 | 26,308 | 16,308 | |
| NN1 | 3rd tercile exit | 0.787 | 0.012 | 1.435 | 1.056 | 14,824 | 29,648 | 0.787 | 0.022 | 1.435 | 1.066 | 14,824 | 11,376 |
| 3rd tercile entry | 0.654 | 0.009 | 1.399 | 1.007 | 26,308 | 52,616 | 0.654 | 0.010 | 1.399 | 0.999 | 26,308 | 16,308 | |
| IPWRA | 3rd tercile exit | 0.787 | 0.130 | 1.435 | 1.231 | 14,824 | 14,824 | 0.787 | 0.183 | 1.435 | 1.186 | 14,824 | 14,824 |
| 3rd tercile entry | 0.654 | 0.057 | 1.399 | 1.153 | 26,308 | 26,308 | 0.654 | 0.103 | 1.399 | 1.145 | 26,308 | 26,308 | |
Matched and Unmatched samples.
Using panel data on Spanish manufacturers from 2003 to 2016, this paper studies the effects of adopting circular eco-innovations on firm performance. In particular, it analyses whether such practices can help companies to both reach and persist at a high-performing level.
We have conducted an original analysis of the role that circular eco-innovations can play in stimulating and maintaining firms’ productivity. Based on a mixed theoretical framework, we analyse the implications of adopting circular eco-innovations for performance, controlling for the presence of endogeneity and reverse causality between both variables. Using current literature on the drivers of eco-innovations to achieve the transition towards a CE, we identify the different factors that help and hinder the development of circular eco-innovations. Using the ‘persistence of profits’ literature, we analyse whether the persistence in the upper part of the productivity distribution is explained by the development of circular advantages by firms.
From a methodological point of view, a two-step strategy is applied to deal with the endogeneity between adoption of circular eco-innovations and firm performance. First, survival models are defined to estimate the probabilities of entry into and persistence in the 3rd tercile of productivity distribution. Afterwards, matching techniques are applied to know whether the companies with and without circular eco-innovations show significant differences in their ability to achieve and consolidate their top productivity position.
First, this paper focuses on circular eco-innovators that innovate to simultaneously reduce material and energy per unit of production and achieve a significant reduction in the environmental impact of their production. Based on this distinction, we find evidence about the important role of dynamic technological capabilities (internal, external R&D and the use of external sources of information that are valuable for innovating). Moreover, our empirical findings provide evidence that large firms have an advantage over SMEs (size) in adopting these transformative innovations. As we expected, young firms have a high probability of adopting circular eco-innovation and show a high degree of flexibility in integrating the principles of CE. Thus, R&D expenditure, together with the use of collaboration strategies and external sources of knowledge, are decisive for the development of circular eco-innovations. These results are similar to those of previous studies identifying the drivers of eco-innovation.
Second, survival models show the important role of circular eco-innovations improving firm performance. Empirical evidence suggests that firms adopting circular eco-innovations have a productivity advantage over firms with non-circular eco-innovations. Furthermore, we find a positive influence of adopting this type of eco-innovation on entry into and survival (no exit) in the group of high-productivity firms. Hence, higher innovative capabilities, presence in international markets and belonging to a business group are positively related to climbing and remaining at the top of the productivity distribution. In addition, the competitive environment also plays a crucial role: firms operating in the most technology-intensive sectors tend to present higher levels of mobility in productivity range than innovators belonging to medium- and low-tech sectors. Although it is beyond the scope of this research, the empirical findings suggest that product innovation is more decisive than process innovation in raising firms to better positions. Furthermore, the importance of process innovations, usually linked to cost reduction, is crucial for persistence in the group of high-performance firms but not for improving the productivity of underperforming firms.
Finally, the results suggest greater competitive advantages for circular eco-innovative firms. They show a higher probability of moving up to the upper part of the productivity distribution and a lower probability of exiting than firms that do not adopt circular eco-innovations. Estimates from matching techniques confirm that the adoption of circular eco-innovations favours being and surviving as a ‘super-star’ productivity firm. Therefore, circular eco-innovators have a greater ability to climb to high-performance status and are less likely to leave it. Therefore, the adoption of circular eco-innovations is aligned to achieve better performance and survive in the group of high-performing firms.
This research has interesting practical implications. Companies obtained CE benefits in terms of not only their green image or corporate social responsibility but also higher levels of productivity and firm performance. This evidence supports the Porter's ‘win-win’ arguments justifying the use of circular eco-innovations to shift the current economic paradigm. In addition to the social benefit inherent to environmental sustainability practices, the adoption of circular eco-innovations presents new market opportunities that, if well exploited, can result in new revenues for firms. Circular eco-innovations significantly improve performance.
Our research findings are also relevant for managers and policymakers. Managers should prioritise investments in circular eco-innovations for the competitive advantage they create. Managers should also integrate circular eco-innovations into their core business processes to enhance their market position and overall performance. Since circular eco-innovations not only enhance productivity but also increase the firm's probability to persist in the upper echelons of the productivity distribution, this type of innovation is fundamental to mitigate risks associated with the high level of uncertainty and competition in the markets. Furthermore, circular eco-innovations are essential to improve a firm's reputation and brand value as perceived by consumers and stakeholders. Being an eco-innovative and proactive firm in a CE can attract more customers and investors with high environmental awareness. Companies should increase investments in R&D and green technologies while enhancing their technological capabilities through cooperation and the use of external knowledge sources under the lens of CE paradigm. This strategy will not only foster eco-innovation but also strengthen long-term competitiveness and improve performance. This is particularly important in a context where achieving productivity gains is challenging due to fierce global competition. At the same time, such eco-innovations will enable companies to more easily balance wealth generation with the efficient use of natural resources and environmental protection.
Managers should prioritise investing in R&D for developing circular eco-innovations due to their significant benefits for productivity and long-term competitiveness. This is especially important for SMEs. Although large companies still have advantages in adopting circular eco-innovations and achieving or maintaining a high performance, younger companies are more likely to adopt circular eco-innovations than older ones, presenting new opportunities for them. SMEs can counter their small size by implementing circular eco-innovations, facilitating the shift from linear to circular business models. Furthermore, collaboration and the use of external knowledge will help young and small companies to form partnerships with other firms, research institutions, and industry associations in order to share knowledge and resources needed to adopt circular eco-innovations and achieving better performance or maintaining top positions in the medium and long term. Moreover, adopting eco-innovations that are compatible with the principles of CE can help firms comply with current and future environmental regulations. By adopting circular eco-innovations, companies will not only be able to satisfy environmentally conscious consumers, but also comply with stringent environmental regulations, such as those of the European Union, which is committed to the green transition. If circular eco-innovations offer the win–win opportunities for the firms exposed to environmental regulations (avoiding fines and improving performance) and there are government incentives and public funds available under the European Green Deal, this is an excellent opportunity to use these public funds efficiently, ensuring that the potential outcomes are both durable and visible in the medium and long term.
Policymakers should also provide incentives such as tax deductions, grants and subsidies to encourage firms to adopt circular eco-innovations. This will help firms survive in the markets. Regulation must promote CE practices such as eco-design, resource efficiency, waste minimisation, and recycling to increase the adoption of CE business models. Given the significant number of SMEs, public administrations should offer financial incentives to SMEs investing in circular eco-innovations. These funding programmes would not only support circular eco-innovations to facilitate this shift, but would also increase the survival of SMEs, mitigating potential job losses and even supply chain disruptions that could also affect large companies that rely on these SMEs. Considering the significant barriers they face, it is recommended to provide support or incentives to young companies and those that engage in technological collaboration and open innovation to help them adopt circular eco-innovations. In this regard, administrations should develop regulatory frameworks and laws that are not overly complex to facilitate the adoption of circular eco-innovations, especially for SMEs. Another recommendation is to promote public-private partnerships in order to foster collaboration between diverse actors, driving eco-innovation and the implementation of CE initiatives. In particular, as one of the technical barriers to CE is the lack of large-scale demonstration projects, supporting pilot projects and showing successful circular eco-innovations would encourage other companies, especially smaller ones.
Furthermore, public funding for R&D to accelerate the adoption of circular eco-innovations could not only improve firm productivity but also create a more sustainable and resilient economy in the long term, in line with the SDGs of the 2030 Agenda. From the perspective of policy recommendations, this outcome requires more than just circular eco-innovations. Circular eco-innovations should be gone together with policies that support product innovations -such as eco-design-, investments in employee training, export assistance programs and support for SMEs to join industry groups or open innovative networks.
Despite the results of this research, we must acknowledge several limitations. First, we used secondary data from the Spanish CIS (PITEC). Therefore, our measures were constrained by the data collected. Unfortunately, the data cover the period 2003–2016, and they cannot be updated because 2016 is the last wave available. Thus, we are aware of potential shifts that may have occurred after the data was collected given the increasing incentives for and support of eco-innovation to achieve CE in Spain under the European Green Deal policy. Second, the measures of circular eco-innovations and performance circularity used do not allow us to know what percentage of total innovation these eco-innovations account for (intensity of circular eco-innovation). Similarly, the availability of accounting data at the company level would allow an analysis of performance indicators other than productivity. Finally, our results are related to the influence of all circular eco-innovations. Overall, we stress the need to further investigate the different impacts of product and process innovations on performance in greater detail. They should also invite researchers to isolate the influence of the different types of circular eco-innovations (reduction of material, energy efficiency, etc.) considering the path dependence of circular eco-innovations. Future research should explore the impact of the European Green Deal on firm performance in greater depth. In particular, research is needed to evaluate the impact of these public funds on eco-innovation and the implementation of a circular economy within the industrial strategy for a competitive, green and digital Europe. Such studies could provide specific recommendations for eco-friendly innovation and sustainable growth strategies.
CRediT authorship contribution statementDavid Córcoles: Writing – original draft, Validation, Methodology, Investigation, Formal analysis, Data curation, Conceptualization. Ángela Triguero: Writing – original draft, Investigation, Formal analysis, Conceptualization.
The authors gratefully acknowledge the financial support from MICIU/AEI /10.13039/501100011033 and FEDER, UE (PID2023-151882OB-I00) and the financial support received by ISPEC Group from the Research Plan of the University of Castilla-La Mancha co-financing by the FEDER, UE (2022-GRIN-34135).
Variables definition.
| Variable | Definition | Obs.(#firms) | Mean | Std. Dev. |
|---|---|---|---|---|
| Variables used in circularity model (Eq. (1)) | ||||
| Circular ecoinnovation | Dependent variable in model (3). Dichotomous variable indicating when firm reports, simultaneously, high or medium interest in using of fewer materials per production unit, less energy per unit produced and a significant reduction in the environmental impact of its production system. 1= Medium or high interest; 0=low or no interest. | 49,048(6299) | 0.324 | 0.468 |
| Int.R&D | Dichotomous variable indicating if firm has internal R&D expenditures. 1=Yes, 0=No | 67,769(6866) | 0.594 | 0.491 |
| Ext.R&D | Dichotomous variable indicating if firm has external R&D expenditures. 1=Yes, 0=No | 67,762(6865) | 0.278 | 0.448 |
| Group | Dichotomous variable indicating whether firm belongs to a company group. 1=Yes, 0=No | 67,763(6866) | 0.401 | 0.490 |
| Cooperation | Dichotomous variable indicating whether firm cooperates with other firms. 1=Yes, 0=No | 55,057(6504) | 0.358 | 0.479 |
| Competitors | Dichotomous variable indicating whether firm shares information with competing firms. 1=Yes, 0=No | 48,961(6291) | 0.419 | 0.493 |
| Suppliers | Dichotomous variable indicating whether firm shares information with suppliers. 1=Yes, 0=No | 48,961(6291) | 0.582 | 0.493 |
| Clients | Dichotomous variable indicating whether firm shares information with clients. 1=Yes, 0=No | 48,961(6291) | 0.594 | 0.491 |
| Oth.Sourc. | Dichotomous variable indicating whether firm shares information with other external sources: external consultants, laboratories, universities and research institutes, conferences, fairs, professional organizations, scientific journals and/or technical publications. 1=Yes, 0=No | 48,961(6291) | 0.673 | 0.469 |
| Young | Dichotomous variable indicating whether indicating if it is a start-up company. 1=Yes, 0=No | 67,771(6866) | 0.005 | 0.072 |
| Size | Continuous variable. Total employment (in logarithms) | 67,773(6866) | 4.056 | 1.397 |
| Year | Categorical variable identifying the current year. Values 2003–2016. | 67,773(6866) | 2009.026 | 3.794 |
| Tang.Invest. | Continuous variable. Total investments in tangible assets (in logarithms) | 67,773(6866) | 9.245 | 5.847 |
| Sector | Categorical variable identifying the manufacturing sector for each firm: 3 Food, beverages and tobacco; 4 Textiles; 5 Clothing; 6 Leather, and footwear; 7 Wood and cork; 8 Paper; 9 Printing; 10 Chemicals products; 11 Pharmaceuticals products; 12 Plastic and rubber products; 13 Non-metal mineral products; 14 Basic metal products; 15 Fabricated metal products; 16 Computer products, electronics and optical; 17 Electric materials and accessories; 18 Machinery and equipment; 19 Vehicles and accessories; 20 Shipbuilding industry; 21 Aircraft and space industry; 22 Other transport equipment; 23 Furniture; 24 Other manufacturing. | 67,773(6866) | 12.617 | 5.821 |
| Variables used in survival models (Eqs. (2) and 3) | ||||
| Prob (Entry) | Dependent variable in model (1). Dichotomous variable indicating when firm is in a tercile different from 3rd at t-1 and is in 3rd tercile at t. 1=Yes, 0= No. | 45,530(5833) | 0.072 | 0.259 |
| Prob (Exit) | Dependent variable in model (2). Dichotomous variable indicating when firm is in the 3rd tercile at t-1 and in other different tercile at t. 1=Yes, 0= No. | 22,243(3545) | 0.135 | 0.342 |
| Product Innov. | Dichotomous variable indicating whether or not the firm develops innovation product. 1=Yes, 0=No | 67,774(6865) | 0.569 | 0.495 |
| Process Innov. | Dichotomous variable indicating whether the firm develops innovation process. 1=Yes, 0=No | 67,773(6865) | 0.546 | 0.498 |
| Export | Dichotomous variable indicating whether the firm sells its products in international markets. 1=Yes, 0=No | 64,135(6781) | 0.807 | 0.395 |
| Human K. | Percentage of graduated and PhD workers over total employment. | 66,126(6818) | 19,546 | 27.898 |
| Group | Dichotomous variable indicating whether the firm belongs to any company group. 1=Yes, 0=No | 67,773(6866) | 0.401 | 0.490 |
| Size Cat. | Categorical variable indicating the firm size. 1= small (less than 50 employees); 2=medium (50–199 employees); 3=large (200 or more employees). | 67,773(6866) | 1.717 | 0.779 |
| Age | Age of the firm (in number of years). | 64,618(5969) | 28.760 | 18.843 |
| Concentr. | Dichotomous variable indicating a medium or high importance of market dominance by established firms. 1=high or medium importance, 0= low or unimportant. | 64,135(6781) | 0.497 | 0.500 |
| Tech.Degree | Categorical variable indicating the technological level of the manufacturing sector in which the firm operates. 1= high and medium-high technology industries; 2=Medium technology industries; 3= Low technology industries. | 67,773(6866) | 1.976 | 0.800 |
| Spell Dur. (1) | Continuous variable measuring the number of consecutive years without being in 3rd tercile for model (1). In logarithms. | 45,530(5833) | 1.317 | 0.822 |
| Spell Dur. (2) | Continuous variable measuring the number of consecutive years firm is in 3rd tercile for model (2). In logarithms. | 22,243(3545) | 1.218 | 0.848 |
Source:PITEC.
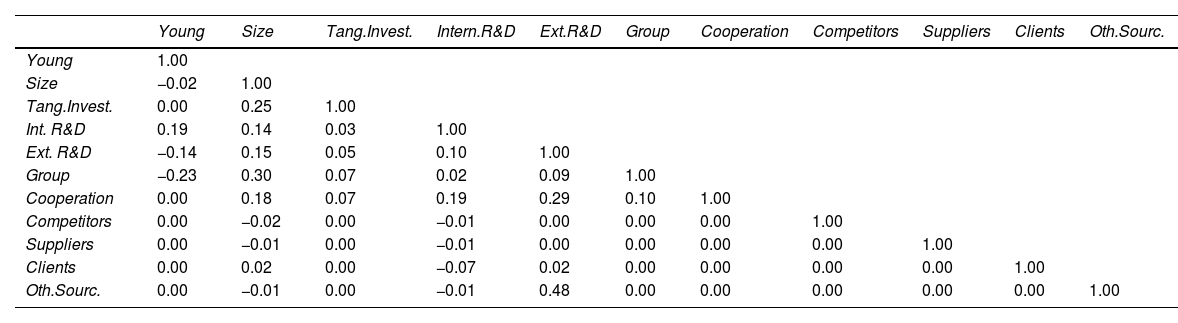
Correlation matrix of the explanatory variables for circularity model.
| Young | Size | Tang.Invest. | Intern.R&D | Ext.R&D | Group | Cooperation | Competitors | Suppliers | Clients | Oth.Sourc. | |
|---|---|---|---|---|---|---|---|---|---|---|---|
| Young | 1.00 | ||||||||||
| Size | −0.02 | 1.00 | |||||||||
| Tang.Invest. | 0.00 | 0.25 | 1.00 | ||||||||
| Int. R&D | 0.19 | 0.14 | 0.03 | 1.00 | |||||||
| Ext. R&D | −0.14 | 0.15 | 0.05 | 0.10 | 1.00 | ||||||
| Group | −0.23 | 0.30 | 0.07 | 0.02 | 0.09 | 1.00 | |||||
| Cooperation | 0.00 | 0.18 | 0.07 | 0.19 | 0.29 | 0.10 | 1.00 | ||||
| Competitors | 0.00 | −0.02 | 0.00 | −0.01 | 0.00 | 0.00 | 0.00 | 1.00 | |||
| Suppliers | 0.00 | −0.01 | 0.00 | −0.01 | 0.00 | 0.00 | 0.00 | 0.00 | 1.00 | ||
| Clients | 0.00 | 0.02 | 0.00 | −0.07 | 0.02 | 0.00 | 0.00 | 0.00 | 0.00 | 1.00 | |
| Oth.Sourc. | 0.00 | −0.01 | 0.00 | −0.01 | 0.48 | 0.00 | 0.00 | 0.00 | 0.00 | 0.00 | 1.00 |
Source:PITEC.
Correlation matrix of the explanatory variables for survival model.
| Group | Human K. | Product Innov. | Process Innov. | Export | Size Cat. | Concentr. | Tech.Degree | Spell Dur. | |
|---|---|---|---|---|---|---|---|---|---|
| Group | 1.00 | ||||||||
| Human K. | −0.01 | 1.00 | |||||||
| Product Innov. | 0.06 | −0.01 | 1.00 | ||||||
| Process Innov. | 0.01 | 0.57 | 0.18 | 1.00 | |||||
| Export | −0.01 | 0.00 | −0.01 | 0.57 | 1.00 | ||||
| Size Cat. | 0.34 | −0.02 | 0.16 | 0.04 | −0.01 | 1.00 | |||
| Concentr. | 0.06 | −0.01 | 0.05 | 0.05 | −0.01 | −0.10 | 1.00 | ||
| Tech.Degree | −0.07 | −0.01 | 0.01 | −0.10 | −0.02 | 0.00 | −0.01 | 1.00 | |
| Spell Dur. | −0.01 | 0.00 | −0.01 | −0.01 | 0.00 | −0.02 | −0.01 | −0.02 | 1.00 |
Source:PITEC.
The transformative potential of the ‘pro-environment’ family of eco-innovation-related concepts (environmental innovation, sustainable innovation, green innovation, business model innovations for sustainability and eco-innovation) has largely been corroborated (de Jesus et al., 2018).
Surprisingly, this positive effect of eco-innovations does not extend to the extreme percentiles of the growth rate distribution probably because age exerts a moderating effect as older firms with experience perform better.
Stability and persistence in profits are terms used in economic literature describe a firm's financial performance over time, but they are not the same. While stability is associated with low volatility in the short term (profits remain relatively steady and attract more investors because of predictable returns), persistence is related to the ability of a firm to maintain high levels of profit over an extended period (profits continue to be higher than average).
As a robustness check, additional criteria have been considered to distinguish between circular eco-innovators and non-circular eco-innovators. Specifically, 1) when the company shows high or medium interest in at least one of the characteristics and some level of interest in the others; 2) the company shows some level of interest (high, medium or low) in all CE characteristics. In broad terms, the results are quite similar, confirming the robustness of the model. These estimates are available upon request.
As in Cainelli et al. (2011), labour productivity is measured as the ratio between sales at current prices and number of employees.
Alternatively, total factor productivity (TFP) has also been estimated, with quite similar results. However, given the greater complexity of this variable and the significant loss of observations, we confirm that sales per employee is more suitable for our estimations. The results for TFP are available upon request.
As a robustness check, we have calculated alternative quantiles for the productivity variable. Specifically, we have estimated four productivity groups by quartiles and two groups with respect to the median. In both cases, the results are very similar to those obtained with terciles. These results are also available upon request.