


Methamphetamine use disorder (MUD) is characterized by prominent psychological craving and its relapsing nature. Previous studies have linked trait impulsivity and abstinence duration to drug use, but the neural substrates of drug cue-induced craving and its relationship with these traits remain unclear in MUD.
MethodsWe acquired high-density resting-state electroencephalography (EEG) after participants watched a five-minute video demonstrating methamphetamine use. Combining precise source imaging to reconstruct brain activities with connectome predictive modeling (CPM), we built a craving-specific network within beta band activity from two independent MUD cohorts (N=144 for model development and N=47 for validation).
ResultsThis network reveals a unified neural signature for craving in MUD, spanning multiple brain networks including the medial prefrontal, frontal parietal, and subcortical networks. Our findings underscored the mediating role of this craving connectome profile in modulating the relationship between abstinence duration and craving intensity. Moreover, trait impulsivity mediated the relationship between the EEG-derived craving connectome and cue-induced craving.
ConclusionThis study presents a novel predictive model that utilizes sourced connectivity from high-density EEG of resting-state recording to successfully predict methamphetamine craving in abstinent individuals with MUD. These results shed light on the cognitive organization involved in craving, involving cognitive control, attention, and reward reactivity. A comprehensive analysis reveals EEG data's capacity to decipher craving's complex dynamics, facilitating improved understanding and targeted treatments for substance use disorders.
Methamphetamine use disorder (MUD) is a pressing medical and socioeconomic concern (Farrell et al., 2019; Han et al., 2021; Paulus and Stewart, 2020). Craving, a core aspect of substance use disorders (SUDs), serves as a critical marker and predictor of methamphetamine abuse and relapse (Suzuki and Kober, 2018; Vafaie and Kober, 2022). Thus, craving has garnered attention as a promising target for therapeutic intervention in MUD (Cavicchioli et al., 2020; Tiffany and Wray, 2012; Wu et al., 2022; Fang et al., 2022). However, the subjective and multifaceted nature of craving poses challenges to reaching a unified theoretical understanding (Sayette, 2016). Although research has pinpointed various personal traits, cognitive processes and brain circuits associated with drug craving (Hayes et al., 2020; Parvaz et al., 2022), their interactive roles in influencing drug intake is not fully deciphered, thereby constraining the translation of these findings into real clinical practice (Sayette, 2016; Ekhtiari et al., 2016).
To develop a more integrated framework for understanding the mechanisms of craving, researchers have recently shifted towards examining the brain-behavior relationship from a network-level perspective, moving beyond the study of isolated brain regions (Axer and Amunts, 2022). Initiated on this conceptual groundwork, Connectome-based Predictive Modeling (CPM), a data-driven machine learning approach, has proven effective in analyzing neuroimaging data (Shen et al., 2017). Its computational efficiency and simplicity present substantial advantages over other machine learning algorithms, enhancing its applicability in research and clinical settings. With its inherent cross-validation and independent out-sample validation processes, CPM stands out for its improved generalizability. The effectiveness and reliability of CPM in mapping the neural substrates of cognitive functions are well-documented across previous studies (Anderson and Barbey, 2023; Ibrahim et al., 2021; Ovando-Tellez et al., 2022). CPM's emphasis on hyperconnectivity and network integrity has been instrumental in deepening insights into the intricate functional organization of cognitive and brain activities (Ju et al., 2020; Kabbara et al., 2022; Liu et al., 2021). By integrating CPM with functional magnetic resonance imaging (fMRI), researchers have investigated the complex pathophysiology of SUDs related to opioids, cocaine, and nicotine (Lichenstein et al., 2021; Lin et al., 2022; Yang et al., 2023; Yip et al., 2019). These studies employing CPM-fMRI have not only validated but also broadened previous insights, highlighting the engagement of broad brain networks - including frontoparietal, medial frontal, and subcortical networks (FPN, MFN, and SCN) - and their corresponding functions, such as cognitive/executive control and reward responsiveness, in the context of SUDs (Yip et al., 2019, 2020). While these investigations provide a detailed portrait of the connectome in various SUDs, studies specifically examining network relationships unique to MUD remain limited. The substance-specific patterns, as observed in prior CPM study (Lichenstein et al., 2021), are crucial for tailoring MUD-specific therapeutic strategies.
Beyond fMRI, EEG has become an indispensable tool for exploring the brain networks implicated in SUDs due to its clinical applicability, cost-effectiveness, and widespread availability. Previous research has identified reliable neuromarkers of craving within EEG recordings from cue-response paradigms, such as event-related potentials and brain oscillations (Khajehpour et al., 2022; Lubman et al., 2007; Parvaz et al., 2016; Zhang et al., 2021). Resting-state EEG (rsEEG) also demonstrates promise in predicting cognitive abilities and classifying individuals with SUDs through brain functional connectivity (Hakim et al., 2021; Khajehpour et al., 2019). The original paper by Shen et al. (2017) recommended using CPM with EEG, yet such investigations remain rare. Moreover, high-density EEG (HD-EEG) recordings, known for their detailed examination of neurocircuitry associated with SUDs (Parvaz et al., 2011; Son et al., 2015; Stoyell et al., 2021), offer direct access to both regional and global brain activity, thus providing superior precision compared to traditional EEG recordings (He et al., 2018; Nemtsas et al., 2017; Seeber et al., 2019). Despite this increased spatial resolution, research using EEG source functional connectivity in SUDs studies remains scarce. Utilizing CPM with source imaging to capture the extensive neural diversity between individuals with MUD and to harness HD-EEG's high spatial resolution presents a groundbreaking opportunity. Identifying connectomes related to craving intensity at electrophysiological levels through EEG signals paves a new way for understanding the neurophysiological underpinnings of drug craving, as well as for enhancing relapse risk assessments and clinical management strategies.
Craving is intricately linked to abstinence duration and various neuropsychological factors, including impulsivity, depression, and anxiety. Prolonged abstinence often coincides with reduced craving and improved neurocognitive conditions, suggesting the restoration of underlying brain networks and cognitive function (Potvin et al., 2014; Schulte et al., 2014). According to compulsive theories of addiction, such reductions may reflect diminished compulsive behaviors and impulsivity—factors central to the addictive cycle (Everitt and Robbins, 2016). Yet, the specific pathways through which abstinence mitigates craving and the precise role of neuropsychological traits remain unclear, posing a critical gap in our understanding of addiction mechanisms.
Evidence indicates that craving and impulsivity interact dynamically, with heightened craving undermining inhibitory control (Gauggel et al., 2010; Kreusch et al., 2017) and altering neurophysiological markers of inhibition (Ceceli et al., 2023; Batschelet et al., 2021; Stein et al., 2018). These findings underscore the importance of cognitive control in modulating craving, resonating with conceptual frameworks that emphasize the tension between craving-related urges and top-down regulatory processes (Stacy and Wiers, 2010; Zilverstand et al., 2018; Deutsch and Strack, 2006; Volkow and Baler, 2014). Understanding how trait impulsivity in MUD is represented in neural connectivity and influences craving intensity will help clarify these complex interactions. This perspective offers a strong foundation for applying CPM-EEG to advance our grasp of addiction's neural underpinnings and guiding more targeted therapeutic interventions for MUD.
In this cross-sectional EEG study, we utilize CPM with cross-validated analysis to explore the brain connectivity patterns associated with craving intensity in individuals with MUD. Specifically, we apply CPM to rsEEG data from MUD subjects to identify the neural networks predicting their craving to methamphetamine. Drawing on prior results (Yip et al., 2019; Zhao et al., 2021), we hypothesize that beta activity within and across the MFN, FPN, and SCN plays a crucial role in predicting individual variations in craving intensity. Our approach includes validating the model's generalizability with an independent sample and thoroughly examining each network's contribution to predictivity. We also investigate the mediating effects of the CPM-identified craving network on the relationship between individual drug use profiles (e.g., duration of abstinence, years of drug use before abstinence) and craving intensity. Additionally, we explore how trait neuropsychological profiles (i.e., impulsivity) mediate the relationship between the CPM craving network and craving intensity to validate the theoretical pathway between brain patterns and craving. By analyzing the utility of CPM in predicting a range of other drug-use-related profiles, we aim to evaluate the robustness of our CPM for craving prediction. Furthermore, we delve into discussing the promising implications of using CPM with EEG source functional connectivity in broader SUD research.
Materials and methodsParticipantsWe recruited 198 male participants (cohort 1: n = 151, cohort 2: n = 47) diagnosed with MUD and currently abstinent. An additional 73 healthy individuals were recruited to serve as control participants, with both groups being balanced in terms of age, educational background, smoking status, and alcohol consumption. All individuals with MUD all came from long-term residential treatment facilities, where all their medical treatment and drug use information was recorded. Upon admission to these programs, urine screenings confirmed positive results for drug use. These individuals were previously included in our prior studies where different indices were reported, and the overarching data-collection workflow was maintained as per the established protocol (Zhao et al., 2021, 2023). Inclusion criteria were as follows: (1) A primary diagnosis of methamphetamine use disorder before admission, confirmed by a senior psychiatrist according to the DSM-5 criteria for moderate to severe disorder. (2) Exclusion of severe psychiatric conditions such as schizophrenia, bipolar disorder, or severe major depression by the psychiatrist. (3) A history of exclusive methamphetamine uses for at least one year, with usage of at least three times per week over a continuous month (occasional drug use was not considered) and a dosage exceeding 0.1 g/day. (4) All participants declared no current or historical neurological or psychiatric disorders, exclusive methamphetamine use without concurrent abuse of other substances, and no ongoing medical treatments or intervention programs. Participants were informed of their right to withdraw from the study at any time without repercussion and were provided with appropriate support and resources if needed. Seven of 151 participants were excluded from the EEG analysis due to poor data quality (>50% EEG data contaminated) following artificial rejection, yielding a final sample of 144 participants. An independent validation sample (N = 47) was incorporated into the study, comprising data collected by the same research team during a later period using identical procedures. This external validation sample followed the same inclusion criteria and processes as the primary training sample to ensure consistency and reliability.
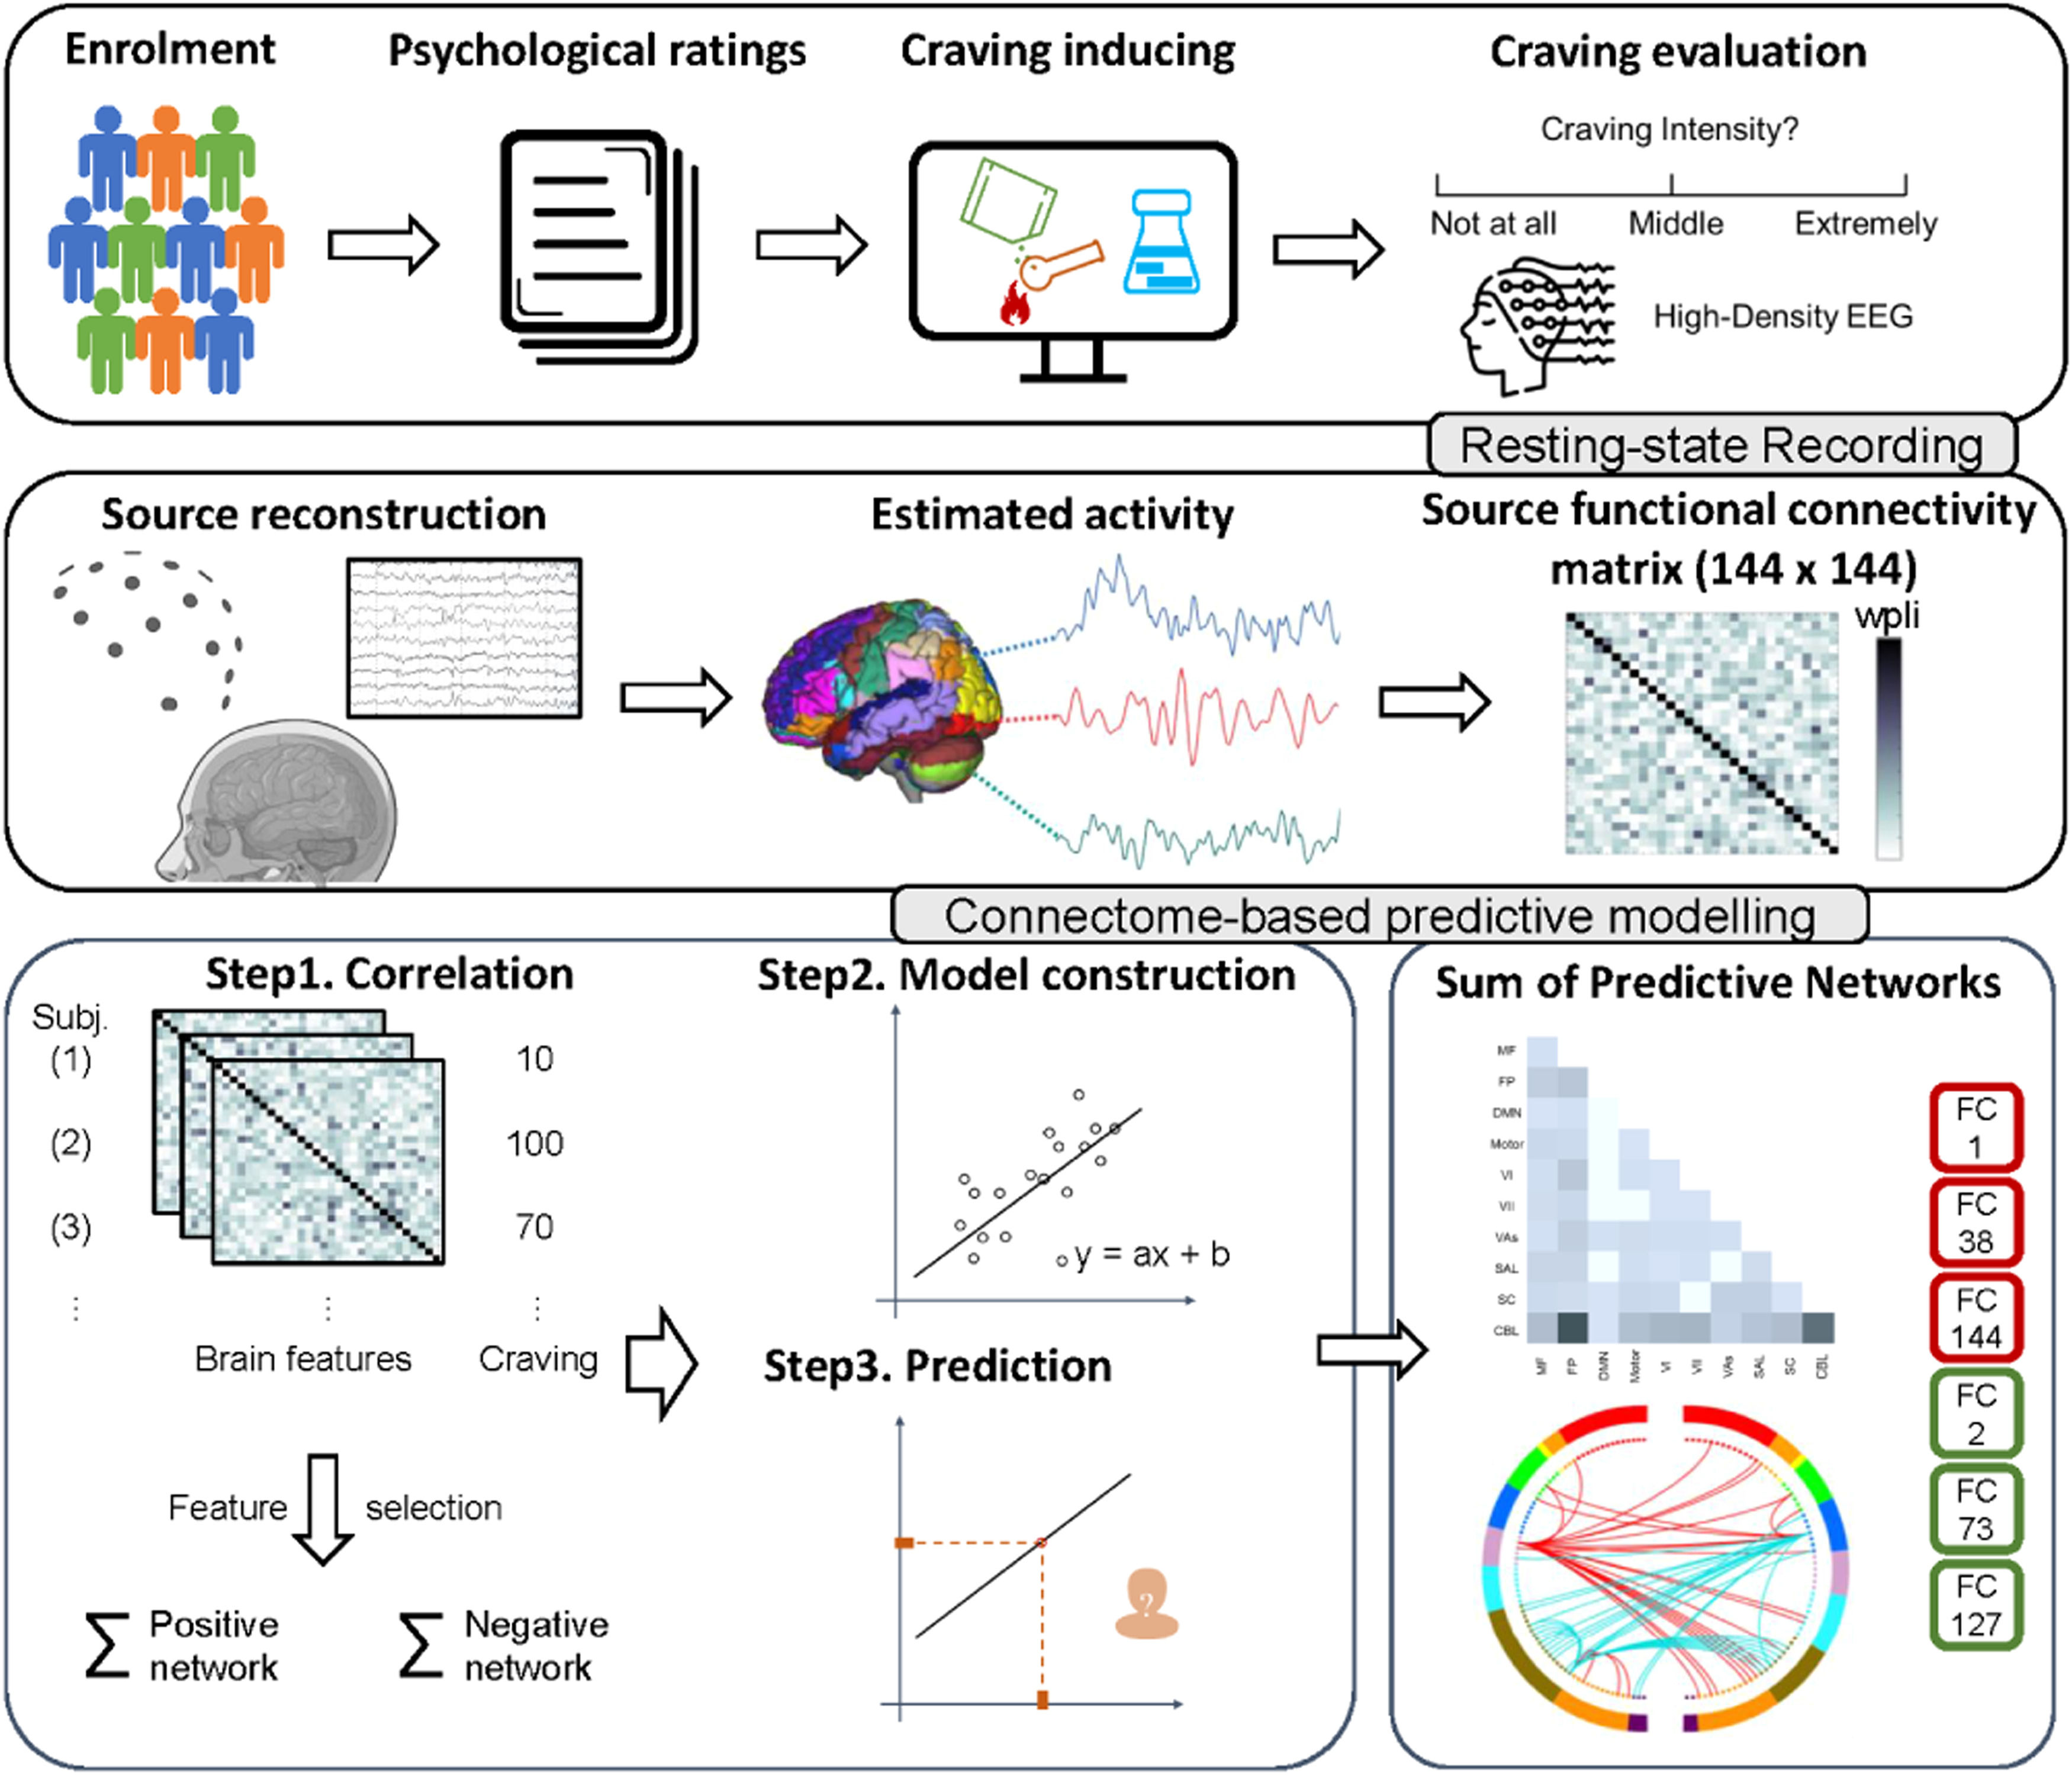
Study design and procedureThe study employed a cross-sectional design and included a series of procedures for the participants, encompassing neuropsychological assessments, craving evaluation, and rsEEG acquisition (detailed descriptions of these procedures are illustrated below and in the supplementary materials). A visual representation of the experimental and analysis protocols can be found in Fig. 1.

Flowchart of the study's experimental procedures and connectome-based predictive modeling (CPM) with EEG source imaging
The top row illustrates the data collection process, including participant screening, neuropsychological assessments, craving evaluations, and rs-EEG acquisition. The middle row demonstrates the rsEEG analysis pipeline, covering source localization from preprocessed EEG signals. The distinct EEG source functional connectivity matrices across different frequency bands are processed separately. The bottom row presents an adaptation of CPM process, detailing the model building up from connectivity matrix to the final predictive model and the visualization of the identified connectivity patterns.
Participants first underwent an interview to compile a comprehensive history of their substance use, which was followed by a series of neuropsychological assessments aimed at quantifying their neuropsychological profiles. These assessments employed standardized tools commonly used in psychiatric studies, including the Beck Depression Inventory (BDI) for depression, the Beck Anxiety Inventory (BAI) for anxiety, the Pittsburgh Sleep Quality Index (PSQI) for sleep quality, and the Barratt Impulsiveness Scale (BIS) for impulsivity. Following these evaluations, peak provoked craving (PPC) was assessed using a robust craving intensity measurement protocol (Sayette, 2016; Tian et al., 2024). Participants viewed a five-minute video depicting real-life methamphetamine use, then rated their craving intensity on a visual analogue scale ranging from 0 (no craving) to 100 (extremely intense craving). Detailed results for each measure, including population profiles and scoring methods, are provided in the supplementary materials.
EEG data acquisition and preprocessingFollowing the neuropsychological evaluations and PPC assessments, EEG data acquisition took place in a sound-attenuated room. We acquired HD-EEG data using a 128-channel Geodesic Sensor Net (EGI), capturing resting state data at a sampling rate of 500 Hz for 5 min with participants' first eyes closed and then eyes open. We focused on eyes-closed rsEEG in current study but also constructed CPMs based on eyes-open data solely for benchmarking the modeling performance against the eyes-closed condition. The data were bandpass filtered online from 0.01 to 1000 Hz, using the vertex electrode (Cz) as the reference. We processed the rsEEG data with the Fieldtrip software package (https://www.fieldtriptoolbox.org/) and custom Matlab (R2020b) scripts, adhering to our established protocols (Zhao et al., 2021).
Source localizationThe processed “clean” EEG signal was filtered into four frequency bands: theta (4–8 Hz), alpha (8–13 Hz), beta (13–30 Hz), and gamma (30–50 Hz). For each band, cortical source localization was conducted using the Brainstorm toolbox, which is open-source software distributed under the GNU General Public License (http://neuroimage.usc.edu/brainstorm), supplemented by customed Matlab scripts. Subsequently, power spectral densities were calculated within the source space.
We utilized the Weighted Phase Lag Index (WPLI), a statistical metric that assesses interdependence between brain regions based on phase-lag between EEG time series. The Automated Anatomical Labeling Atlas 3 (AAL3) template was employed to divide the cortical surface into regions, with small regions of interest (ROIs) containing fewer than 10 voxels excluded. This resulted in 144 nodes (ROIs). Time-resolved WPLI was computed for each of the four frequency bands, yielding a total of 10,296 possible edges (144 × 143/2 connectivity matrix) for each frequency band. Detailed descriptions of the EEG preprocessing and source localization methodologies are provided in the supplementary materials.
CPM for methamphetamine cravingCPM was employed to predict craving using published MATLAB scripts (Shen et al., 2017). A schematic diagram of the complete CPM is presented in Fig. 1. After preprocessing of EEG and source estimation, matrices for all subjects (i.e., each has 10,296 WPLI features) for four frequency bands were prepared for CPM (N = 144).
CPM utilized all unique features in the EEG source connectivity matrix of each frequency band as input variables to predict craving for methamphetamine. Pearson's correlation was used to examine the relationship between connectivity matrix and craving intensity. The resulting matrices included effect size (correlation coefficient between 0 and 1), direction (positive or negative), and significance test (p) for the correlation. Two networks were defined based on the direction of correlation: the positive networks represented connectivity increased with craving, while the negative networks represented connectivity decreased with craving.
The identified networks (features) and model parameters were then applied to the EEG data of novel subjects to predict their craving score. The Spearman’s rho correlations and root mean square error (RMSE) between the predicted and actual cravings were assessed for model evaluations. Internal validation was performed using the leave-one-out cross-validation (LOOCV) and the 5/10-fold cross-validation of 100 iterations to assess model stability. To evaluate significance, a permutation test is carried out for each model. Specifically, the behavioral data (here, the craving intensity) for all cases in the training sample are shuffled followed by CPM modeling, after which the correspondence and RMSE between the shuffled craving scores and the prediction estimated from shuffled model is calculated. This process was repeated 1000 times, yielding the corresponding CPM and r as well as RMSE values for each iteration. P values of correspondence r and RMSE (the likelihood of the constructed model is by chance) are computed based on the proportion of iterations where rpermutation > ractual (or RMSEpermutation > RMSEactual) divided by the total number of permutations (1000).
Replication and out-of-sample generalizationThe validity of CPM was established through replication and generalization procedures. Initially, our investigation involved the construction of distinct CPM models for four frequency bands (theta: 4–8 Hz; alpha: 8–13 Hz; beta: 13–30 Hz; gamma: 30–50 Hz) as they are known to reflect diverse brain activities. Through replicating the analysis for each frequency band, we ensured robustness and reliability in our findings.
By selectively considering the edges that consistently exhibited significance in 95% of cross-validation iterations, we identified two key networks: a positive network and a negative network. Subsequently, we adopted a linear regression model, considering the connectivity sums within each network as independent variables, while craving served as the dependent variable:

To assess the generalizability of our findings to external and future data, we extended our analysis by applying the two prominent networks (∑xpositive is the sum of positive networks and ∑xnegative is the sum of the negative networks for each case) and the parameters (W1, W2 and B) derived from the training sample to the data points in an independent test sample (N = 47). The model's performance on the external sample was evaluated using Spearman correlation.
Visualization of predictive networksTo illustrate the neural patterns predictive of PPC, we classified the nodes and connectivity within the prominent networks (i.e., edges appearing in at least 95% of the LOOCV iterations during CPM construction) into anatomic networks. We then calculated the number of connections within each macro network, separately summarizing them into positive, negative, and combined edges sets.
In addition to visualizing the brain into 144 nodes of AAL3 or anatomic networks, we further segmented these nodes into predefined large-scale functional networks based on their voxel distributions to allow for comparability with previous studies at the network level (Finn et al., 2015; Yip et al., 2020). These two types of visualization are both conducted using BioImage Suite Web 1.0 (https://bioimagesuiteweb.github.io/webapp/connviewer.html), following a similar methodology as previous CPM studies (Shen et al., 2017), along with utilizing in-house Matlab scripts.
Sensitivity analysisTo test the robustness of MFN, FPN, and SCN in our predictive model, we re-performed the CPM with virtual lesioning analysis. Besides, we examined the robustness of nodes in other networks to ensure a thorough assessment of their contributions to the predictive model. To determine the significance of the predictive contribution of specific networks, we used the Steiger's Z test to compare the whole-brain predictive model with the lesioned predictive model (Ovando-Tellez et al., 2022; Steiger, 1980). Additionally, we tested CPM's ability to classify individuals with MUD versus profile-matched healthy controls (N = 73) by switching the feature selection method from Peason's correlation to t-tests and substituting robust regression with a support vector machine (SVM) algorithm for fitting and prediction. To further assess the efficacy of CPM using rsEEG source imaging for predicting factors related to craving, we developed CPMs for a range of outcomes, including the duration of days since last meth use (days of abstinence), the overall years of consistent meth use, and daily methamphetamine intake. These exploratory analyses involved testing a broad spectrum of thresholds to delineate the impact of threshold selection on the construction and effectiveness of CPMs.
Mediation analysisWe conducted mediation analyses to explore the relationships among methamphetamine use profiles, neuropsychological profiles, craving intensity, and the craving-related connectome derived from CPM-EEG. The first analysis examined how methamphetamine use profiles (e.g., duration of abstinence, years of drug use) influence craving intensity via the craving connectome. The second analysis investigated the potential mediating role of neuropsychological profiles (i.e., impulsivity, depression, and anxiety) between the craving connectome and craving intensity. Given the intricate role of impulsivity in craving among abstinent individuals with MUD, we conducted a post-hoc mediation analysis to examine how impulsivity influences the relationship between abstinence and craving (Tziortzis et al., 2011; Stevens et al., 2014). We calculated regression coefficients for each path and applied bootstrapping with 5000 iterations to estimate bias-corrected and accelerated confidence intervals. All analyses were conducted using the PROCESS for R (Version 4.0.1) in R.
ResultsThe relationship between craving and other clinical demographicsPearson’s correlation analysis revealed a positive correlation between craving intensity and both the dose of methamphetamine use (r = 0.24, p < 0.01) and sleep quality (r = 0.19, p = 0.02), alongside a negative correlation with abstinence duration (r = -0.26, p < 0.01). However, correlations between craving and other factors such as age (r = 0.10, p = 0.22), years of education (r = -0.13, p = 0.13), and years of regular methamphetamine use (r = 0.07, p = 0.43) were not statistically significant. Except for the years of regular meth use, no significant differences in clinical demographics were observed between dataset 1 and dataset 2 (Table 1).
The demographic and neuropsychological characteristics for two training and test.
| Training (n=144) | Test (n=47) | t | p-value | |
|---|---|---|---|---|
| Age, mean (SD) | 37.82 (7.91) | 36.26 (6.9) | -1.30 | 0.197 |
| Education years, mean (SD) | 8.60 (3.35) | 8.64 (3.03) | 0.07 | 0.948 |
| Years of regular Meth use, mean (SD) | 8.85(5.26) | 7.16(4.27) | -2.22 | 0.029 |
| Methamphetamine dose per day (mg), mean (SD) | 15.27 (13.60) | 13.17 (13.42) | -0.93 | 0.357 |
| Days after the last Meth use, mean (SD) | 217.67 (186.17) | 197.13 (184.86) | -0.66 | 0.511 |
| No. DSM-V criteria symptoms, mean (SD) | 7.42 (2.53) | 6.83 (2.87) | -1.27 | 0.209 |
| Sleep quality (PSQI), mean (SD) | 6.67(3.60) | 5.47(3.75) | -1.93 | 0.057 |
| Depression (BDI), mean (SD) | 14.21(9.24) | 13.40(9.36) | -0.50 | 0.615 |
| Impulsivity (BIS), mean (SD) | 83.49(17.33) | 78.11(20.89) | -1.60 | 0.115 |
| Anxiety (BAI), mean (SD) | 27.18 (7.37) | 28.36(10.32) | 0.73 | 0.470 |
| Self-report Craving, mean (SD) | 54.03 (28.43) | 53.51 (27.27) | -0.11 | 0.911 |
A summary of the profile and the comparison of participants' demographic information, drug use characteristics, and relevant psychological and clinical factors between two datasets. The only significant difference is the years of regular Meth use between two groups.
In this study, we developed prediction models for drug craving in individuals with MUD using source connectivity of different frequency bands (theta, alpha, beta, and gamma) from rsEEG data. For our primary focus of eyes closed EEG, the functional connectivity matrix of beta activity successfully and stably underwent internal cross-validation procedures, including LOOCV and 5/10-fold cross-validation. Our results of beta CPM demonstrated a significant correspondence between the observed craving and the predicted craving derived from CPM (threshold 0.010: spearman correlation r = 0.234, permutation p = 0.011; threshold 0.020: correlation r = 0.229, permutation p = 0.013; threshold 0.050: correlation r = 0.212, permutation p = 0.020) when using less stringent thresholds for edge selection (Table 2). Combining the success rate of CPM construction during cross-validation with LOOCV and 5/10-fold cross-validation outcomes, we observed that thresholds of 0.02 and 0.05 demonstrated more stable performance compared to 0.01. Interestingly, incorporating more edges with a higher stringent threshold (i.e., 0.05 compared to 0.02) significantly decreased the performance of the predictive model, as determined by the Steiger's Z test (Z = 2.548, p = 0.011). For a clearer visualization, the illustrations below only depicted the networks of beta activity with a threshold of p = 0.02 (Fig. 2). Both the 5-fold and 10-fold cross validation displayed similar results (5-fold CV: r = 0.214(0.047), 10-fold CV: 0.229(0.030), Table 2). Detailed modeling results for other frequency bands and thresholds are available in the supplemental materials (Table S1).
The CPM performance with LOO- and 5/10-fold- cross validation under different thresholds.
| Threshold for feature selection | CPM performance (LOO-CV) | 5-fold CV | 10-fold CV | ||||||
|---|---|---|---|---|---|---|---|---|---|
| rspearman | ppermutation | RMSE | ppermutation | success rate | rmedian | rsd | rmedian | rsd | |
| 0.001 | 0.190 | 0.143 | 28.714 | 0.265 | 14.70% | -0.026 | 0.070 | 0.049 | 0.063 |
| 0.002 | 0.116 | 0.313 | 29.422 | 0.654 | 24.30% | 0.047 | 0.066 | 0.101 | 0.071 |
| 0.010 | 0.234 | 0.011 | 28.154 | 0.003 | 63.10% | 0.193 | 0.053 | 0.222 | 0.038 |
| 0.020 | 0.229 | 0.018 | 28.115 | 0.005 | 85.77% | 0.209 | 0.049 | 0.220 | 0.034 |
| 0.050 | 0.212 | 0.017 | 28.086 | 0.003 | 99.60% | 0.226 | 0.045 | 0.218 | 0.030 |
The performance of LOOCV for CPM was assessed by the Spearman’s rank correlation (rspearman). For CPM with 5/10-fold cross-validation (CV), the median (rmedian) and standard deviance (rsd) were reported based on 100 iterations. The success rate indicates the percentage of shuffled data in the permutation test that yielded a sufficient number of features for CPM analysis. RMSE: root mean square error; LOO: Left-one-out; CV: cross validation; r: Spearman's rank correlation coefficients; rmedian: the median of r for all the cross validation; rsd: the standard deviance of r for all the cross validation.
 and the performance of CPM using LOOCV internal validation. In Panel A, the diagram presents the positive (upper) and negative (bottom) craving networks. Nodes displayed in red indicate the positive network, where increased edge weights (increased connectivity) correspond to higher self-reported craving for methamphetamine. In contrast, nodes shown in blue represent the negative network, with decreased edge weights (decreased connectivity) associated with elevated self-reported craving. Node size reflects the number of edges, with larger spheres indicating more edges and smaller spheres denoting fewer edges. Panel B illustrates the correlation between actual self-reported craving and predicted craving by CPM.")
CPM craving networks (positive and negative) and the performance of CPM using LOOCV internal validation.
In Panel A, the diagram presents the positive (upper) and negative (bottom) craving networks. Nodes displayed in red indicate the positive network, where increased edge weights (increased connectivity) correspond to higher self-reported craving for methamphetamine. In contrast, nodes shown in blue represent the negative network, with decreased edge weights (decreased connectivity) associated with elevated self-reported craving. Node size reflects the number of edges, with larger spheres indicating more edges and smaller spheres denoting fewer edges. Panel B illustrates the correlation between actual self-reported craving and predicted craving by CPM.
Fig. 3 provides an exhaustive illustration of the prominent positive and negative craving networks, highlighting macroscale connectivity between various brain regions, including the frontal, parietal, occipital, and temporal lobes, along with subcortical areas. The positive network, comprising 121 edges, exhibits high-degree nodes that connect the occipital network with the prefrontal, subcortical, and occipital networks. In contrast, the negative network, comprising 158 edges, showcases connections between the cerebellum and temporal network, as well as within the cerebellum network itself. It is noteworthy that these networks collectively represent less than 5.42% of all possible connections, emphasizing the specific and targeted nature of the neural connectivity associated with drug craving in MUD.
Network based analysis
To further explore the identified craving networks, we mapped the 144 ROIs onto predefined canonical neural networks. Fig. 4 provides a comprehensive summary of the connectivity patterns within and between these networks, including the MFN, FPN, default mode network (DMN), and other networks. The positive and negative networks exhibited distinct patterns and numbers of connections, but neither network alone could be used to predict craving intensity independently (failed to build CPMs). In the overall model, the positive network displayed numerous connections originating from the FPN, SCN and cerebellar networks, projecting to other networks, particularly the motor/sensory and visual association networks. On the other hand, the negative network was characterized by connections originating from the cerebellar network and projecting to the MFN, FPN, motor/sensory, and visual I/II networks, in addition to showing within-cerebellar connections.
, frontoparietal (FP), and visual association (VAs) exhibit varying degrees of engagement in the craving network, as evidenced by the color coding.")
The summary of CPM craving networks based on canonical networks
MF: medial frontal network; FP: frontoparietal network; DMN: default mode network; Motor: motor network; VI: Visual I network; VII Visual II network; VAs: visual associated network; SAL: salience network; SC: subcortical networks; CBL: cerebellum network.
This figure illustrates the inter-network connectivity strength within the craving-associated connectome. Each square reflects the connection density between or within canonical brain networks in individuals with MUD. The color gradient represents the magnitude of connectivity: deeper shades signify a greater number of connections, whereas lighter shades denote fewer connections. Key networks such as the medial frontal (MF), frontoparietal (FP), and visual association (VAs) exhibit varying degrees of engagement in the craving network, as evidenced by the color coding.
We systematically removed each of the primary networks and their connected edges while retaining all other edges, and then re-ran CPM using this subset of edges. Remarkably, even when individual primary networks were 'knocked out', the predictive models could still be constructed. The 'lesioned' models predicting craving intensity remained significant when applied to the lesioned connectivity matrices (FPN-lesioned model: rspearman = 0.236, p = 0.004; DMN-lesioned model: rspearman = 0.235, p = 0.008; MFN-lesioned model: rspearman = 0.209, p = 0.015; motor/sensory-lesioned model: rspearman = 0.245, p = 0.005; salience network-lesioned model: rspearman = 0.246, p = 0.005; SCN-lesioned model: rspearman = 0.203, p = 0.010; cerebellum network-lesioned model: rspearman = 0.232, p = 0.007).
Upon comparing the lesioned models with the whole-brain model, we found no significant difference in performance between the whole brain CPM and FPN, DMN, salience, SCN, and cerebellum lesioned CPM. Interestingly, the prediction power of CPM increased after computationally lesioning the motor/sensory network (Table 3). However, lesioning the medial frontal networks significantly reduced the performance of the predictive model (comparison between MFN-lesioned model and whole-brain model: Steiger's Z = 2.759, p = 0.006). Other lesioned CPMs, which retains one network and its related connections while excluding others, demonstrated variable performance: while satisfactory in certain instances (FPN-retained, MFN-retained, SCN-retained), CPM was impeded in others (Table S2).
Model comparison between lesioned model and whole-brain model.
| virtually ‘lesioned’ network | CPM model performance (predicted vs. actual craving intensity) | Steiger's Z test (whole-brain model vs. lesioned model) | ||||
|---|---|---|---|---|---|---|
| r | ppermutation | RMSE | ppermutation | z | p | |
| Frontoparietal | 0.236 | 0.005 | 27.976 | 0.005 | -0.571 | 0.568 |
| Default mode | 0.235 | 0.009 | 28.072 | 0.005 | -1.928 | 0.054 |
| Medial frontal | 0.209 | 0.018 | 28.357 | 0.014 | 2.759 | 0.006 |
| Motor/sensory | 0.245 | 0.006 | 28.003 | 0.001 | -2.466 | 0.014 |
| Salience | 0.246 | 0.006 | 28.043 | 0.005 | -1.745 | 0.081 |
| Subcortical | 0.203 | 0.022 | 28.240 | 0.011 | 1.883 | 0.060 |
| cerebellum | 0.232 | 0.009 | 28.357 | 0.010 | -0.157 | 0.875 |
The significance tests of network-lesioned CPM were assessed through permutation test.
The generalizability of our findings was assessed in an independent sample (dataset 2) of individuals with MUD. We evaluated the performance of the CPM model and the identified network by predicting craving scores in the testing sample. The results revealed a significant positive correlation between the predicted craving scores and the true craving scores (threshold 0.02: rspearman = 0.320, p = 0.028). We further examined the performance of the model across different thresholds and observed that a threshold of 0.01 achieved slightly higher performance (r = 0.385, p = 0.007) compared to the more lenient threshold 0.05 (r = 0.316, p = 0.031).
In predicting factors related to drug use using either eyes-closed or eyes-open EEG data, the CPMs constructed from eyes-closed rsEEG source connectivity showed potential to predict days of abstinence (alpha: rspearman = 0.169, ppermutation = 0.049, significant threshold: 0.200; beta: rspearman = 0.287, ppermutation = 0.014, significant thresholds: 0.010/0.02; Gamma: rspearman = 0.164, ppermutation = 0.031, significant threshold: 0.200;) and years of drug use (beta: rspearman = 0.157, ppermutation = 0.040, significant threshold: 0.200). However, establishing a stable CPM for predicting daily methamphetamine dosage within our abstinent MUD cohort was not feasible. By contrast, the predictability of eyes-open EEG data for craving and various related variables did not attain the levels of the eyes-closed EEG CPMs. Specifically, for predicting craving using eyes-open data, only the beta band at a threshold of 0.2 achieved rspearman=0.174 with a ppermutation=0.025. This was particularly evident at less stringent thresholds, as detailed in Table 4.
The performance of CPMs predicting on drug use history and profiles of subjects based on either eyes-closed EEG or eyes-open EEG.
| Eyes-closed EEG | Significant Threshold(s) | Eyes-open EEG | Significant Threshold(s) | ||||
|---|---|---|---|---|---|---|---|
| Maximal rspearman | ppermutation | Maximal rspearman | ppermutation | ||||
| Theta | years of drug use | 0.180 | 0.085 | - | 0.121 | 0.278 | - |
| dosage | 0.062 | 0.277 | - | -0.172 | 0.445 | - | |
| abstinence | 0.167 | 0.059 | - | 0.247 | 0.008 | 0.05, 0.1, 0.2 | |
| craving | 0.202 | 0.035 | 0.2 | 0.005 | 0.310 | - | |
| PSQI | 0.214 | 0.015 | 0.2 | -0.069 | 0.908 | - | |
| BIS | -0.004 | 0.489 | - | 0.121 | 0.088 | - | |
| Alpha | years of drug use | 0.358 | 0.001 | 0.002 | 0.053 | 0.217 | - |
| dosage | 0.190 | 0.093 | - | -0.115 | 0.430 | - | |
| abstinence | 0.169 | 0.049 | 0.2 | 0.138 | 0.062 | - | |
| craving | 0.177 | 0.052 | - | 0.143 | 0.080 | - | |
| PSQI | 0.214 | 0.019 | 0.2 | -0.065 | 0.907 | - | |
| BIS | 0.257 | 0.030 | 0.002 | -0.132 | 0.668 | - | |
| Beta | years of drug use | 0.157 | 0.040 | 0.2 | -0.017 | 0.648 | - |
| dosage | -0.027 | 0.423 | - | -0.326 | 0.693 | - | |
| abstinence | 0.287 | 0.014 | 0.01, 0.02 | 0.101 | 0.058 | - | |
| craving | 0.234 | 0.020 | 0.01, 0.02, 0.1, 0.2 | 0.174 | 0.025 | 0.2 | |
| PSQI | 0.050 | 0.553 | - | -0.034 | 0.544 | - | |
| BIS | 0.147 | 0.042 | 0.2 | - | - | - | |
| Gamma | years of drug use | 0.031 | 0.332 | - | -0.062 | 0.625 | - |
| dosage | 0.048 | 0.262 | - | 0.068 | 0.056 | - | |
| abstinence | 0.164 | 0.031 | 0.2 | 0.117 | 0.038 | 0.1 | |
| craving | 0.069 | 0.268 | - | 0.072 | 0.213 | - | |
| PSQI | -0.071 | 0.636 | - | -0.245 | 0.847 | - | |
| BIS | -0.019 | 0.497 | - | -0.454 | 0.976 | - | |
Maximal rSpearman represents the highest effect size achieved by the CPM across all thresholds, as determined by Spearman correlation. The ppermutation indicates the statistical significance for the models achieving maximal effect size. Significant threshold(s) list all thresholds yielding statistically robust results during the CPM construction as permutation tests
Classifier models developed for distinguishing healthy controls from MUD individuals yielded only moderate success. Among them, beta and gamma model demonstrated superior performance at less stringent thresholds (for beta with a threshold of 0.100: accuracy = 70.97%, sensitivity = 0.75, specificity = 0.63; for gamma with a threshold of 0.200: accuracy = 71.89%, sensitivity = 0.80, specificity = 0.56; see Supplementary Table S3).
Mediation analysisMediation analysis revealed a significant indirect effect of duration of abstinence on craving intensity through the craving-related networks, with regression coefficients indicating a negative relationship between abstinence duration and the craving connectome (a = -0.240, p < 0.001), and a positive relationship between the craving connectome and craving intensity (b = 0.216, p < 0.01). The direct effect of abstinence duration on craving intensity, when controlling for the connectome, remained significant, suggesting partial mediation. Bootstrapping with 5000 iterations estimated the average causal mediation effect to be -0.052 [95% CI, -0.104 to -0.014], providing robust evidence for the craving-related cortical network's mediating role in this relationship (Fig. 5A). Additionally, the second mediation analysis examined the potential mediating role of neuropsychological profiles (including impulsivity, anxiety, and depression traits) in the relationship between the craving connectome and craving intensity. The results indicated that only the mediating effect of impulsivity was significant (a = 0.155, p < 0.05; b = 0.267, p < 0.001), with an indirect effect of 0.041 [95% CI, 0.005 to 0.099]. This suggests that approximately 14.98% of the total effect of the craving CPM pattern on craving is mediated through the impulsivity trait (Fig. 5B). The post-hoc analysis for the mediating role of impulsivity between abstinence duration and craving intensity revealed a significant indirect effect of -0.067 [95% CI, -0.130 to -0.019] (Fig. S1).
![Mediation analysis *P < 0.05, **P < 0.01, ***P < 0.001 Panel A displays the mediation model assessing the impact of abstinence duration on craving intensity, with the craving-related networks as a mediator. The negative beta weight (-0.240***) from abstinence duration to craving networks suggests that longer abstinence is linked to lower CPM-predicted craving score. The total effect of abstinence duration on craving intensity is significant (-0.284***), with the significant average causal mediation effect of -0.052 [95% CI, -0.104 to -0.014], confirming the mediating role of the craving networks in this relationship. Panel B examines the mediation model in which depression, impulsivity, and anxiety traits serve as potential mediators between CPM network-predicted craving scores and craving intensity. Significant positive associations are observed between CPM network-predicted craving scores and depression (β = 0.167*) and impulsivity (β = 0.155*) but not anxiety (β = 0.141). However, only impulsivity exhibits a significant mediating effect (0.041, 95% CI [0.005, 0.099]), suggesting that the relationship between CPM networks and craving intensity is partially explained by impulsivity.](https://static.elsevier.es/multimedia/16972600/0000002500000001/v21_202503140639/S1697260025000092/v21_202503140639/en/main.assets/gr5.jpeg?xkr=ue/ImdikoIMrsJoerZ+w997EogCnBdOOD93cPFbanNensa1rW+zY7MJT+xyAusAd1eWSWVsld5nw/a67MxcQhKTuA8XDB/JRduOTRpZx+Q/APrXz1hqRiE9v56Q95ZzUMZ+rcPiy/TdvJIw0JWT5BSI2j97b5Q6LoQ7oIQC+57Rkjof5dtY0mJ8ePq3JhMUrfiuCszRtZOth+63wJzpjjLaRHdIP0fWjvE+8NrLlv+EPK74trmM9114J8BBRd9K6a3qSPsv+/CbVQHAJO4GgwawKfjgCZOhXTFX3L/YUIXQyBMUzNkBGf4s2jF2WAyUN "Mediation analysis *P < 0.05, **P < 0.01, ***P < 0.001 Panel A displays the mediation model assessing the impact of abstinence duration on craving intensity, with the craving-related networks as a mediator. The negative beta weight (-0.240***) from abstinence duration to craving networks suggests that longer abstinence is linked to lower CPM-predicted craving score. The total effect of abstinence duration on craving intensity is significant (-0.284***), with the significant average causal mediation effect of -0.052 [95% CI, -0.104 to -0.014], confirming the mediating role of the craving networks in this relationship. Panel B examines the mediation model in which depression, impulsivity, and anxiety traits serve as potential mediators between CPM network-predicted craving scores and craving intensity. Significant positive associations are observed between CPM network-predicted craving scores and depression (β = 0.167*) and impulsivity (β = 0.155*) but not anxiety (β = 0.141). However, only impulsivity exhibits a significant mediating effect (0.041, 95% CI [0.005, 0.099]), suggesting that the relationship between CPM networks and craving intensity is partially explained by impulsivity.")
Mediation analysis
*P < 0.05, **P < 0.01, ***P < 0.001
Panel A displays the mediation model assessing the impact of abstinence duration on craving intensity, with the craving-related networks as a mediator. The negative beta weight (-0.240***) from abstinence duration to craving networks suggests that longer abstinence is linked to lower CPM-predicted craving score. The total effect of abstinence duration on craving intensity is significant (-0.284***), with the significant average causal mediation effect of -0.052 [95% CI, -0.104 to -0.014], confirming the mediating role of the craving networks in this relationship. Panel B examines the mediation model in which depression, impulsivity, and anxiety traits serve as potential mediators between CPM network-predicted craving scores and craving intensity. Significant positive associations are observed between CPM network-predicted craving scores and depression (β = 0.167*) and impulsivity (β = 0.155*) but not anxiety (β = 0.141). However, only impulsivity exhibits a significant mediating effect (0.041, 95% CI [0.005, 0.099]), suggesting that the relationship between CPM networks and craving intensity is partially explained by impulsivity.
Craving is a complex phenomenon in SUDs closely linked to relapse. Investigating its neural networks within abstinent populations, using brain functional connectivity, holds significant potential for advancing craving and addiction management. In this pursuit, our study employed CPM with rs HD-EEG source imaging to uncover the neural substrates associated with craving (PPC) for methamphetamine cues in abstinent individuals with MUD. Our results are consistent with the broader narrative on craving dynamics (Koob, 2010), revealing that craving is linked to a wide range of brain activity. Notably, regions such as the bilateral hippocampus, left dorsolateral superior frontal gyrus, ventrolateral thalamus, lenticular nucleus (encompassing the putamen and pallidum), and the left anterior cingulate cortex (pregenual area) exhibit the highest degree of connectivity within the identified networks (Table S4). These regions have also been found specifically correlated with methamphetamine cue reactivity in earlier research (Grodin, Courtney, & Ray, 2019).
The craving connectome for methamphetamine in abstinent individuals exhibits a distinct pattern characterized by increased integration between the SCN, Visual Association, and Sensory/Motor Networks, while a notable decrease in connectivity (segregation) between the MFN, FPN, Salience Network, and Cerebellar Networks (Fig. 4). These findings provide robust evidence supporting previous discussions on the widely distributed network implicated in MUD (Zhao et al., 2021; Tian et al., 2024). For clarity, we've visualized potential predictive networks corresponding to the pathways identified of craving models for SUD (Fig. 6). Unlike a CPM-fMRI study that included non-substance-related addictions (Garrison et al., 2023), our study specifically investigated the craving network in MUD and found the distinctive absence of the DMN. Our result aligns more closely with studies that examine substance-related addictions, highlighting the medial prefrontal cortex—a central element of the executive control network—as a fundamental node in craving mechanisms (Hanlon et al., 2018). These findings underscore the distinct neural mechanisms underlying craving in SUDs. Additionally, employing direct neurophysiological methods, such as EEG, provides vital insights into the specificity of these disorders, deepening our understanding of the neural substrates involved in craving.
. Circles are color-coded to represent distinct functional network roles: gray corresponds to cognitive control networks, black to attention and cue-encoding networks, and blue to reward-response networks. Connectivity between networks is depicted with color-coded lines, where red signifies positive (integration) and green indicates negative (segregation) connectivity patterns. Stars denote critical hub networks that substantially enhance the model")
Theoretical network model of craving in MUD
The figure presents a schematic illustration of a theoretical network model depicting the neural mechanisms underlying methamphetamine craving in abstinent individuals with Methamphetamine Use Disorder (MUD). Circles are color-coded to represent distinct functional network roles: gray corresponds to cognitive control networks, black to attention and cue-encoding networks, and blue to reward-response networks. Connectivity between networks is depicted with color-coded lines, where red signifies positive (integration) and green indicates negative (segregation) connectivity patterns. Stars denote critical hub networks that substantially enhance the model's predictive accuracy, underscoring their pivotal role in elucidating craving dynamics. By synthesizing findings from the current study and existing literature, this visualization offers a comprehensive and integrative perspective on the intricate network interactions driving methamphetamine craving in MUD.
More important, we delve deeper into the interconnections among critical networks, offering new perspectives on the specific craving dynamics within MUD. The integration of these networks is vital in the aberrant activation of the reward system during drug cue exposure, including assigning incentive salience to craving cues and drug-related attention bias processes, which serves as a key neurobiological pathway linking craving to drug use (Goldstein and Volkow, 2011). Specifically, the coupling of the middle frontal gyrus, motor/sensory areas, and thalamus, which are part of the Salience network, may be associated with attentional functions and drive automatic and unconscious reactions to stimuli (Siman-Tov et al., 2019). Previous research has shown increased craving accompanies lower sexual craving in MUD, indicating potential overlapping brain mechanisms between sexual and drug cravings, further supporting the involvement of drug related craving network in fundamental reward pathways (Huang et al., 2017, Shen et al., 2021). The network patterns observed in this study align with previous neuromodulation research, particularly regarding the outcomes of repetitive transcranial magnetic stimulation (rTMS) interventions targeting the dorsolateral prefrontal cortex (DLPFC) and insula, which highlights the role of alterations in frontoparietal circuits and middle frontal regions (associated with the executive control and salience networks) in mitigating craving (Shahbabaie et al., 2018, Su et al., 2020). Additionally, our previous clinical trials and laboratory results have highlighted the clinical relevance of the DLPFC (Zhao et al., 2020), motor cortical plasticity (Huang et al., 2017), and MPFC (Zhao et al., 2023) in the treatment of MUD.
Segregation networks, characterized by reduced connectivity among the fronto-parietal, medial frontal, salience, and cerebellar networks, may play a crucial role in understanding and modulating the dopamine system in the treatment of craving and addiction (Ashok et al., 2017; Mahoney et al., 2020). These networks are implicated in conflict monitoring, cognitive control, and attention processing (Fascher et al., 2024). Our findings highlight anti-connectivity among the fronto-parietal, medial frontal, and salience networks, suggesting a potential framework for profiling macro-level brain communication. However, the heterogeneity in network definitions and evaluation methods (e.g., task-based vs. resting-state data, MRI vs. electrophysiology) (Zilverstand et al., 2018) underscores the need for further studies to clarify inter-network relationships. Overall, the intricate balance of integration and segregation among these networks may help explain the difficulties in identifying effective treatment targets for individual patients.
HD-EEG functional source connectomes based on CPM offer a sophisticated approach for studying craving in SUDs, offering insights beyond traditional scalp-level EEG analyses (Kołodziej et al., 2021). Our findings highlight the predictability of craving using the HD-EEG connectome, with no significant impact on the predictive model from a single network lesion, emphasizing the importance of overall brain integrity in predictive models. The classification performance of CPMs underscored the moderate efficacy in classifying individuals with MUD versus healthy controls, with the Beta and Gamma bands showing the most promise at specific thresholds (Table S3). Furthermore, our validation analysis and exploratory investigations suggest that CPM can also predict other characteristics related to drug use, such as the duration of methamphetamine use and the days since last use, thereby confirming the utility of source rsEEG in understanding MUD. Nevertheless, achieving robust CPM predictions for these variables required more liberal thresholds, resulting in varied outcomes across different frequency bands (Table 4). These findings reiterate the unique contribution of beta activity to the intensity of craving and highlight the need for stricter guidelines and thorough discussion regarding the application and interpretation of CPM in the context of neuropsychiatric research.
The significance of beta activity in predicting craving intensity among individuals with MUD in abstinence is in concordance with our previous EEG study that explored the neural correlates of MUD (Zhao et al., 2021). This finding is supported by the pivotal role of the beta frequency band identified in alcohol use disorder and internet gaming disorder (Son et al., 2015; Bauer and Bauer, 2001), as well as research utilizing resting-state rsEEG electrode connectivity (WPLI) to differentiate individuals with SUD from healthy controls (Khajehpour et al., 2019). These EEG and MUD studies complement a prior systematic review that highlights the distinct role of the beta band across various SUDs (Liu et al., 2022). Beta activity is primarily associated with gamma-aminobutyric acid (GABA) functionality, which is crucial for reward mechanisms and attentional processes (Gola et al., 2013; Yaple et al., 2018). Further investigation, including intracranial EEG (iEEG) and neurotransmitter analysis to examine the detailed mechanisms and specificity of beta activity compared to other frequency bands, may furnish a more refined understanding.
Recent studies applying machine learning to eyes-open EEG data have reported improved accuracy in craving prediction compared to eyes-closed EEG models (Tian et al., 2024). Nonetheless, our study employing eyes-open EEG for CPM construction did not consistently replicate these improvements. Interestingly, at a threshold of 0.2, both eyes-closed and eyes-open EEG data demonstrated some potential in constructing CPMs to predict specific drug use histories and subject profiles. However, the effectiveness of the threshold in CPM construction should not be overly sensitive if the underlying relationship is robust. While eyes-closed EEG is recognized for its reproducibility (Metzen et al., 2022), a comparative study involving diverse recording protocols, source localization methods, and machine learning approaches is likely to address the complex interplay model selection parameters and the nature of the input data.
The debate over whether protracted abstinence or maintenance should be the primary treatment goal for SUDs remains unresolved, due in part to limited understanding of underlying mechanisms and a lack of clear strategies. Our findings contribute to this discussion by demonstrating that, in individuals with MUD, prolonged abstinence is accompanied by restored brain connectivity and reduced craving, partially explained by lower trait impulsivity and its associated networks. The observed integration within fronto-parietal network further highlights abnormalities in inhibitory control (Fascher et al., 2024). By linking two core features of SUDs—impulsivity and craving—we elucidate their interplay with abstinence and brain networks, proposing a novel mechanism for how brain function influences craving. This aligns with earlier evidence indicating that neural recovery during methamphetamine abstinence is not straightforward, with a non-linear relationship between abstinence duration and brain changes (Parvaz et al., 2022). Furthermore, our results are consistent with previous findings highlighting the critical role of impulsivity in mediating the relationship between brain network and craving in abstinent MUD patients (Luo et al., 2024). While prior studies have documented improvements in more specific measures of impulsivity, such as timing perception, during prolonged abstinence, additional research is required to clarify the roles of various impulsivity dimensions, including temporal discounting and stop-signal tasks (Everitt and Robbins, 2016; Zhang et al., 2019), as well as to compare outcome between long-term and short-term abstinence groups (Jones et al., 2016). In sum, our findings underscore the mediating influence of impulsivity between abstinence and craving, providing evidence that complete abstinence can benefit individuals with MUD. Notably, such relationship between impulsivity and craving may be methamphetamine-specific, as suggested by comparisons with cocaine (Tziortzis et al., 2011).
The moderate effect of the CPM classifier models, which emphasize distinctions between SUDs groups and matched non-user groups, highlights the critical importance of capturing intra-group heterogeneity. Acknowledging individual neural diversity is essential for advancing contemporary neuropsychiatric exploration (Hariri, 2009). Our analysis using CPM indicates that the variability in medial frontal among abstinent individuals with MUD may be the key to understand pathological craving in SUDs. By combining machine learning data-driven predictive models with empirical research, we have developed a theoretical network model for craving. This model offers promising guidance for future studies and treatment strategies for MUD, highlighting the importance of understanding the neural underpinnings of craving to create targeted and personalized interventions. Additionally, our findings suggest that this network pattern mediates the relationship between abstinence and craving, potentially bridging the gap between abstinence and the incubation of craving. The examination of network features identified through CPM provides updated insights into underlying neurophysiological mechanisms (Rahwan et al., 2019).
LimitationsOur research contributes important insights into the neural mechanisms of craving yet several limitations warrant acknowledgment. Firstly, our reliance on rsEEG data may have constrained our observation of the temporal dynamics of brain network fluctuations associated with craving response (Greene et al., 2018). An in-depth examination of the beta component's temporal patterns in relation to abstinence duration might shed additional light on this aspect. Although previous fMRI studies have indicated that resting-state connectivity features may be similar to those identified in task-based imaging within a same behavioral or cognitive domain (Chen et al., 2022), incorporating task-based EEG data could leverage EEG's exceptional temporal resolution. Such integration might illuminate how electrophysiological flexibility correlates with craving phenomena. Additionally, the use of a standardized head model for source localization in our study might have led to spatial inaccuracies, potentially affecting the precision of our findings. Future endeavors should consider the use of personalized MRI data for source localization to enhance accuracy and, consequently, the trustworthiness of the results.
It should be emphasized that our study's cohort only comprised of male individuals with MUD who were currently abstinent. It's important to recognize that the neural correlates of craving could vary not only across individuals with different demographic profiles but also between different substances or acute and chronic users (Lichenstein et al., 2021). Besides, gender differences have been reported in the predictive capabilities of the CPM across various cognitive domains (Nicolas et al., 2022). Finally, the use of PPC in our study to capture craving introduces methodological differences that may limit direct comparability with other evaluation tools. Consequently, these considerations highlight the need for caution in generalizing our results to a wider or diverse population.
ConclusionThis study presents a novel predictive model that utilizes sourced connectivity from HD-EEG of resting-state recording to successfully predict methamphetamine craving in abstinent individuals with MUD. By incorporating brain connectivity measures, our findings underscore the holistic nature of craving and the association among its key neural networks. These networks results shed light on the cognitive organization involved in craving, involving cognitive control, attention, and reward reactivity. The comprehensive analysis here not only illuminates the capabilities of EEG data in dissecting the complex craving dynamics but also paves the way for enhanced comprehension and targeted treatment approaches in SUDs.
Ethics approval and consent to participateThe study received approval from the Institutional Review Board for Human Research at Shanghai Mental Health Center. All participants gave written informed consent following the principles of the Declaration of Helsinki.
Consent for publicationWritten informed consent for publication was obtained from all participants.
Availability of data and materialsThe datasets used and/or analyzed during the current study are available upon reasonable request from corresponding author. The custom MATLAB scripts used for CPM analysis are publicly accessible at https://github.com/bingo1218/CPM_EEG_craving
FundingsThis study was supported by National Science and Technology Innovation 2030 Major Project of China (2021ZD0203900), NSFC grants (82422029, 81822017, 82271530, 32241015, 31900765), the Science and Technology Commission of Shanghai Municipality (24Y22800200, 23ZR1480800, 22QA1407900, 21YF1439700), Shanghai Municipal Commission of Health (2022JC016), Shanghai Municipal Education Commission - Gaofeng Clinical Medicine Grant Support (20181715), Innovation teams of high-level universities in Shanghai, Shanghai Jiao Tong University Medical-Engineering Interdisciplinary Research Fund (YG2025ZD07) Scientific Research and Innovation Team of Liaoning Normal University (24TD004). The funders had no role in the performance of the study or the decision to pursue publication.
CRediT authorship contribution statementHang-Bin Zhang: Data curation, Formal analysis, Writing – original draft. Quanhao Yu: Data curation. Xinyuan Zhang: Data curation. Yi Zhang: Data curation. Taicheng Huang: Data curation. Jinjun Ding: Data curation. Lan Yan: Data curation. Xinyu Cao: Data curation. Lu Yin: Data curation. Yi Liu: Data curation. Ti-Fei Yuan: Conceptualization, Methodology, Writing – review & editing. Wenbo Luo: Conceptualization, Methodology, Writing – review & editing. Di Zhao: Conceptualization, Methodology, Data curation, Formal analysis, Writing – review & editing.
We thank Ningning Zeng, Qian Zhuang, and Hui Zheng for their efforts in data collection. We also extend our gratitude to the study volunteers, investigators, and clinicians for their dedication and contributions.
