


Chronic stress has a negative impact on cognitive function and physical health, particularly impairing cognitive control function. This study aimed to investigate the effects of chronic stress on error processing, specifically error monitoring and post-error adjustment. We assessed 61 healthy college students (32 females, 29 males, age: 18.80 ± 0.68 years) using the Student-Life Stress Inventory (SLSI) and a four-choice Flanker task with response-stimulus intervals (RSIs) of 200 ms, 700 ms, and 1500 ms to investigate the temporal dynamics of error monitoring and characteristics of different phases of post-error processing under chronic stress. Results revealed that higher chronic stress levels were associated with smaller post-error slowing (PES) and larger post-error accuracy decrease (PEAD). Dividing participants into high-chronic stress (n = 30) and low-chronic stress (n = 31) groups, we found that the ΔPe amplitude at 200 ms RSI in the low-stress group was significantly larger than that in the high-stress group, indicating that chronic stress impairs the recognition of error responses. At 200 ms RSI, the PEAD in the high-stress group was significantly larger than in the low-stress group. This suggests that high levels of chronic stress impair early-stage post-error adjustment processing. The study highlights that chronic stress impairs error monitoring and early post-error processing, revealing features of continuous processing stages in behavioral monitoring under chronic stress.
Stressors are common risk factors in life. Individuals experience a series of physical and psychological responses under stress, including changes in physical functions, emotional processing, and cognitive functions. Chronic stress is characterized as a persistent state of stress triggered by ongoing adversity that an individual experiences. This adversity may pose a long-term threat to one's life or lack substantial threat, yet it can significantly affect the individual (Shields et al., 2016). Chronic stress can lead to a prolonged activation of the hypothalamic-pituitary-adrenal (HPA) axis, which increases the secretion of cortisol (Gadek-Michalska et al., 2013; Guilliams & Edwards, 2010). Cortisol is a primary stress hormone, and consistently high levels of it can reduce the density of dendrites and synapses in various brain regions, negatively affecting neuroplasticity. This reduction primarily occurs due to increased glutamate release, which results from interactions with mineralocorticoid receptors (MR) and glucocorticoid receptors (GR). As a result, the brain experiences synaptic hyperexcitability, ultimately impairing synaptic plasticity, particularly in areas like the prefrontal cortex (PFC), hippocampus, and amygdala (McEwen, 2017; Treccani et al., 2014). Additionally, long-term stress can decrease levels of neurotransmitters such as dopamine, serotonin, and gamma-aminobutyric acid (GABA), especially in the PFC (Mizoguchi et al., 2000; Shansky & Lipps, 2013). These changes would impair the top-down cognitive control functions in individuals. Numerous studies have found that chronic stress leads to impairments in PFC-mediated functions, including attention control, memory, and learning (Morgan et al., 2006; Negrón-Oyarzo et al., 2016; Woo et al., 2021). Additionally, research suggests chronic stress can impair core cognitive control functions, such as working memory and cognitive inhibition (LaGarde et al., 2010; McKlveen et al., 2016; Mizoguchi et al., 2000).
Error processing is also an important aspect of cognitive control. Error processing encompasses the cognitive processes by which individuals recognize error responses and subsequent behavioral adjustments (Gehring et al., 1993). Following errors, individuals commonly demonstrate post-error slowing (PES), characterized by slower response times in subsequent trials (Laming, 1979). Some studies have found post-error improvements in accuracy (PIA) (Danielmeier et al., 2011; Desmet et al., 2012) and post-error reduction of interference (PERI) (King et al., 2010; Ridderinkhof, 2002) following errors. These phenomena indicate the adaptive features of post-error adjustments. Error processing depends on erroneous responses monitoring by the medial prefrontal cortex (mPFC), while the lateral prefrontal cortex (lPFC) mediates behavioral adjustments following errors (MacDonald et al., 2000; Ridderinkhof et al., 2004; Ullsperger et al., 2014). Conflict-monitoring theory proposes that individuals modify their speed-accuracy trade-off following errors, resulting in prolonged response times to improve accuracy and minimize future mistakes (Botvinick et al., 2001; van Veen et al., 2008). EEG studies have identified two typical event-related potentials (ERPs) components related to error monitoring: error-related negativity (ERN) and error positivity (Pe). The ERN typically manifests as a negative wave in the fronto-central region, peaking within 0–100 ms after an erroneous response and indicating early/automatic error detection. Source localization studies indicated that the ERN originates from the anterior cingulate cortex (ACC), a part of the mPFC (Gehring et al., 2012; Yeung et al., 2004). The Pe follows the ERN, appearing as a positive deflection in the centro‐parietal region within 200–400 ms following error responses. The neural correlates of the Pe are considered more extensive, encompassing the posterior cingulate cortex (PCC), supplementary motor area (SMA), insula, and other regions (Falkenstein et al., 2000; Shalgi et al., 2009; van Veen & Carter, 2006).
Research findings on the effects of chronic stress on error monitoring and post-error adjustments have been inconsistent. Some studies have suggested that stress heightens sensitivity to error responses, as evidenced by increased ERN and Pe amplitudes (Banica et al., 2022; Wu et al., 2019, 2014). While some studies have associated cortisol awakening responses, a marker of chronic stress, with delayed ERN latency and reduced post-error responses, indicating that chronic stress impairs error processing (Zhang et al., 2015). Research evidence from studies on Post-Traumatic Stress Disorder (PTSD) found that the amplitude of time-frequency ERN and Pe in PTSD patients was significantly lower compared to that in healthy controls (Clemans et al., 2012). However, other research has found no significant effects (Swick et al., 2015). The chronic stressors examined in these studies encompass a range of types, including exams and traumatic experiences. Discrepancies in the findings might be attributed to variations in stress duration, participant symptoms, and the specific stage of error processing being investigated. Actually, previous research has established a strong link between stress, cortisol levels, and performance monitoring functions (Compton et al., 2013, 2008; Tops et al., 2006). Areas of the brain involved in error monitoring, such as the medial prefrontal cortex (mPFC) and anterior cingulate cortex (ACC), are particularly sensitive to stressors. Research evidence suggests chronic stress leads to dendrite retraction and functional changes in mPFC neurons, as well as a reduction in functional connectivity with other brain regions (including ACC) (McKlveen et al., 2016; Negrón-Oyarzo et al., 2016; Popoli et al., 2012). In other words, severe chronic stress might impair error monitoring and further adjustment. Previous research has yet to reach a consensus on the effects of chronic stress on error processing. Selecting adults with similar living environments as research participants, such as college students, to conduct a comprehensive assessment of short-term chronic stress levels in their academic lives (within three months), including stressors and stress responses, would help reduce the influence of confounding variables on the exploring of the relationship between chronic stress and performance monitoring functions in young adults.
Moreover, error processing is a continuous, multi-stage process. Recent studies suggest that post-error adjustment involves distinct stages (Li et al., 2024; Ullsperger & Danielmeier, 2016; Wessel, 2018), with error monitoring potentially impeding post-error control in the short term, while individuals may optimize their responses in later stages (Steinhauser et al., 2017). Previous research has focused on the effect of chronic stress on error monitoring, particularly the ERN component. Still, it is crucial to investigate the dynamic features of different stages of error processing. Researchers have explored the dynamics of different stages of post-error processing using tasks with varying response-stimulus intervals (RSIs) after errors (Buzzell et al., 2017; Li et al., 2021). Based on these studies, this study employed tasks with RSIs of 200 ms, 700 ms, and 1500 ms, combined with EEG measurements, to reveal the impact of chronic stress on error monitoring and post-error processing. By measuring chronic stress scores in participants and recording EEG components of error monitoring (ERN and Pe) under different RSIs, as well as post-error slowing, post-error improvements in accuracy, and post-error reduction of interference, our research aimed to evaluate the comprehensive impact of chronic stress on error processing. We hypothesized a negative correlation between chronic stress and overall error processing, with continuous variation across different error processing indicators.
Materials and methodsParticipantsThis study recruited 67 participants (31 males) from Kunming University through online advertisements and phone interviews. Six participants were excluded from further data analysis due to insufficient error responses (less than six error trials in an RSI condition, 3 participants), poor performance (total accuracy < 60 %, 1 participant), and excessive artifacts in EEG records (2 participants). Data from 61 healthy participants (29 males, Mean ± SD age: 18.80 ± 0.68 years) were utilized for subsequent statistical analysis. All participants were right-handed, had normal (corrected) vision, and had no background of severe neurological or psychological issues. This study used the Beck Depression Inventory (BDI) (13 items, Beck, 1961) and the State-Trait Anxiety Inventory (STAI) (Spielberger, 1983) to assess depressive and anxiety states in individuals. Only individuals with a BDI score below 8 and those who did not have both State and Trait Anxiety subscale scores exceeding 60 were eligible to participate in this study. None of the participants had prior experience with the four-choice Flanker task before the experiment. Participants were informed about the experiment and provided informed consent before participation. At the end of the experiment, participants received monetary and material compensation. The Medical College of Kunming University Medical Ethics Committee approved the human research study.
Experimental procedureThe experiment lasted approximately 2 h and was carried out in a soundproof EEG laboratory. Upon arriving at the laboratory, participants were briefed on the research procedures by the experimenter and signed informed consent forms. Afterward, participants completed assessment questionnaires, and EEG equipment was then applied. Each participant was seated about 70 cm away from the monitor. The experimental stimuli were displayed on a 23.8-inch monitor with a resolution of 1920 × 1080. The presentation of the stimuli and the collection of data were performed using E-Prime software (E-Prime 2.0, Psychological Software Tools, Pittsburgh, PA).
Four-choice flanker taskThe flanker task employed in this study aligns with that of Hu et al. (2024) (see Fig. 1). Each stimulus display featured a central target letter surrounded by six identical flanker stimuli. The target letters included B, K, P, R, M, V, W, and X, while flanker stimuli comprised neutral symbols (§, $, %, &, #, or ?) or letters (B, K, P, R, M, V, W, or X). The visual angle of the stimulus array was 4.1°. Arrays presented both incongruent (e.g., PPPXPPP) and neutral (e.g., % % %X % % %) conditions. The eight central letters were paired to four keyboard responses, and flanker stimuli letters mapped to different keyboard responses. This design resulted in 48 incongruent and 48 neutral stimuli by combining central and flanker elements. Unlike the traditional flanker task, this four-choice variant integrated neutral and incongruent stimuli. Accuracy and reaction times for neutral trials resembled those of congruent trials (Spieler et al., 2000), making neutral trials an optimal control condition for exploring selective attention following errors.

Participants in the study were asked to focus on the central letter while ignoring distractions around it. They were instructed to press specific keys on a keyboard using their index and middle fingers. The "1″ key corresponded to the letters B and K, the "2″ key to P and R, the "9″ key to M and V, and the "0″ key to W and X. Each stimulus array appeared for 150 milliseconds on the screen, followed by a blank screen lasting 1500 milliseconds. Participants had to press the corresponding key during this period, indicating the letter they had focused on. The Response Stimulus Interval (RSI) durations varied across 18 blocks, with 200, 700, and 1500 milliseconds durations. Each block contained 96 trials, and the RSI duration was manipulated with six blocks per duration. The trial types were presented pseudo-randomly within each block. The formal experiment included a total of 1728 trials. Prior to the formal experiment, participants completed two blocks of 20 trials for familiarization. The entire experiment lasted approximately 2 et al., h.
QuestionnaireThis study utilized the Student-Life Stress Inventory (SLSI) developed by B.M. Gadzella (Gadzella,1991;1994). It is based on stressful events encountered by college students on campus and their resulting physiological and psychological responses. The inventory was utilized to evaluate stressors such as conflicts, frustrations, changes, and pressures experienced by college students during their academic tenure, along with their physiological, emotional, cognitive, and behavioral responses to these stressors. The questionnaire consists of 51 items, where respondents select their choices based on their experiences in the past three months. The scale is divided into two main dimensions: stressors and stress responses. These two dimensions are composed of nine factors: Frustration, Conflict, Pressure, Change, Self-imposed, emotional responses, physiological responses, behavioral responses, and cognitive responses. Each item is rated on a 5-point scale from 1 (not at all) to 5 (always). This study assessed the average stress levels of individuals over the past three months based on reported scores from participants.
EEG and preprocessingWe used a 32-channel Brain Products system to record EEGs with a standard EEG cap based on the extended 10–20 system. The signals were recorded at a sampling rate of 500 Hz. Fz served as the online reference electrode for all sites, and for offline processing, the average bilateral mastoids (TP9 and TP10) were used as the reference electrode. The impedance of all channels remained below 5 kΩ. The EEG data were analyzed offline using Brain Vision Analyzer 2.1 software (Brain Products, Gilching, Germany) and MatLab (MathWorks, Natick, USA). The raw data were digitally filtered using a high-pass filter of 0.5 Hz and a low-pass filter of 30 Hz at 24 dB/octave. The effects of eye movements and blinks were corrected using independent component analysis, and any trial with amplitudes exceeding ± 80 µV was removed. After this artifact rejection, 98.16 % ± 7.41 % of the trials remained without significant differences among any conditions (ps > 0.43).
Segments locked to the onset of error and correct responses (from −200 to +600 ms) were extracted. Baseline corrections were then applied using an interval from −200 to −100 ms. The time windows and regions of interest for the error-related negativity (ERN) and error positivity (Pe) were determined by calculating the difference between the waveforms of error and correct trials. The time windows and electrode locations for error-related components were identified by analyzing the averaged waveforms and topography across all participants and conditions. The mean amplitudes of the ERN and Pe components were measured to indicate the activity of error monitoring. The time window for the ERN component was set from −10 to 40 ms relative to the onset of the error response. The region of interest for this component was the fronto-central region and was calculated as the average of FC1, FC2, Fz, and Cz electrode channels. The amplitude of Pe was measured within the time window from 80 to 180 ms relative to the onset of the error response at the same fronto-central region. Similar time windows and regions of interest were used for correct responses to identify the correct-related negativity (CRN) and correct positivity (Pc) during the correct trials. The ΔERN and ΔPe were computed by subtracting the amplitude of the correct trials from the amplitude of the error trials. This allowed for isolating the ERP components related to error monitoring and explaining specific cognitive functions (McMahon & Henderson, 2015).
Data preprocessing and analysisBehavioral resultsFor the four-choice Flanker task, the reaction time (RT) and accuracy of the incongruent and neutral trials during different RSI conditions were analyzed via a repeated-measures ANOVA with the factors Congruency (incongruent vs. neutral) × RSI (200 vs. 700 vs. 1500).
The trial numbers and RTs of error responses, a repeated-measures ANOVA comprising the factor Trial Type (error vs. correct) × RSI (200 vs. 700 vs. 1500) was performed. For post-error responses, the RT and accuracy of post-error responses at different RSIs were analyzed to investigate the feature of post-error processing stages. In addition, the post-error slowing was calculated by subtracting the reaction time of correct post-correct responses from that of post-error responses: RTpost-error adjustment = RTpost-error trial – RTpre-error trial. The post-error adjustment in accuracy was evaluated by subtracting the accuracy of post-correct responses from that of post-error responses: ACCpost-error adjustment = ACCpost-error trial – ACCpost-correct trial. The post-error reduction of interference was calculated by subtracting the post-correct interference effect from the post-error interference effect. The post-error adjustments under different RSIs (200 vs. 700 vs. 1500) were separately analyzed using repeated-measures ANOVAs for each RSI condition.
ERP dataThe comparison of ERN and CRN amplitudes was analyzed using a Trial Type (error vs. correct) × RSI (200 vs. 700 vs. 1500) ANOVA. Similarly, the effect on Pe and Pc was examined. A repeated-measures ANOVA with RSI (200 vs. 700 vs. 1500) as the factor was conducted to explore its effect on ∆ERN and ∆Pe.
Relationship between chronic stress and error processingThis study employed partial correlation analysis, with BDI scores and trait-anxiety scores as control variables, to explore the relationship between chronic stress and error monitoring-related EEG components as well as post-error behavioral responses. Subsequently, participants were categorized into low-chronic stress and high-chronic stress groups based on their levels of chronic stress. A Group (low-chronic stress group vs. high-chronic stress group) × RSI (200 vs. 700 vs. 1500) repeated measures ANOVA was conducted to investigate the impact of chronic stress on error monitoring and post-error processing.
Relationship between error monitoring and post-error processingTo explore how error-related EEG components affect post-error adjustment processing at different RSIs, we used R statistical software (version 4.3.2, R Core Team, 2024) alongside the lme4 package (version 1.1.35.1) and lmerTest package (version 3.1–3) to conduct a series of generalized linear mixed-effects analyses. Initially, we transformed the error-monitoring EEG components and post-error adjustment indicators into natural logarithms to better approximate a normal distribution. In each model, continuous variables were standardized by centering them to a mean of 0 and a standard deviation of 1 across the entire dataset, while categorical variables were included using sum contrast. The models predicting continuous outcome measures (PES/PIA(PEAD)/PERI) were fitted using the lmer function from the lme4 package with restricted maximum likelihood estimation. Each model incorporated the effects of interest and their interactions (including an intercept) as fixed effects, along with subject-specific intercept variation as random effects. We used the lmerTest package (Kuznetsova et al., 2017) to calculate the statistical significance of each fixed effect using the Satterthwaite approximation method to determine the denominator degrees of freedom. The general form of the mixed effect model is:
Here Y is the response variable, X is the design matrix for fixed effects, β is the vector of fixed effects coefficients, Z is the design matrix for random effects, γ is the vector of random effects, ε is the error term.
The mixed - effects model was built using the syntax of the R package lme4 as follows:

This formula specifies a linear mixed - effects model where dependent_var is the response variable. The model includes fixed effects for the intercept (1), the main effects of fixed_effect_1 and fixed_effect_2, as well as their interaction (fixed_effect_1 * fixed_effect_2). Additionally, it incorporates a random effect for the intercept (1|Participant), allowing for variation in the baseline response across different participants.
The statistical significance level (α) was set to 0.05 (two-tailed). The Bonferroni correction was applied to adjust the alpha levels. Greenhouse-Geisser corrections were used as required. After identifying a significant interaction, the least significant difference test was performed. The effect size of significant results was denoted by partial η squared (ηp2). For the variables ΔERN, ΔPe, PES, and PIA (PEAD), with a significance level of 0.05, a sample size of 61 participants, and a population correlation of 0.60 in the repeated measures analysis, the two‐way interaction effect of Group (low-chronic stress group vs. high-chronic stress group) × RSI (200 vs. 700 vs. 1500) showed a medium effect (ηp2 = 0.25) at a probability (1 − β) = 0.99.
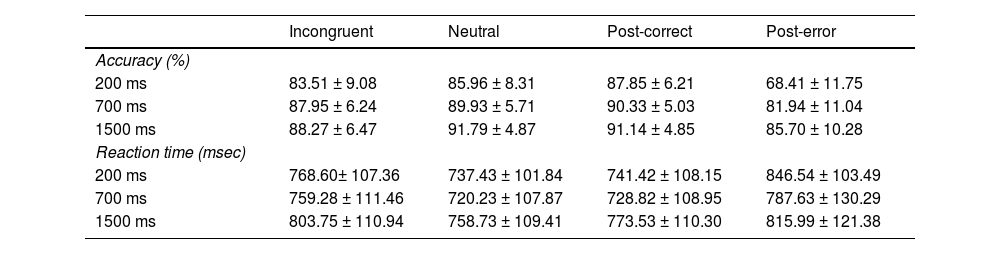
ResultsBehavioral resultsFlanker taskThe reaction time and accuracy of the Flanker task are presented in Table 1. The repeated-measures ANOVA on accuracy for incongruent and neutral trials under different RSI conditions revealed a significant main effect of Congruency, F (1, 60) = 114.50, p < 0.001, ηp2 = 0.66. The main effect of RSI was also significant, F (2, 120) = 32.06, p < 0.001, ηp2 = 0.35. The Congruency × RSI interaction was significant, F (2, 120) = 6.18, p < 0.01, ηp2 = 0.09. Accuracy significantly increased for both incongruent and neutral trials as the time interval lengthened, although no significant difference in accuracy was found between incongruent trials at 700 ms and 1500 ms RSI intervals (p = 0.61). For RT, the results showed a significant main effect of Congruency, F (1, 60) = 143.74 p < 0.001, ηp2 = 0.71, and RSI, F (2, 120) = 20.29, p < 0.001, ηp2 = 0.25. The interaction was also significant, F (2, 120) = 6.51, p < 0.01, ηp2 = 0.10. Further analysis presented that the reaction times for incongruent and neutral trials significantly increased with the time interval. However, the difference in reaction times between 200 ms RSI and 700 ms RSI conditions for incongruent trials was not significant (p = 0.98).
To detect potential practice effects, a repeated-measures ANOVA was conducted on the reaction times and accuracy of incongruent and neutral trials in the first three blocks and the last three blocks under each RSI condition. The analysis of accuracy showed a significant main effect of Congruency, F (1, 60) = 110.41, p < 0.001, ηp2 = 0.65, and RSI, F (2, 120) = 28.00, p < 0.001, ηp2 = 0.32. Both the interaction of Congruency × RSI, F (2, 120) = 3.15, p < 0.05, ηp2 = 0.05, and the interaction of Congruency × Session, F (1, 60) = 8.63, p < 0.01, ηp2 = 0.13, were significant. Further analysis indicated that the improvement in response accuracy was observed only in the response accuracy of incongruent trials at 200 ms RSI intervals (first session: 81.85 ± 1.20 %; last session: 85.20 ± 1.24 %), F (1, 60) = 10.76, p < 0.01, ηp2 = 0.15. The analysis of reaction times revealed significant main effects of Congruency, F (1, 60) = 137.66, p < 0.001, ηp2 = 0.70, RSI, F (2, 120) = 9.82, p < 0.001, ηp2 = 0.14, and Session, F (1, 60) = 55.11, p < 0.001, ηp2 = 0.48. The interaction of RSI × Session was significant, F (2, 120) = 13.45, p < 0.001, ηp2 = 0.18. The interaction of Congruency × RSI also significant, F (2, 120) = 5.83, p < 0.01, ηp2 = 0.09. The simple effects analysis indicated that response times were faster in both incongruent and neutral trials across all RSI conditions, with the main effect of RSI becoming more pronounced in the later stages of the experiment. These results indicate the presence of a practice effect in the current study.
Error and post-error adjustmentThe average number of error responses was 89.77 ± 50.08 (range: 30 to 268) at 200 ms RSI, 65.07 ± 34.02 (range: 6 to 186) at 700 ms RSI, and 58.61 ± 31.84 (range: 13 to 135) at 1500 ms RSI. An ANOVA examining Trial Type (error vs. correct) × RSI (200 vs. 700 vs. 1500) for RTs of correct and error responses revealed a significant main effect of Trial Type, F (1, 60) = 144.30, p < 0.001, ηp2 = 0.71, indicating faster RTs for error responses (431.80 ± 18.85 ms) compared to correct responses (757.64 ± 13.15 ms). The Trial Type × RSI interaction was also significant, F (2, 120) = 14.10, p < 0.001, ηp2 = 0.19. Simple effect analysis indicated differential RSI effects on RTs for error and correct responses. The main effect of RSI was not significant, p = 0.54.
Regarding post-error adjustment, the mean value of post-error adjustment in accuracy across all RSI conditions was <0, indicating a post-error accuracy decrease (PEAD) effect observed in this study. The RSI (200 vs. 700 vs. 1500) repeated measures ANOVA of PEAD revealed a significant main effect of RSI, F (2, 120) = 51.24, p < 0.001, ηp2 = 0.46, the data analysis showed that the PEAD decreased with longer time intervals (−19.44 ± 9.03 % < −8.39 ± 8.56 % < −5.71 ± 8.46 %). Overall, accuracy following error responses remained lower compared to accuracy following correct responses during all RSI conditions. For PES, the analysis showed significant main effect of RSI, F (2, 120) = 16.54, p < 0.001, ηp2 = 0.22, the PES decreased with longer time intervals (105 ± 74.21 ms > 58.81 ± 61.24 ms > 42.46 ± 51.90 ms). For PERI, the results presented no significant RSI effect in accuracy and reaction time (ps ≥ 0.26). According to the results, no significant post-error reduction of interference was found.
EEG resultsThe waveforms and topographic maps of response-locked error-related components are displayed in Fig. 2. For ERN and CRN, the Trial Type (error vs. correct) × RSI (200 vs. 700 vs. 1500) ANOVA found a significant main effect of Trial Type, F (1, 60) = 98.32, p < 0.001, ηp2 = 0.62, indicating that the ERN amplitude was larger than the CRN amplitude. The interaction was also significant, F (2, 120) = 4.20, p < 0.05, ηp2 = 0.07. The simple effects analysis revealed that the RSI effect was significant only for error responses, F (2, 59) = 3.49, p < 0.05, ηp2 = 0.11, manifesting as larger ERN amplitudes with longer time intervals. The main effect of RSI was not significant (p = 0.13). Regarding Pe and Pc at the fronto-central region, it showed a significant main effect of RSI, F (2, 120) = 3.65, p < 0.05, ηp2 = 0.06, with Pe showing larger amplitude than the Pc. Additionally, the main effect of Trial Type was significant, F (1, 120) = 46.81, p < 0.001, ηp2 = 0.44. It indicated larger amplitudes with longer time intervals. The interaction effect was not significant (p = 0.23) (See Fig. 2A).
![A Response-locked ERN and Pe component at the fronto-central region [(FC1 + FC2 + Fz + Cz)/4] and topographic maps for correct and error responses during each RSI condition. B ERN − CRN and Pe − Pc difference waves at the fronto-central region and topographic maps for the difference between errors and correct responses during each RSI condition. ERN, error-related negativity; CRN, correct-related negativity; Pe, error positivity; Pc, correct positivity; ΔERN, ERN − CRN difference wave; ΔPe, Pe − Pc difference wave.](https://static.elsevier.es/multimedia/16972600/0000002500000001/v29_202504090716/S1697260025000195/v29_202504090716/en/main.assets/gr2.jpeg?xkr=ue/ImdikoIMrsJoerZ+w997EogCnBdOOD93cPFbanNensa1rW+zY7MJT+xyAusAd1eWSWVsld5nw/a67MxcQhKTuA8XDB/JRduOTRpZx+Q/oB11wMxo/mEJfHaTGt4ugGqa8HwfBR1Hyj5Fb/WRJrbRtu+BGeFzkPvX1F7afIeh+Nbj4Vkm8F0eSTU6Ze9uikf5vjCQHI7lY2OFfoSQebzBZjtUnkIFgpS1iTszIthaDILaZmndkizmFMwQf4YBhCsod++cKtxA2TK83RhPszb83QwmWpECHOzoVf6uekR97lF7xDYkRUpgrG97QXqhp "A Response-locked ERN and Pe component at the fronto-central region [(FC1 + FC2 + Fz + Cz)/4] and topographic maps for correct and error responses during each RSI condition. B ERN − CRN and Pe − Pc difference waves at the fronto-central region and topographic maps for the difference between errors and correct responses during each RSI condition. ERN, error-related negativity; CRN, correct-related negativity; Pe, error positivity; Pc, correct positivity; ΔERN, ERN − CRN difference wave; ΔPe, Pe − Pc difference wave.")
A Response-locked ERN and Pe component at the fronto-central region [(FC1 + FC2 + Fz + Cz)/4] and topographic maps for correct and error responses during each RSI condition. B ERN − CRN and Pe − Pc difference waves at the fronto-central region and topographic maps for the difference between errors and correct responses during each RSI condition. ERN, error-related negativity; CRN, correct-related negativity; Pe, error positivity; Pc, correct positivity; ΔERN, ERN − CRN difference wave; ΔPe, Pe − Pc difference wave.
Moreover, the analysis of ΔERN showed a significant main effect of RSI, F (2, 120) = 4.19, p < 0.05, ηp2 = 0.07. Pairwise comparisons revealed a significant difference in average amplitude between the 200 ms RSI and 700 ms RSI conditions, F (1, 60) = 8.01, p < 0.01, ηp2 = 0.12. Specifically, the average amplitude at 200 ms RSI (−1.87 ± 1.92 μV) was significantly smaller than at 700 ms RSI (−2.90 ± 3.10 μV). The analysis of ΔPe found no significant effect of RSI (p = 0.23) (See Fig. 2B).
Relationship between chronic stress and error processingCorrelation analysisAfter partial correlation analysis between chronic stress scores and error-monitoring EEG components as well as post-error adjustments, it indicated a negative correlation between chronic stress scores and PES (r = −0.31, p < 0 0.05) and PEAD (r = −0.22, p = 0.09). Specifically, chronic stress scores exhibited a negative correlation with PEAD at 200 ms RSI (r = −0.39, p < 0.01) and PES at 1500 ms RSI (r = −0.33, p < 0.01). Moreover, chronic stress scores also shared a negative correlation with ΔPe at 200 ms RSI (r = −0.29, p < 0.05) (See Fig. 3). Pearson correlation analysis revealed that the chronic stress scores were positively correlated with ΔPe (r = 0.27, p < 0.05) and ΔPe at 1500 ms RSI (r = 0.31, p < 0.05). The other analysis of error-related scores in relation to BDI and anxiety scores revealed no significant results (ps > 0.08). The Self-rating scores of SLSI, BDI and STAI are displayed in Table 2.

A The correlation analysis result between the chronic stress scores and PEAD. B The correlation result between the chronic stress scores and PES. C The correlation result between the chronic stress scores and ΔPe at 200 ms RSI. PEAD, post-error accuracy decrease; PES, post-error slowing; RSI, response stimulus interval; ΔPe, Pe − Pc difference wave. * p < 0.05; ** p < 0.01.
The reaction time and accuracy during each condition in the Flanker task (M ± SD).
| Incongruent | Neutral | Post-correct | Post-error | |
|---|---|---|---|---|
| Accuracy (%) | ||||
| 200 ms | 83.51 ± 9.08 | 85.96 ± 8.31 | 87.85 ± 6.21 | 68.41 ± 11.75 |
| 700 ms | 87.95 ± 6.24 | 89.93 ± 5.71 | 90.33 ± 5.03 | 81.94 ± 11.04 |
| 1500 ms | 88.27 ± 6.47 | 91.79 ± 4.87 | 91.14 ± 4.85 | 85.70 ± 10.28 |
| Reaction time (msec) | ||||
| 200 ms | 768.60± 107.36 | 737.43 ± 101.84 | 741.42 ± 108.15 | 846.54 ± 103.49 |
| 700 ms | 759.28 ± 111.46 | 720.23 ± 107.87 | 728.82 ± 108.95 | 787.63 ± 130.29 |
| 1500 ms | 803.75 ± 110.94 | 758.73 ± 109.41 | 773.53 ± 110.30 | 815.99 ± 121.38 |
M, mean; SD, standard deviation.
The chronic stress scores was 2.44 ± 0.35 (range: 1.53 ∼ 3.51). This study divided the participants into two groups based on the chronic stress scores, with 31 participants in the low-chronic stress group (range: 1.53 ∼ 2.43) and 30 in the high-chronic stress group (range: 2.45 ∼ 3.51). The chi-square analysis of age and gender for the two groups showed that there were no significant differences between the groups (ps > 0.90). Independent samples t-tests revealed that there were no significant differences between the two groups in BDI scores, state-anxiety, and trait-anxiety (ps > 0.18).
The results of post-error adjustment and ERP difference waves in the two groups are illustrated in Fig. 4. The repeated-measures ANOVA with the factors Group (low-chronic stress group vs. high-chronic stress group) × RSI (200 vs. 700 vs. 1500) was applied to the PES and PEAD to examine the effect of individual differences in chronic stress effect on post-error adjustment. The analysis of PEAD revealed a significant main effect of RSI, F (2, 118) = 53.17, p < 0.001, ηp2 = 0.47. The main effect of Group was marginally significant, F (1, 59) = 3.31, p = 0.07, ηp2 = 0.05. The Group × RSI interaction was significant, F (2, 118) = 2.85, p = 0.06, ηp2 = 0.05. Among all participants, PEAD decreased with longer time intervals. Under the 200 ms RSI condition, the high-chronic stress group showed significantly larger PEAD compared to the low-chronic stress group, F (1, 59) = 6.92, p < 0.05, ηp2 = 0.11. In addition, there was no significant difference in PEAD between the 700 ms RSI and 1500 ms RSI conditions in the low-chronic stress group (p = 0.73). For PES, the main effect of RSI was significant, F (2, 118) = 16.33, p < 0.001, ηp2 = 0.22. The Group effect was significant, F (1, 59) = 6.44, p < 0.05, ηp2 = 0.10. The PES decreased with longer RSI, and the high-chronic stress group (57.02 ± 6.51 ms) exhibited significantly smaller PES compared to the low-chronic stress group (80.19 ± 6.40 ms). The interaction was not significant (p = 0.90).

A Mean and standard error of PES and PEAD at different RSIs in the low-chronic stress group, and high-chronic stress group. B Mean and standard error of ΔERN and ΔPe amplitude at different RSIs in the low-chronic stress group and high-chronic stress group. PEAD, post-error accuracy decrease; PES, post-error slowing; ΔERN, ERN − CRN difference wave; ΔPe, Pe − Pc difference wave. * p < 0.05.
The analysis about chronic stress effect on error monitoring EEG components showed a significant main effect of RSI in ΔERN, F (2, 118) = 4.11, p < 0.05, ηp2 = 0.07. The other main effects and interaction effects were all not significant (ps ≥ 0.96). The repeated-measures ANOVA of ΔPe presented a significant interaction effect, F (2, 118) = 3.00, p = 0.05, ηp2 = 0.05. Further analysis revealed that the main effect of RSI was significant only in the low-chronic stress group, F (2, 58) = 3.84, p < 0.05, ηp2 = 0.12, indicating smaller ΔPe with more extended time intervals. The ΔPe was significantly larger in the low-chronic stress group than the high-chronic stress group only during the 200 ms RSI condition, F (1, 59) = 4.40, p < 0.05, ηp2 = 0.07. The main effects of RSI and Group were not significant, ps ≥ 0.24.
Relationship between error monitoring and post-error processingThe model of ΔERN and RSI on the PEAD presented a significant main effect of RSI, estimate = 0.65, SE = 0.07, df = 124.30, t = 8.90, p < 0.001, manifesting smaller PEAD with longer time interval. The model found no significant effect of ERN and interaction effect (ps ≥ 0.55). The linear mixed-effects model examining the effects of ΔERN and RSI on PES revealed a significant main effect of RSI, estimate = - 0.50, SE = 0.08, df = 124.40, t = −5.94, p < 0.001, indicating smaller PES under longer time interval. The main effect of ERN and interaction effect were not significant, ps ≥ 0.37.
The relationship between ΔPe and post-error accuracy decrease are illustrated in Fig. 5. The model of ΔPe and RSI on the PEAD revealed a significant main effect of ΔPe, estimate = 0.57, SE = 0.18, df = 178.34, t = 3.64, p < 0.01. The main effect of RSI was also significant, estimate = 0.68, SE = 0.07, df = 121.63, t = 9.67, p < 0.001. The ΔPe and PEAD interaction effect was significant, estimate = - 0.18, SE = 0.08, df = 171.32, t = −2.27, p < 0.05. After simple effects analysis, increased ΔPe amplitude predicted smaller PEAD at 200 ms RSI, estimate = 0.46, SE = 0.12, df = 59.00, t = 3.85, p < 0.001, with a slope of 0.39. The larger ΔPe amplitude was associated with smaller PEAD at 700 ms RSI, albeit marginally significant, estimate = 0.16, SE = 0.09, df = 59.00, t = 1.69, p = 0.09, with a slope of 0.21. There was no significant correlation observed at 1500 ms RSI, p = 0.65. The linear mixed-effects model assessing the effects of ΔPe and RSI on PES revealed a significant main effect of RSI, estimate = - 0.46, SE = 0.08, df = 121.17, t = −5.44, p < 0.01, suggesting smaller PES under longer time interval. The effect of Pe and interaction effect were not significant, ps ≥ 0.53.
 were used to predict the values of PEAD. There is an interaction between ΔPe amplitude and RSI, indicating that the impact of ΔPe amplitude on PEAD values varies across different RSIs. PEAD, post-error accuracy decrease; RSI, response stimulus interval; ΔPe, Pe − Pc difference wave.")
The relationship between PEAD and ΔPe amplitude. Based on a linear mixed-effects model, ΔPe amplitude and RSI (200 ms, 700 ms, 1200 ms) were used to predict the values of PEAD. There is an interaction between ΔPe amplitude and RSI, indicating that the impact of ΔPe amplitude on PEAD values varies across different RSIs. PEAD, post-error accuracy decrease; RSI, response stimulus interval; ΔPe, Pe − Pc difference wave.
This study explored the relationship between chronic stress and error processing via behavioral and electrophysiological indicators. Our results indicated a negative correlation between chronic stress scores and error processing, with chronic stress levels negatively correlated with the Pe component of error monitoring and post-error accuracy, especially in the early stages of error processing. Analysis of the relationship between Pe and post-error responses showed a positive correlation between Pe and post-error accuracy, suggesting sequential processing characteristics of error regulation under chronic stress.
Under short response-stimulus intervals, individuals showed larger post-error slowing (PES) and post-error accuracy decrease (PEAD), indicating slower reactions and more errors after error responses occurred with short intervals. As the duration increased, individuals showed gradual improvement in response speed and accuracy, consistent with prior studies. According to the multi-stage hypothesis (Ullsperger & Danielmeier, 2016; Wessel, 2018), attention directed towards the error responses likely drove these results in the short intervals, as cognitive resources were immediately allocated to error monitoring, leading to a temporary attention resources bottleneck that constrained post-error processing. With longer intervals, individuals can better allocate more cognitive resources for adaptive control. Our study found that 29.51 % of individuals showed improved or maintained the same accuracy on post-error trials compared to post-correct trials under the 1500 ms RSI condition, further validating the point. Further, We also observed a negative relationship between chronic stress and post-error slowing and post-error accuracy decrease. Individuals with high levels of chronic stress responded more quickly but had lower accuracy after error responses compared to those with low levels of stress. This effect was robust in the early phase of post-error processing. It suggests chronic stress negatively affects the speed-accuracy trade-off, leading to quicker but less precise responses following error responses. Previous research indicated a malfunction in up-down cognitive control following stress (Dixon et al., 2017; McEwen et al., 2016; Negrón-Oyarzo et al., 2016), suggesting that reduced activity in the lateral prefrontal cortex during chronic stress might impair top-down control, which could contribute to the observed decrease in accuracy.
In the components of error monitoring, we found a negative correlation between the amplitudes of ΔPe and chronic stress, particularly under the 200 ms RSI condition. The Pe component, associated with error awareness and motivational aspects, involves more prolonged and widespread neural processing than the ERN component. Error awareness arises from integrating top-down attention to salient signals with bottom-up information about errors from various sources (Koban & Pourtois, 2014). According to the global workspace Theory, changes in the amplitude of Pe reflect the content of error awareness within the global workspace, including factors such as task context and motor responses (Dehaene et al., 2014). Additionally, our previous research found that under acute stress, even when participants are aware of errors, there is a decrease in the amplitude of Pe (700 ms RSI), which is related to abnormal activity in regions like the lPFC, mPFC, and the premotor area (Hu et al., 2024). The reduction in Pe amplitude under chronic stress might indicate a diminished accumulation of error-related evidence. This study found no effects on the amplitude of ΔERN. Compared to the Pe component, which involves more complex underlying error processing, the rapid and automatic processing of the mismatch between error detection and the correct representation might make it less susceptible to negative emotional states. Previous research on chronic stress and error monitoring has also found that Pe is closely related to stress levels. For instance, Wu et al. (2014, 2019) found a positive correlation between Pe and long-term stress. Notably, we observed that in situations where task timing was urgent, the amplitude of ΔPe in individuals was negatively modulated by chronic stress. In contrast, under a 1500 ms RSI, there was a trend towards an increase in ΔPe (see Fig. 4). In other words, the negative impact of chronic stress on error awareness is moderated by task difficulty.
Furthermore, our research revealed a positive correlation between ΔPe amplitude and PEAD, indicating that a larger accumulation of error evidence is associated with enhanced accuracy in post-error responses. This implies that chronic stress-induced reductions in error awareness may further undermine post-error response accuracy. Previous studies have also demonstrated that Pe can positively predict post-error response times or accuracy (Li et al., 2024; Schroder et al., 2020), meaning that higher error awareness facilitates more effective post-error adjustments. Additionally, this effect is more robust under short RSI conditions, suggesting that improved error recognition mitigates early interference in trials following errors. This underscores the significance of error monitoring on post-error adjustments under chronic stress. Even during the brief maladaptive phase in post-error processing, effective error monitoring continues to confer benefits for post-error adjustment.
This study revealed the negative impact of chronic stress on error processing, affecting error monitoring and post-error adjustment phases. Our findings showed that the impact of chronic stress on post-error processing is moderated by levels of error awareness, especially in the early phase after the error response. Post-error processing involves a brief, general interference phase and a longer, task-specific control adjustment process. Early post-error processing fails to engage top-down cognitive control mechanisms for effective adaptive regulation when an individual focuses on the error response. Chronic stress leads to insufficient evidence accumulation of error awareness, which impairs the individual's ability to drive early post-error regulation effectively, resulting in larger interference from error monitoring during post-error processing. Shorter post-error response times in individuals with high chronic stress further support the notion of inadequate top-down cognitive control. This study aligns with previous research showing the negative impact of chronic stress on behavioral regulation and reveals worse error monitoring and more impulsive, maladaptive post-error processing under chronic stress. These findings provide evidence for understanding the development of cognitive impairments, psychological issues, and mental disorders associated with chronic stress.
This study has a few limitations that should be acknowledged. First, the questionnaire used is specific to the life stress of college students, so the findings primarily revealed the effects of chronic stress on error processing within this population. Effects on other groups, such as professionals or the elderly, require further investigation. Second, the study utilized a four-choice Flanker task, and the proportion of individuals who improved accuracy after errors under a 1500 ms response interval remains low. Further research is needed to explore whether chronic stress affects more precise error-specific regulation.
ConclusionOur research highlights the adverse effects of chronic stress on error monitoring and post-error processing. This is evident in impaired error awareness (ΔPe) and compromised early post-error processing. These findings not only highlight the deterioration of top-down behavioral monitoring functions due to prolonged stress but also raise awareness about the potential cognitive effects of chronic stress.
This work was supported by grants from the National Natural Science Foundation of China (32200878), Yunnan Fundamental Research Projects (grant NO 202301AU070143), Special Basic Cooperative Research Programs of Yunnan Provincial Undergraduate Universities Association (grant NO 202101BA070001–156; 202101BA070001–258), Anhui Province Universities Research Project for Distinguished Young Scholars (2023AH020041), and the Kunming University Talent Introduction Research Project (YJW2213).
