New diagnostic techniques for breast cancer detection have been developed and improved, in order to increase patient life expectancy. These techniques were emphasized in early detection of tumors with smaller dimensions, providing a better prognosis. Along with these new methods, it is necessary to propose training devices or tools to support health professionals to use them and rely on them. Our purpose is to develop a device to support thermographic analyses for early breast pathology detection. A programmable thorax was developed with the aim of simulating hyperthermic characteristics of breast pathologies in a defined area. Temperature distributions of breast tissue with a cancerous lesion were mathematically modeled using Pennes's equation, and a thermo-visual control system was built within the physical model in order to simulate a local thermal pattern of a patient's thermal image with infiltrating ductal carcinoma. Our results showed a good approximation of simulated thermal patterns to real images from a patient. In consequence we archived to obtain a thorax simulator device as first step in training health professionals in thermography techniques and to impulse the use of this method for early detection of breast pathologies.
Breast cancer is an important concern worldwide because of its high incidence. It is a common type of cancer both in developed and developing countries. This type of cancer represents 25% of women's cancer globally. The 2030 projection, according to Panamerican Health Organization, estimates more than 596,000 new cases and more than 142,100 mortal cases in the region, especially Latin America and the Caribbean (Acharya, Ng, Tan, & Sree, 2012). The options of treatment had lead health professionals to search tools for the detection of cancer in the early stages. Mammography is one of the most widely used techniques because it has good results in general population; however, it has important limitations in sensitivity and specificity, for example, limited diagnosis of women with dense breasts, especially young women. (Ng, Acharya, Keith, & Lockwood, 2007).
For this reason, new diagnostic techniques for breast cancer detection have been developed and improved, in order to increase patient life expectancy. These techniques focus on early detection of tumors with smaller dimensions providing a better prognosis; one of them is the infrared thermography (thermal imaging) that is a procedure used to record body thermal patterns using an infrared (IR) camera. The color segmentation of infrared thermal images is used for detecting a tumor's region by different temperature patterns associated with angiogenesis, inflammation, and blood supply increase (Acharya et al., 2012; Arora et al., 2008; EtehadTavakol, Sadri, & Ng, 2010).
Also, it is feasible to obtain delimited patterns with common data related to pathologies because temperature distribution in the body is influenced by many biological and physiological complex factors (Kateb, Yamamoto, Yu, Grundfest, & Gruen, 2009). Recent studies recognized that infrared thermography increases the possibility of early breast cancer detection and analyzed the technique performance using strict indoor controlled environmental circumstances (Etehadtavakol & Ng, 2013; Ng, 2009). The temperature of breast has been also previously analyzed with multiple sensors in the breast obtaining discrete data in three conditions, normal, benign and cancer as a static system. That analysis concluded that it is possible to obtain reliable data for a diagnosis, but a deeper analysis on dynamic systems is needed (Ng et al., 2007).
Thermography is less uncomfortable for the patients because it does not imply direct contact, radiation or compression. It is useful for women of all ages and different conditions like pregnancy, breastfeeding, implants, dense or fibrocystic breasts, and pre or post menopause. Even if women are under a hormonal replacement treatment could be candidates to use thermography for pathology detection (Ng & Sudharsan, 2001b; Ng, 2009). In past decades, thermography had many disadvantages compared with X-ray and mammography, such as thermographic cameras with low resolution, problems finding the dimensional origin of the lesion, or lack of training in the use of specialized equipment. Then it was not possible to use thermography to early pathology detection, alongside with the fact that it is a functional study (unlike anatomical studies such as ultrasound and mammography). Nevertheless, nowadays, using strict standardized protocols to interpret thermal patterns, proper infrared trained personnel have achieved reliable results (Acharya et al., 2012; Etehadtavakol & Ng, 2013; EtehadTavakol et al., 2010; EtehadTavakol, Chandran, Ng, & Kafieh, 2013; Ng et al., 2007; Ng, 2009). Thermography has an average sensitivity and specificity of 90%, as documented in literature (Ng, 2009).
However, it is important to use the technique along with X-rays because some studies have found that small tumors in deeper regions do not have a significant isolated impact on the surface and in consequence could not be identified by thermography (Ng & Sudharsan, 2001a). Still, we believe that thermography should be most frequently used for pathology detection because thermal patterns could be easily integrated and analyzed by a computer while mammography, in general, is linked to the radiologist's interpretation and it is more probable to yield false positives or negatives (Ng & Sudharsan, 2004).
Despite this international situation, in the Mexican health system, this technique has not been recognized as an efficient pre-diagnostic tool or complementary tool. We believe that this is related with the lack of tools for training personnel properly or the difficulty to transport those tools to remote communities. For that reason, we propose the design and construction of a programmable thorax model to promote the use and confidence of health care professionals on infrared thermography, as a pre-diagnosis tool. This simulator device could be used in training for thermography operators. The aim is to display a simulation of normal and abnormal thermal morphologies, facilitating thermographic analyses for early breast pathology detection.
Simulations of breast tissue have already been reported for technical imaging applications. Using computational simulations of breast models, a difference of temperature distribution is highlighted, depending on the size, depth and metabolic rate of the tumor (Agyingi, Wiandt, & Maggelakis, 2015; Kennedy, Lee, & Seely, 2009; Mital & Scott, 2006; Ng et al., 2007) These breast tissue phantoms were reported using static models; also, we are proposing a dynamic physic model that could simulate the thermal pattern according to parameters of real thermal images from patients. Our model will be a phantom of a woman's thorax from ectomorph complexion with an electric actuator within hydrogel. Therefore, it is possible to simulate thermal breast pathologies by integrating a thermo-visual control system in the electric actuator, inside a medium with physical features comparable with mammary gland characteristics.
The methodology consisted in computational modeling of temperature distribution on two conditions: 1) healthy and 2) cancerous breast tissue, followed by the construction of the physical thorax model device. Later, a thermo-visual control system was added for thermal patterns simulation, then the ITAE criteria algorithm was implemented with the purpose of evaluating the control performance, and finally a simulated thermal image was compared to a patient's thermal image (with infiltrating ductal carcinoma).
2Methods2.1Mathematical model of healthy and cancerous tissuePennes's equation was used in order to obtain a temperature distribution model from a tumor in the mammary gland (González, 2007; Lin et al., 2009; Paruch & Majchrzak, 2007; Pryor, 2011); this equation describes the distribution of the tissue temperature as a function of its blood perfusion and metabolic rate. This study used mammary tissue parameters. For tumor simulation, a heat source was added with tumor tissue parameters. The equation was solved by the Element Finite Method (EFM) in COMSOL Multiphysics 4.3 and was fixed with average parameters of mammary gland reported elsewhere (Pryor, 2011).
whereρ=tissue density
Cp=heat capacity
k=thermic conductivity
T=tissue temperature
ρb=blood density
Cb=blood heat capacity
ωb=blood perfusion
Tb=blood temperature
Qmet=metabolic rate
The simulation was based on models involving two different tumor sizes of 1 and 2cm in diameter, both with 5cm of depth and 3 different tumor metabolic rates of 29,000, 45,000 and 80,000W/m3. For the model's geometry, a hemisphere with a diameter of 18cm was used, the average breast size used in Gautherie's study (Gautherie, 1980) (Fig. 1). The boundary condition of the system was the heat exchange by the concave part of the system, while the initial conditions were set at T=309.5K.
2.2Programmable thorax developmentThe experimental platform (Fig. 2), consisted in temperature measurement through a thermal camera (FLIR E40); the actuator sends information to the computer, where a virtual instrument (LabVIEW, Fig. 3) generates a control signal and sends it to the driver through a data acquisition device. Then, the driver energizes the electric actuator to set the local surface temperature of the thorax.
2.2.1Programmable thorax constructionThe physical model was made from a fiberglass structure, using a sculpture of ectomorph complexion as a mold. The structure was then covered with a thin layer of silicone (∼2mm of thickness) simulating the epidermis of the breast (Fig. 4).
The hydrogel of polyvinyl alcohol (PVA) 5% p/v (Chu & Rutt, 1997; Di Girolamo, Celi, Latta, & Chiappino, 2012; Kashif, Lotz, McGarry, Pattison, & Chase, 2013), polymerized with sodium borate 0.5% p/v was poured into the area corresponding to mammary tissue, simulating mammary fat pad.
Thermal actuators were included inside the hydrogel to generate temperature gradients when they are energized, for breast thermal abnormality simulation.
2.2.1.1Design and construction of transducerElectric actuators are essential elements for physical simulation of breast injuries. The actuator design requires similar features from tumor masses, ovoid shape and size between 6 to 12mm. Using the Joule effect theory, 100Ω@1W5% resistors were used to produce heat radiation. To obtain temperature values generated by resistors, LM35 sensors were used.
For the construction of the actuator, AWG 24 wires were welded to both resistor and sensor as extensions to communicate with the programmable thorax physical interface (driver). The sensor used different color wires to distinguish between input voltage, output voltage and ground. Resistor and sensor were isolated with epoxy material to seal and obtain a tumor mass appearance. The electric power equation was used to obtain safe and optimum voltage for the electric actuators and energy supply and tumor heat dissipation simulation.
Thermal performance of hydrogel and silicone blend representing human skin was experimentally analyzed. The actuators corresponding to tumor tissue were placed 3 centimeters deep in the center of the upper quadrants of both breasts, because this is statistically the most common area of breast pathologies.
Once the actuators inside the hydrogel were supplied with energy, they produced heat and for heat production, thermal images were taken to analyze the temporal response (Fig. 5); there thermal spots associated to heat release and a temperature gradient produced by the actuator with an increase from 24.5°C to 28°C were perceived. The hydrogel kept its consistence and mechanical properties, such as a mammary tissue equivalent (Chu & Rutt, 1997; Di Girolamo et al., 2012). A thermal transport speed of 0.0064°C/s was estimated because the PVA density, for 6min to increase temperature above 2°C.
2.2.2Control design2.2.2.1Delay system modelingThe thermal actuator must set heat on the surface, therefore there is a delay before surface temperature reaches control temperature (Fig. 6). Then, the delay time was considered to control the device's temperature, this improves the system response for thermo-visual control.
For system modeling it was necessary to estimate 2 transfer functions: one function corresponding to the electric actuator temperature (located inside the thorax mammary gland) where the LM35 transductor was used; and another function to the thorax surface temperature measured with the thermal camera (Fig. 7).
The transfer functions were determined using a test tool in MATLAB, from temperature measurement data obtained by the sensor and the thermal camera with the actuator energized at 9V.
Eqs. (3) and (4) correspond to the first and second transfer functions, respectively. Eq. (3) is a first-order function, while Eq. (4) is a second-order transfer function, presenting a no linearity at the beginning of the temporal response.
The delay was determined plotting the estimate function of data from thermal camera measurements, considering the time necessary to stabilize the surface temperature produced by the actuator, using room temperature as start point.
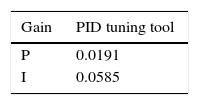
2.2.2.2Controller PI designThe thorax surface temperature was the variable that needed to be controlled. Equation 4 was used as a system to control this value, and for the controller a proportional structure PI (Eq. (5)) was employed. For controller design, the performance of the control system was analyzed from a block diagram simulation in Simulink including the determined delayed time (Fig. 8). During simulation, the PI control was tuned using the PID tuning Simulink tool. The tuning algorithm of this tool computes PID gains (PI gains for this study), choosing a crossover frequency based on the plant dynamics and designs for a target phase margin of 60° (Table 1).
2.3ITAE criteria implementationAn ITAE criterion evaluates the system control, improving PID control gains, integrating the time by absolute error over the time response. Multiple Simpson's 1/3 rule was employed as a numerical method for integration (Martins, 2005; Nguyen, Abbosh, & Crozier, 2016). The following steps for PI controller design using ITAE criteria are presented below.
- •
A control system developed in Simulink was employed (Fig. 9).
- •
A predefined function was used for ITAE index calculation, using defined parameters of the control system in Simulink. This step calculates one ITAE index per iteration.
- •
A MATLAB function was employed to find a minimum ITAE index.
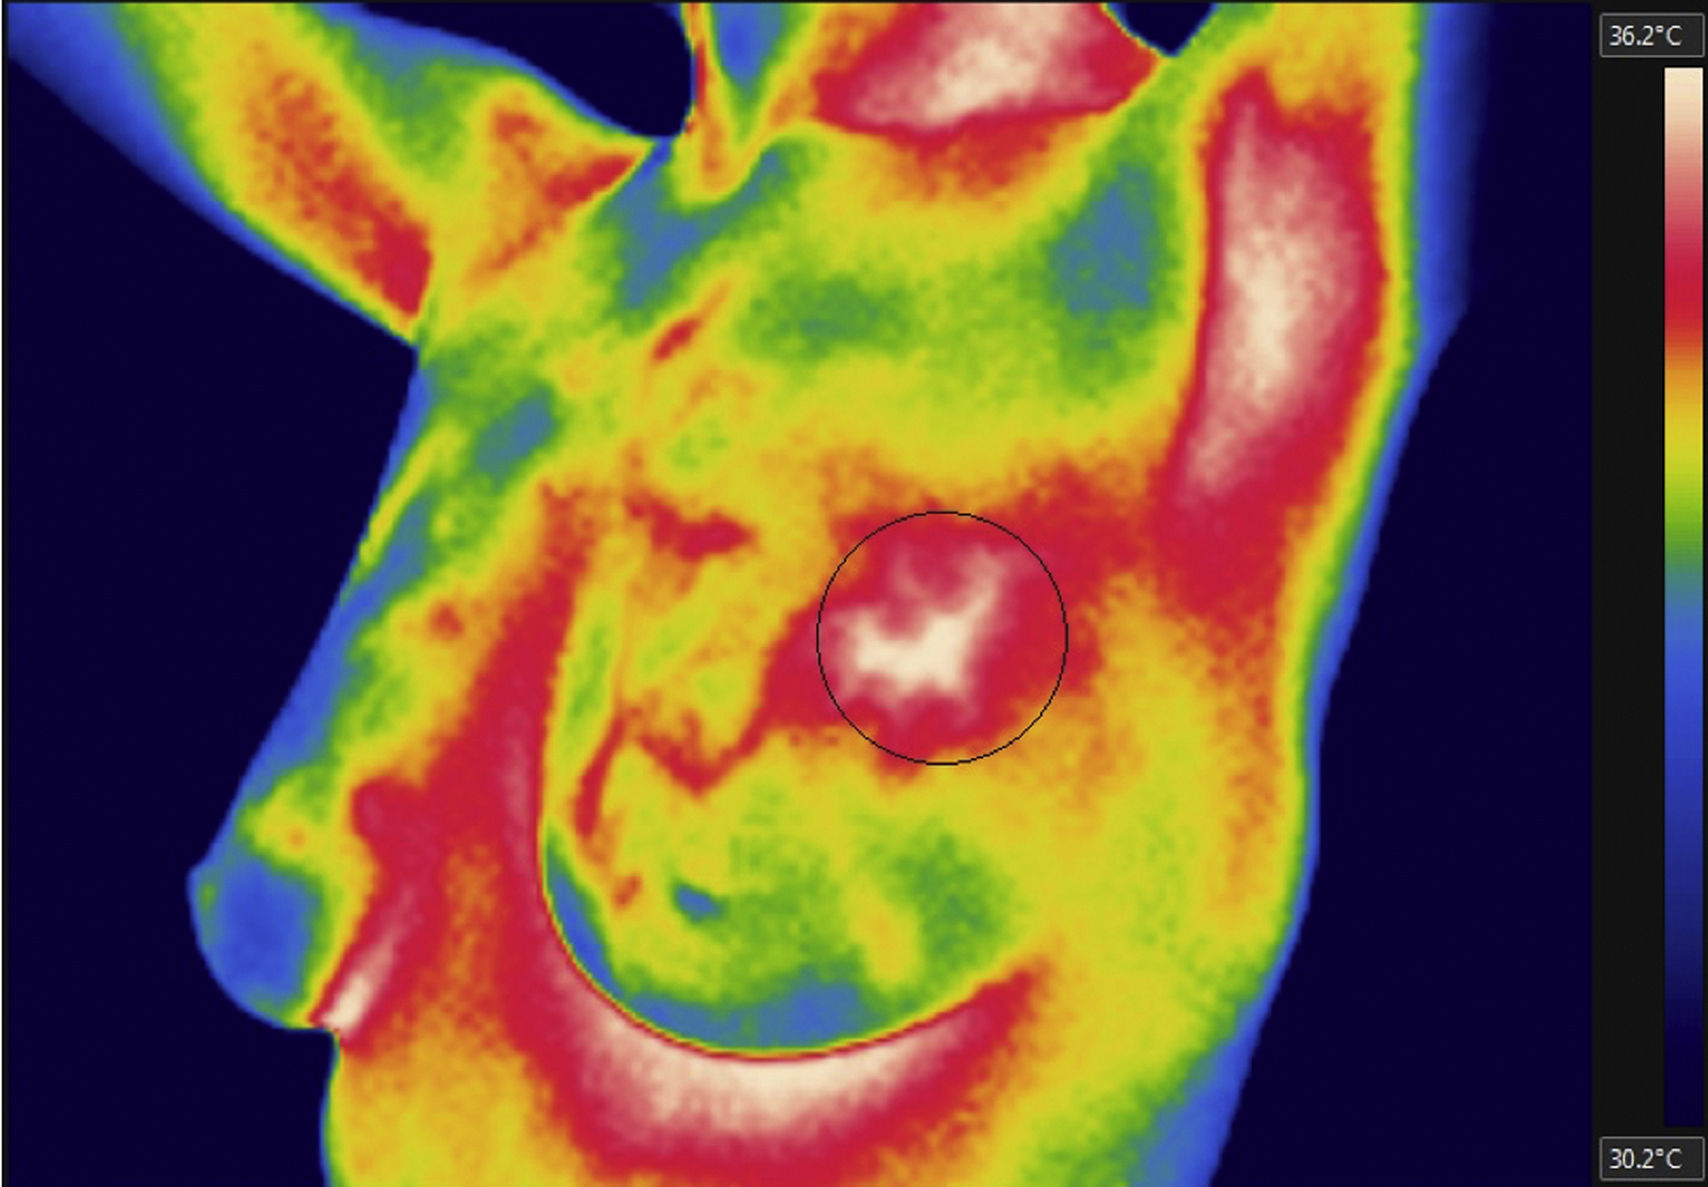
A thermal image of a patient was chosen; this patient is part of a study group of ages ranging from 40 to 45 with infiltrating ductal carcinoma. This thermal image was analyzed using FLIR Tools software, the thermal spot was located and minimum, maximum and average temperatures were observed. This process was repeated for the thorax thermal image. The temperature gradient between the highest temperature within the thermal spot and the temperature in the adjacent thermal spot area was determinated.
3Results3.1Mathematical model of thermal distribution in the mammary glandThe simulation that corresponds to a thermal distribution from a 2cm diameter tumor and a metabolic rate of 29,000W/m3 (Fig. 10) displayed a temperature gradient from 36.8 to 37.6°C, equivalent to 0.8 grades of difference between tumor and healthy tissue from the same patient. With a metabolic rate of 45,000W/m3 (Fig. 11), a gradient temperature from 36.8 to 38°C was obtained, equivalent to 1.2°C degrees of difference. The metabolic rate was then switched to 80,000W/m3 and a gradient temperature from 36.8 a 38.9°C with a temperature difference of 2.1°C was obtained (Fig. 12).
Previous studies showed that metabolic rates vary in a range from 20 to 200 times greater than metabolic rates of healthy tissue (González, 2011). Our results showed that metabolic rates of 29,000, 45,000 and 80,000W/m3 were 65, 100 and 178 times greater than metabolic rates of healthy tissue. From previous simulations, it was observed that by varying the metabolic rate of tumor tissue, the temperature gradients varied as well (temperatures between tumor and adjacent tissues).
In other simulation, a tumor with 1cm of diameter was used (Fig. 13) (half the size of the previous tumor), maintaining a metabolic rate of 45,000W/m3, position and depth as in previous experimentation. A temperature gradient from 36.8 to 37.3°C, equivalent to 0.5°C of difference was observed.
Finally, other hemisphere was added to the system with the same mammary tissue conditions to analyze the asymmetry produced by both breasts; one of the breasts was in healthy conditions and a tumor was fund in the other one (Fig. 14). It may also be noted that the location of the tumor in the right breast, located in the upper outer quadrant, statically corresponds to the place with the highest incidence of malignant tumors.
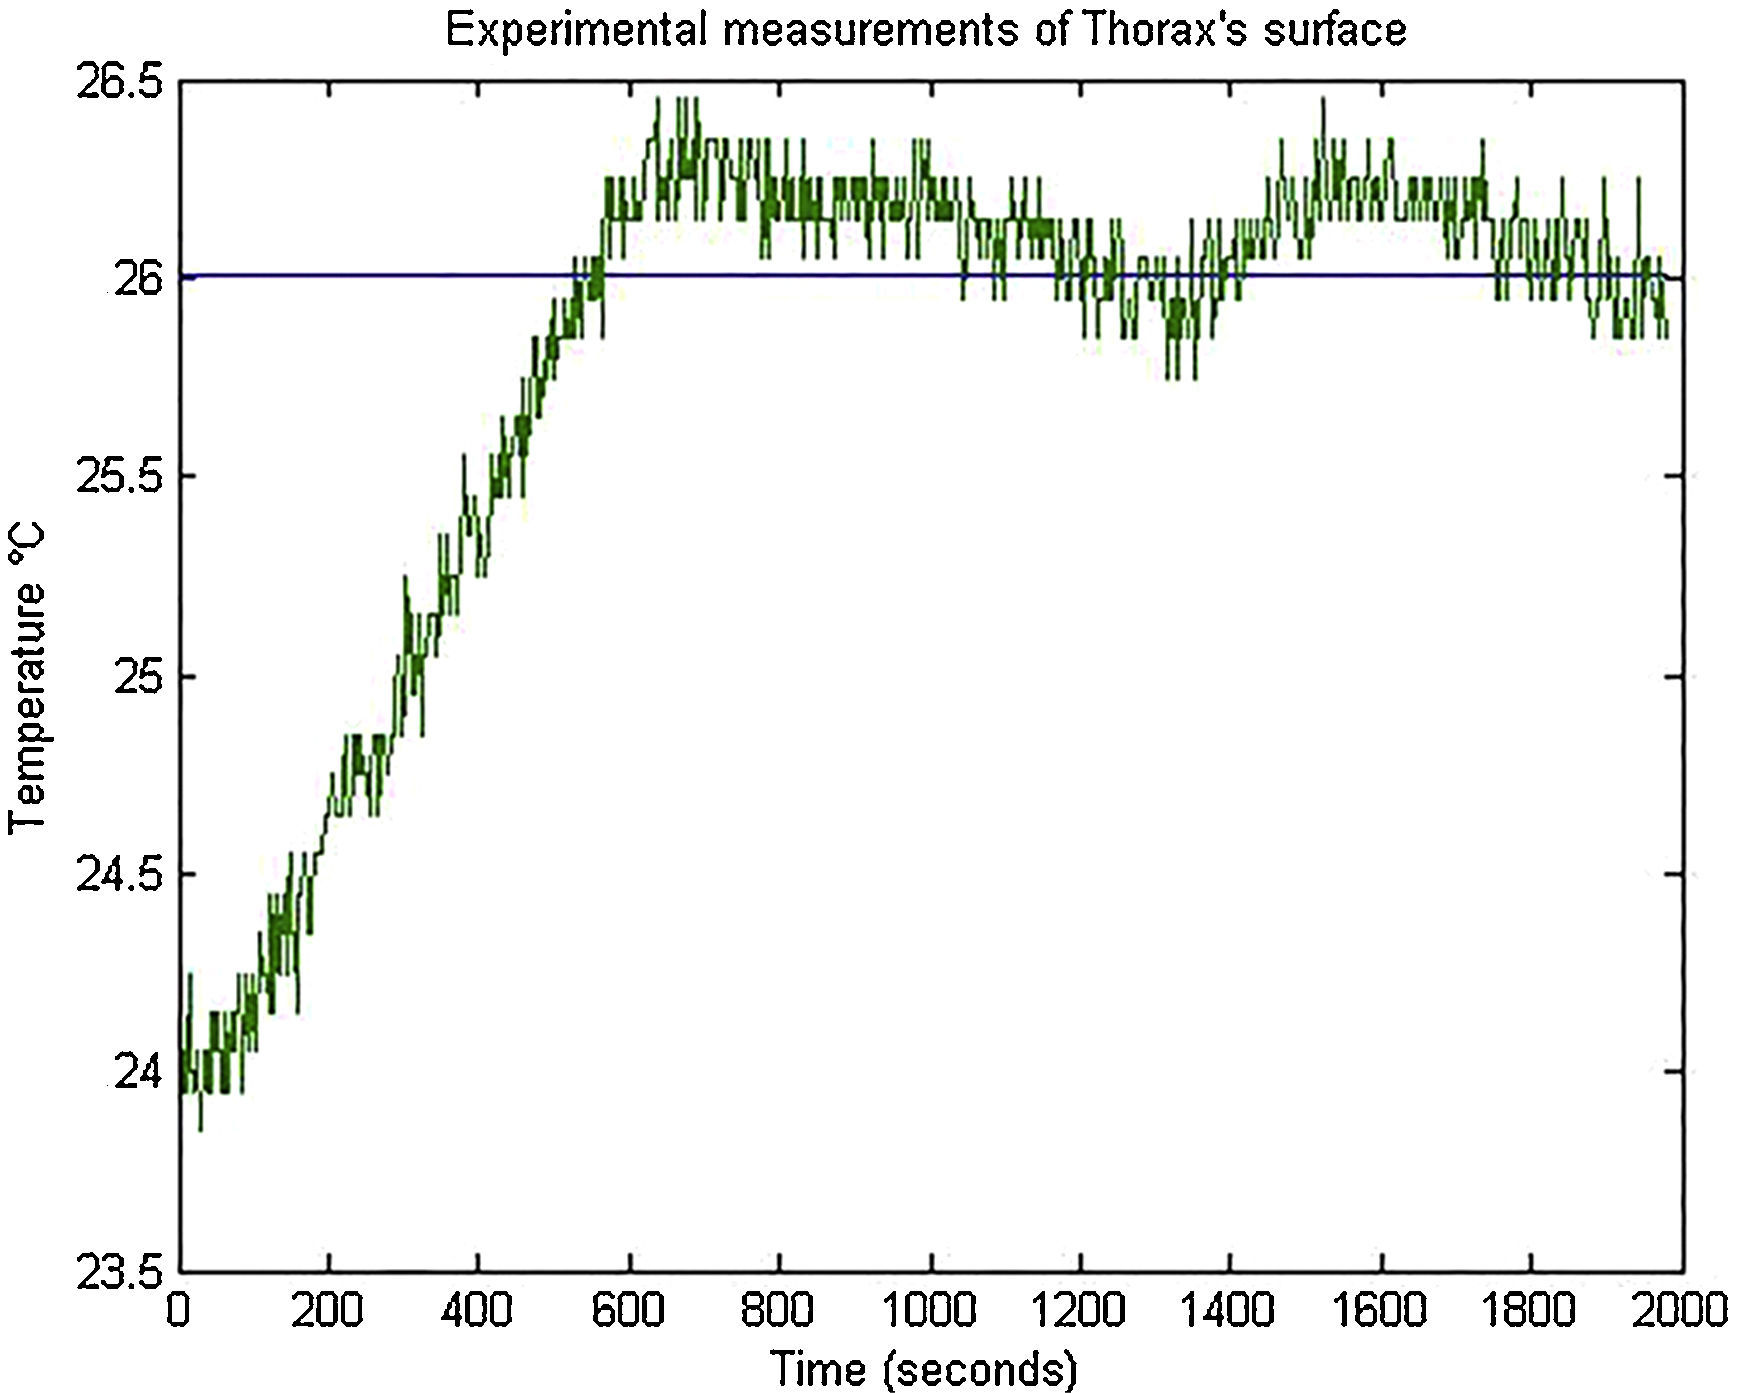
3.2Controller experimental resultsThe operation of the thermo-visual control system of the programmable thorax was tested controlling the surface actuator temperature to 26°C. Temperature measurements of thorax surface were captured from the virtual instrument in LabVIEW and these values were plotted in MATLAB to analyze control PI performance (Fig. 15). The setting time of the system was around 485s and the temperature signal had a minimum variation from 25.75°C to 26.45°C.
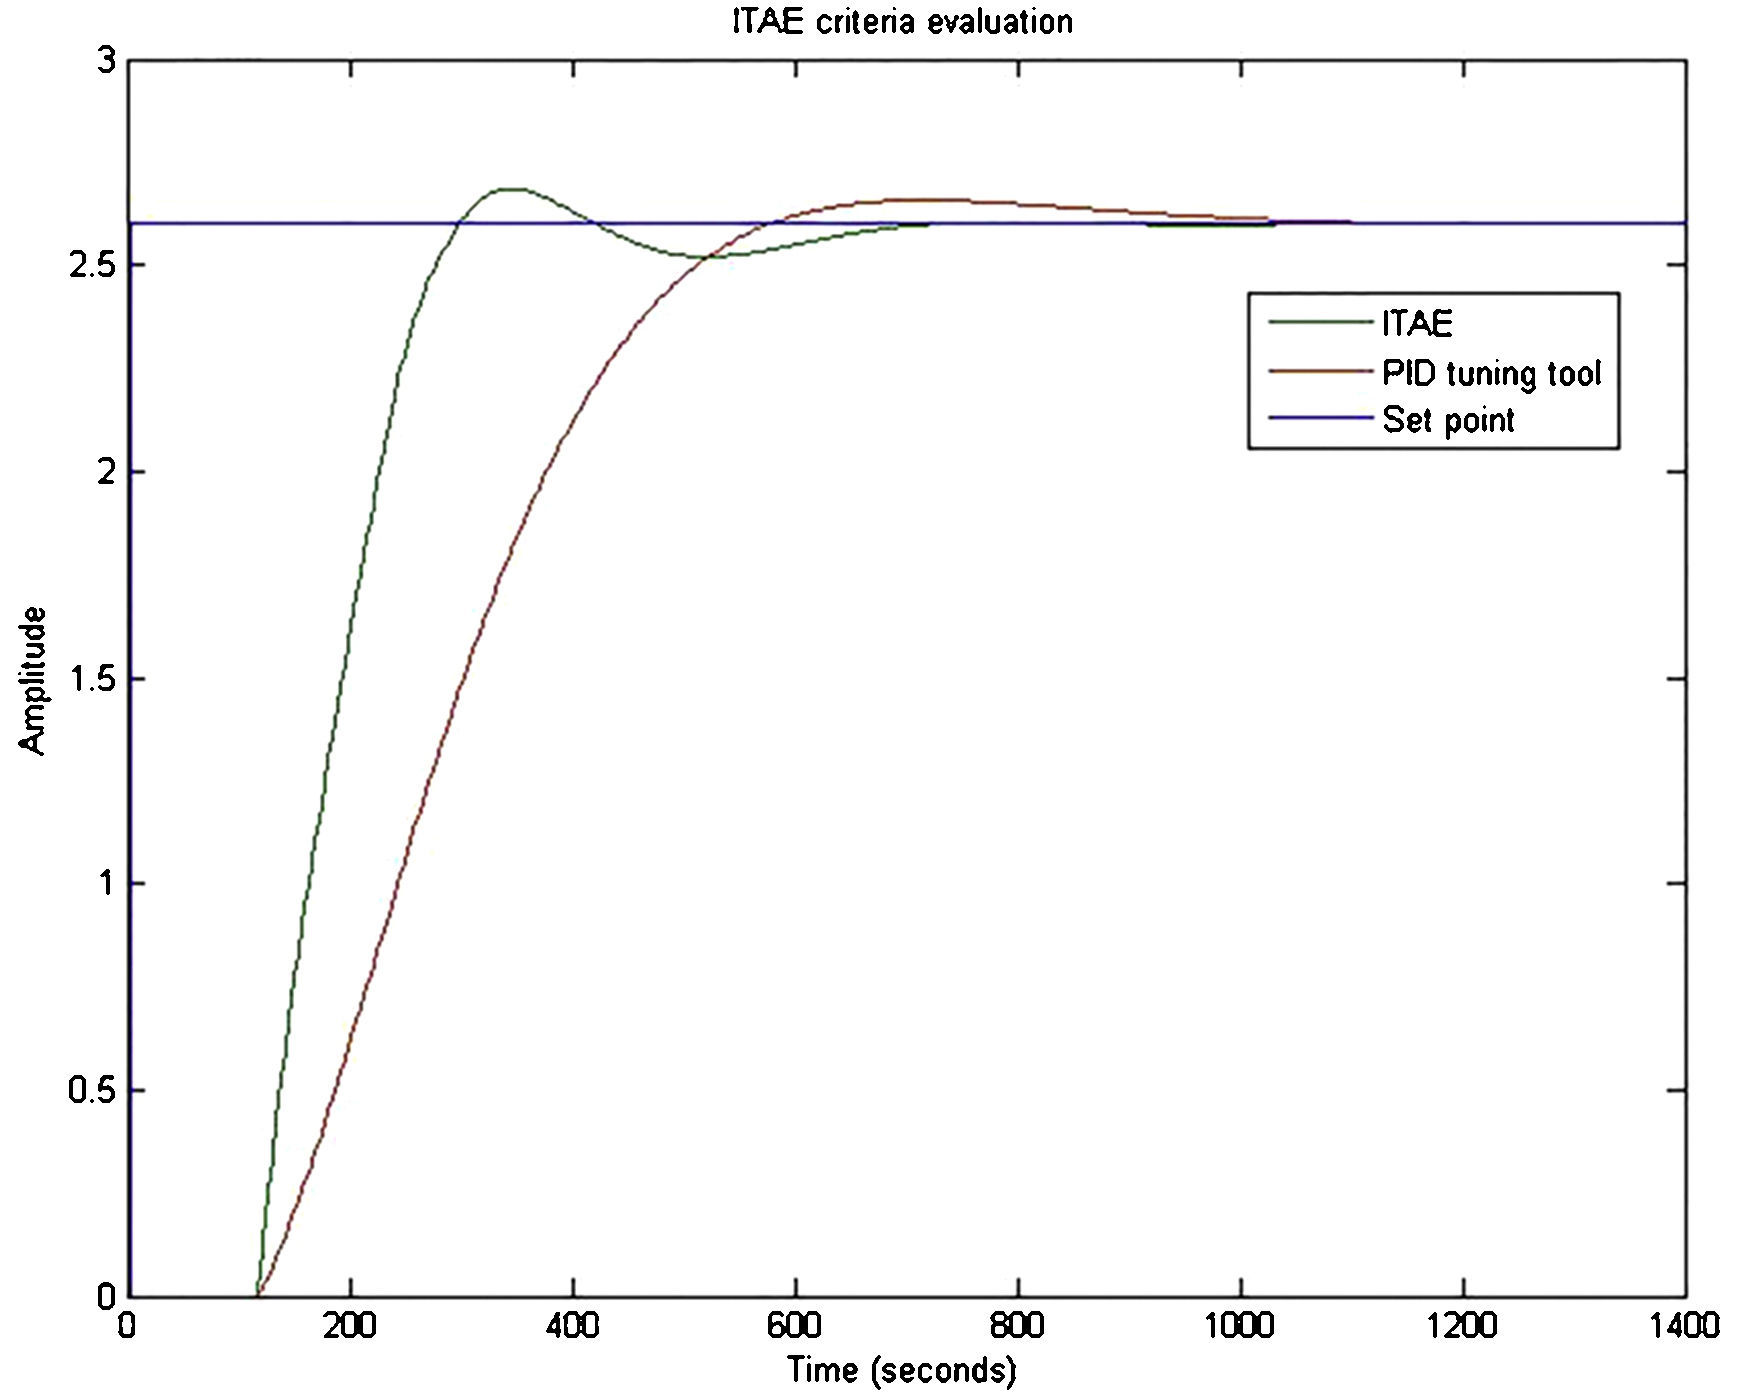
3.3ITAE criteria implementationThe gains obtained using ITAE criteria are shown in Table 2. The temporal response of the system using the gains of ITAE criteria was plotted. A better performance than the one obtained with the gains tuned by PID tuning tool was noticed. ITAE criteria tuning provided a slightly more oscillatory and faster response than the tuning with PID tuning tool (Fig. 16).
By analyzing the affected zone in the thermal images from the thorax simulator and patients, it was observed that the thorax simulator (Fig. 17) was capable to control the surface temperature around 28°C and, as a consequence, an increase of 2.2°C from the adjacent tissue, whereas in the patient image (Fig. 18) the temperature difference was 1.9°C, providing an error of 0.3°C. This variation was ascribed to a different shape and size of the thermal spot of the thorax simulator and patient.
4DiscussionFrom the mathematical model of thermal distribution in one human breast, it is highlighted that tumors with 1cm of diameter located 5cm deep are thermally visible. Furthermore, as in previous studies (Arora et al., 2008), the higher the metabolic rate and the bigger the tumors, the greater the temperature difference between healthy and tumor tissues, producing a larger thermal spot.
According to the information from mammary gland simulators for imaging applications, there is no specific simulator for thermography yet. There are simulators with thermal properties, but they are used for thermo-acoustic imaging (King, Moran, McNamara, Fagan, & Browne, 2011; Xia et al., 2011; Wang, Liang, Witte, & Xin, 2015), which are not based on the same operating principle that thermography. Also, the thermal properties of those models are focused on the type of dielectric material used and not on a control algorithm. It is important to notice that so far there is no simulator with features comparable to the ones presented in this article.
On the other hand, control temperature varies in a specific range (operation range) because of the mathematical structure of control and tuning parameters. These variations could be eliminated by adding an external cooling system to maintain the set temperature on the surface reflected by the actuator.
Comparison of thermal images between the thorax simulator and patients, using the mathematical model, showed that thermal images resembled tumors of 2cm of diameter and at a 5cm depth with a metabolic rate of 80,000W/m3 (Fig. 12), and the temperature difference between tumor and healthy tissue was also found around 2°C. This does not mean that both patient and simulation thermal images have the same components since the temperature gradient displayed is not only a function of tumor metabolic rate, but also of the size of the tumor.
Contrary to patient thermal image, the thorax simulator did not show the temperature gradients corresponding to warmer zones located at skin folds (under the mammary gland or armpit). Also, in Table 3, it can be seen that temperatures simulated in the thorax were not equal to those of the patient. This was because the operating range of the thorax was from 24°C to 28°C. To equilibrate the thorax temperatures with human ones, it is proposed to homologate the local temperature observed by the thermal camera from the virtual instrument in LabVIEW. This is accomplished by adding this measurement to a scale factor (about 8.7°C) so that the temperatures observed in the programmable thorax through the virtual instrument correspond to human body temperatures.
5ConclusionsThermal imaging has proved to be an effective complementary technique for detecting breast pathologies, helping cancer diagnosis because of its sensitivity, specificity, comfort and low cost. But medical training for image interpretation is based on clinical case studies and analyses that require a great amount of time and resources. In consequence, we proposed a simulation device to allow health professionals to become familiar with the imaging process and thermographic data interpretation. This device simulated two thermal patterns: a healthy breast and a breast with pathology. Results were compared with an image from a patient. The hydrogel and silicone blend thermal performance was similar to human skin, but on the operational rank of temperatures was between 24°C and 28°C. Mathematical procedures could be used to adjust the operational temperature so as to correspond to human body temperature. From the mathematical model of thermal distribution we obtained that tumors with 1cm of diameter located 5cm deep are thermally visible. In conclusion, thermal images obtained by the simulator achieved to show tumor tissue at specific metabolic rates, the model of the simulator is based on an algorithm and the physical thorax is a dynamic system, for these reasons our thorax simulator is a promising tool for training health professionals in the important issue of early detection of breast pathologies. Further simulator proposals should consider also the size of tumors in the algorithm.
Conflict of interestThe authors have no conflicts of interest to declare.
The authors are grateful to Bernardino Rodríguez-Morales for his technical support and revision of the project, and to Ana L. Ramos-Jacques for her comments in editing and proofreading the manuscript.
Peer Review under the responsibility of Universidad Nacional Autónoma de México.


