


Family firms face the dual challenge of succession and innovation. Based on the attention-based view, this study empirically investigates the effect of intergenerational power gap on corporate R&D investment, using a sample of Chinese listed family firms. We find that intergenerational power gap has a negative effect on corporate R&D investment, and this negative relationship is amplified in traditional industries and in firms with a low proportion of institutional ownership. Our findings have theoretical and practical implications for R&D investment in the family business succession process.
China's reform and opening up has led to the establishment of many family businesses, which have achieved great progress. However, as the first generation of entrepreneurs is ageing, their management power is weakening (Zhao et al., 2020). As the second generation of entrepreneurs gradually takes over business amidst China's adjustment in industrial structure and economic transformation and upgrading, family businesses have entered the first peak period of succession (Yu et al., 2013). According to the China Modern Family Business Survey Report released by Forbes China in September 2015, 54.98% of family businesses listed in the A-share market are co-led by the first and second generations of entrepreneurs. Therefore, the intergenerational power transition of family businesses has attracted extensive academic attention. In addition, investment in R&D is investment in future growth, which helps firms improve their performance and build sustainable competitive advantage (Kotlar et al., 2014; Nathan & Rosso, 2022). R&D also plays a pivotal role in the long-term survival and prosperity of family businesses (Islam et al., 2022). Currently, China's economic growth is transitioning from being investment-driven to innovation-driven. Hence, R&D investment in family businesses is important. However, extant studies have found that the intergenerational power transition of family businesses is difficult in terms of innovation (Hauck & Prügl, 2015). Therefore, exploring how the intergenerational power transition affects R&D investment in family businesses facing the dual challenge of succession and innovation is of theoretical and practical significance.
Intergenerational power transition in family businesses is a process of gradual abdication of the first generation and a gradual growth of the second generation of entrepreneurs from outsiders to chief decision makers (Handler, 1990). This unique dynamic power shifting between generations forms the intergenerational power gap – the difference in power between the second and first generations. As power is a pivotal factor in determining resource allocation, R&D investment, as an important dimension of resource allocation, is deeply affected by organisational power change (Garms & Engelen, 2019; Blagoeva et al., 2020). Previous studies have revealed different mechanisms through which intergenerational power transitions affect corporate R&D investment. The approach-inhibition theory of power holds that higher power can activate ‘behavioural approach system’, while lower power can activate the ‘behavioural inhibition system’ (Krause et al., 2015). Therefore, when the first generation gradually devolves power and the second generation gradually obtains management autonomy (i.e. increasing the intergenerational power gap), the behavioural approach system of the second generation will be activated, urging it to hold a more positive attitude towards risk and to pay more attention to the potential return of R&D investment. However, the development of power research from the perspective of social psychology in recent years has indicated that the expression of power is influenced by personal and contextual factors (Flynn et al., 2011). At the same time, when pursuing goals, high-power people may activate their behaviour approach and behaviour inhibition systems simultaneously to approach necessary resources and avoid unnecessary ones (Krause et al., 2015). Although the unique background of intergenerational power transition gives the second generation a higher decision-making ability and behavioural freedom, which helps to promote innovation, it also brings certain problems. For example, Duran et al. (2016) argued that the next generation is more inclined to incorporate risk-averse investment preferences to focus on wealth, maintaining family control and pursuing non-economic goals. In addition, because the second generation is usually eager to show their individual ability, they prefer to invest in projects with a low risk and a short payback period. However, it is not only difficult for business innovation to reflect individual ability through performance improvement in the short term, but it also causes strong dissatisfaction due to R&D investment failure (Carney et al., 2019). To avoid these problems, the second generation's behavioural inhibition system is activated, which is unfavourable towards increasing corporate R&D investment. The above research provides useful insights for understanding how the intergenerational power gap affects corporate R&D investments. However, three limitations persist in the existing literature.
First, most previous research argues that the second generation is more conducive to innovation but overlooks many factors that may inhibit innovation. According to a Report on the Status of Young Generations of Chinese Family Businesses issued by the Family Business Committee of the China Private Economic Research Association in 2017, there is no significant difference between younger and older generation entrepreneurs in terms of internal product quality and technological innovation. More education and overseas experience do not bring a stronger sense of innovation in the younger generation of entrepreneurs. One explanation is that to promote innovation, the second generation requires not only external knowledge but also tacit knowledge inherited from predecessors (Letonja & Duh, 2016). In addition, Zhu and Kang (2022) contended that the power transition to the second generation faces many challenges, such as political connections, bank–firm relations, business partnerships and how to build the legitimacy of successors’ authority. At the same time, the motivation to preserve socioemotional wealth and risk aversion makes younger generations more inclined to reduce their R&D investment (Cucculelli et al., 2016; Duran et al., 2016). These factors can have an impact on corporate R&D investment via their influence on the focus and attention of the second generation. Therefore, innovation challenges faced by the second generation are crucial when discussing how they affect corporate R&D investment.
Second, the existing research on power gap mainly focuses on managers (e.g. chairman, CEO and co-CEO) in business organisations, but family business practices and experience have not been studied (Krause et al., 2015). Unlike non-family companies, family businesses have special significance for countries with a deep ‘family culture’, such as China (Dou & Li, 2013). Because of the influence of many factors, such as the economy, family and society, the power issue in family businesses is complex and rarely studied (Ucbasaran, 2018). In particular, intergenerational power transition, which greatly changes the distribution of power in family businesses, lacks empirical evidence on how it affects corporate R&D investment.
Finally, extant studies on intergenerational power gap mainly focus on its impact on executive compensation, employee behaviour and team performance (Krause et al., 2015). However, their relationship with corporate innovation strategy implementation, such as R&D investment, has rarely been explored.
This study examines how intergenerational power gap affects R&D investment through its impact on the focus and attention of the second generation based on the attention-based view (Ocasio, 1997). Meanwhile, the principle of situated attention holds that changes in situational factors shift the focus and configuration of managers’ attention (Joseph & Wilson, 2018; Ocasio et al., 2018). Thus, it is worthwhile to further explore the factors leading to the shift in the second generation's attention to the field of innovation. Using a sample of public family firms in which both the first and second generations are involved from 2007 to 2016, we examine the impact of intergenerational power gap on corporate R&D investment. We further investigate how institutional ownership and industry type moderate this relationship.
The remainder of this paper is organised as follows. Section II reviews the literature and develops our hypotheses. We describe the data and methodology in Section III, and present the empirical analysis results in Section IV. We examine the endogeneity issue and conduct robustness checks in Sections V and VI, respectively. Section Ⅶ concludes.
Theoretical background and hypothesis developmentIntergenerational power gap and innovation investmentA burgeoning body of literature examines organisational decision making from a cognitive perspective, one of which is the attention-based view (Kammerlander & Ganter, 2015). Under the assumption of bounded rationality, the attention-based view indicates that managers’ focus and attention configuration affect firms’ strategic decision making (Ocasio, 1997). Firms’ strategic decisions are a result of managers' selective attention to various issues and solutions (Joseph & Wilson, 2018; Ocasio et al., 2018; William,1997). In the context of overall economic transformation and innovation, a realistic and serious problem is posed to the second generation: Is it a rational choice to promote firm innovation during succession? In the spirit of the attention-based view, we explore how an increase in intergenerational power gap affects the attention focus and configuration of the second generation and thus affects corporate R&D investment from three aspects.
First, from the perspective of legitimacy, an increase in the power gap between generations suggests a gradual succession of the second generation; however, the existence of the first generation's absolute authority makes the lack of legitimacy of the second generation's authority more prominent (Li et al., 2022). Due to the deficiency of the second generation in terms of ability, experience and qualifications and the non-standard management model of family businesses, it is difficult for them to obtain recognition, trust and support. Consequently, there is an urgent need for the second generation to gain legitimacy and achieve rapid success. This motivation causes the second generation to allocate more resources to short-term projects with low risk to demonstrate individual abilities and thus establish legitimacy. In contrast, increasing R&D investment not only makes it difficult to reflect the second generation's capability through performance improvement in the short term, but also causes stakeholders’ dissatisfaction due to R&D investment failure, further magnifying the issue of legitimacy disadvantage (Carney et al., 2019). Therefore, the legitimacy disadvantage makes the second generation pay more attention to the issue of rapid success and, thus, to projects with a short period, low investment and low risk.
Second, the increase in the power gap between generations indicates that the second generation has gradually transitioned from assisting the first generation to managing the business independently. The second generation usually faces problems such as a lack of experience and ability, an unfamiliar work environment, confusion in strategic decisions and operational dilemmas. At this point, the second generation is more likely to focus on stabilising the business and helping the company to achieve a ‘soft landing’ as soon as possible. Inside the firm, the second generation must be familiar with the business and communicate with experienced workers to reduce conflicts. Outside the firm, it is necessary to carefully handle relationships with stakeholders and strive for their understanding and support. However, R&D projects with a long payback period and high risk require managers to spend a lot of time and energy and may incur resistance (Saemundsson et al., 2022), which may limit the second generation's willingness to invest.
Finally, a company's current level of resource availability can affect managers' perceptions of specific issues and solutions, urging them to focus on certain activities while ignoring others (William, 1997). Studies find that the second generation's lack of competency in social networks, government relations and resource integration leads to a decline in family business performance (Amore et al., 2021). Schlömer-Laufen and Rauch (2022) pointed out that because of the founders’ ability, reputation, relationship and other special assets that are difficult to transfer, and the conflict between other stakeholders and families when the founder is expected to step down, family businesses lose some of their value during succession. This shows that an increase in intergenerational power gap highlights the problem of the second generation's lack of competence, which creates a potential performance dilemma for family businesses. Since financial resources are the premise of the implementation of an R&D strategy, the performance dilemma faced by the second generation in succession may lead to an insufficient supply of financial resources for R&D investment and thus to lower attention towards innovation activities (Mateut, 2018).
Based on the above discussion, the second generation's legitimacy disadvantage, the pressure to keep the business thriving and the dilemma of performance during the succession process will urge its decision-making attention to focus more on short-term, low-risk, low-investment projects. However, because R&D investment is long-term, high-investment and high-risk by nature (Hirshleifer et al., 2012), it is not in line with the guidelines of the second generation's decision-making attention allocation. Therefore, with an increase in the power gap between generations, the R&D investment of family businesses decreases. Thus, we propose the following:
Hypothesis 1 The increase in intergenerational power gap has a negative impact on the R&D investment of family businesses.
Although the second generation is expected to allocate more attention to projects with short terms, low risk and low investment due to the lack of legitimacy and a series of challenges during the succession process, changes in situational factors will lead to a shift in managers' focus and attention configuration, which will lead to a change in the firm's strategic decision making (Joseph & Wilson, 2018; Ocasio et al., 2018; William,1997). Hence, we further discuss situational factors that may cause a shift in the second generation's attention and ultimately affect the R&D investment of family businesses.
Institutional ownershipInstitutional investors are the dominant force in financial markets (Fernando et al., 2014), and have three advantages over individual investors: scale, personnel and information (Sakaki & Jory, 2019). Scale advantage refers to the large scale of institutional investors' shareholding, which strengthens their voice in firm decision making (Sakaki & Jory, 2019). Personnel advantage indicates that institutional investors usually have experienced and professionally trained teams of analysts to provide investment advice (Fernando et al., 2014). The information advantages are twofold: institutional investors have opportunities to privately communicate with firms’ management team to obtain ‘soft news’ that retail investors cannot obtain Sakaki and Jory (2019); institutional investors have more time and energy to analyse and process financial market information (Fernando et al., 2014). In addition, previous studies show that unlike individual investors' free-riding behaviour in monitoring companies, institutional investors actively influence managers’ and firms’ decision making, which constitutes an important mechanism in corporate governance (Fernando et al., 2014; Sakaki & Jory, 2019).
From the perspective of legitimacy, increased shareholding by institutional investors not only enhances their voice but also makes them face greater liquidity risk, leading to a stronger motivation for long-term shareholding (Sakaki & Jory, 2019). Therefore, the attention of the second generation is more likely to turn to long-term projects, such as R&D, to obtain recognition and enhance legitimacy in the process of succession when institutional ownership is high. On the one hand, this long-term orientation of institutional investors alleviates the concern of the second generation about the dissatisfaction of stakeholders caused by potential R&D failure in the process of succession. On the other hand, it also urges the second generation to turn its attention to long-term decision making to maximise revenue in the long run, win recognition and improve legitimacy. Conversely, when the proportion of institutional investors is low, shareholders’ short-term speculation motivation is high, given that the majority of shareholders are retail investors (Sakaki & Jory, 2019). This situation drives the second generation to focus more on short-term projects that are effective and less risky during succession, further reducing long-term investments.
In addition, previous studies document that in family businesses, large family shareholders have incentives to deprive minority shareholders of interest—Type II agency conflict (Zhu & Kang, 2022). In particular, agency conflicts can be more severe during the succession process. Specifically, challenges in the succession process, including the pressure to keep the business thriving and the performance dilemma, make the second generation pay more attention to the reservation of the family's socioemotional wealth, rather than maximising the interests of minority shareholders. An increase in institutional ownership can effectively mitigate Type II agency conflict, reduce the motivation of the second generation to deprive minority shareholders of their interests in pursuit of socioemotional wealth during the succession process (Fernando et al., 2014) and turn their attention to decisions such as R&D that are conducive to the growth of firm value. By contrast, when institutional investors have a low shareholding proportion, they have less impact on the second generation. At this point, the second generation is more likely to adopt a risk-averse preference to avoid the loss of socioemotional wealth and abandon the potential benefits of R&D investment.
Based on the above analysis, as institutional investors’ shareholding increases, a stronger long-term shareholding orientation and closer monitoring of the second generation can direct the attention of the second generation towards R&D investment in family businesses. Thus, we propose the following:
Hypothesis 2 The negative impact of increased intergenerational power gap on R&D investment is weaker in family firms when institutional ownership is high.
R&D investment is not only based on the decision-making results of the company itself but also determined by the nature of the industry (i.e. high-tech vs. traditional industry) (Yin & Sheng, 2019). First, unlike traditional industries, high-tech industries inherently involve R&D investment (Yin & Sheng, 2019). According to the Statistical Analysis on R&D Activities of Industrial Enterprises Above Designated Size in 2016 released by the China Academy of Science and Technology for Development, the investment intensity of R&D in high-tech industries such as computers, telecommunications, electronic equipment manufacturing, pharmaceutical manufacturing and chemical product manufacturing is far above average. Additionally, based on the logic of legitimacy, the attention of the second generation is more likely to shift to increasing R&D investment to mitigate its legitimacy disadvantage in the high-tech industry. Chung and Luo (2013) pointed out that family business successors often obtain promotion opportunities through a particularistic relationship, which conflicts with the professional management norms advocated by high-tech industries, thus causing a legitimacy disadvantage for family business successors. R&D investment is a lifeline for high-tech industries (Zhu et al., 2019). Therefore, the second generation in the high-tech industry has strong incentives to shift its attention to R&D investment to attach importance to the cultivation of the core competitive advantage of the firm and thus improve legitimacy. By contrast, traditional industries have low technological content, and thus, firms lack the incentive to increase R&D investment (Yin & Sheng, 2019), making legitimacy a less severe issue for the second generation.
Second, the frequency of product and technological innovation in high-tech industries is higher and innovation opportunities are transient (Terjesen & Patel, 2017; Zhu et al., 2019). Thus, the second generation in the succession process possesses limited time to become familiar with the business. The attention of the second generation needs to shift from keeping the business to identifying and catching the innovation opportunities of the industry, which can be beneficial for the increase in R&D investment in family businesses. By contrast, traditional industries are characterised by slow technological upgrades and a large proportion of imitation. The second generation tends to be more comfortable imitating others’ innovation and has more time to achieve a ‘soft landing’.
Finally, the high-tech industry can obtain a large amount of government subsidies and tax incentives (Busom & Beatriz, 2014) and its bank credit approval standards are less strict (Howell, 2018). The introduction of a large amount of resources help to alleviate the financing constraints of high-tech firms. In addition to directly intervening in resource allocation, favourable industrial policies can also reduce financing costs for high-tech industries by improving their prospects and information environment (Bin, 2008). The improvement of the financing environment for the high-tech industry increases the resources available for subsequent R&D investment, alleviating the performance dilemma in the second generation's succession process. In contrast, traditional industries, as the focus of current industrial policy reform, face an urgent need for industrial restructuring and overcapacity problems, making it difficult to obtain tax treaties (Busom & Beatriz, 2014). The capital market is also conservative regarding the prospects of traditional industries, leading to high financing costs. The deterioration of the financing environment also leads to a shortage of innovation resource supply, thus reducing the possibility that the second generation will turn its attention to R&D.
In summary, the additional credit, finance, taxation and capital market support received by the high-tech industry and the motivation of the second generation to enhance legitimacy and seize innovation opportunities will make the second generation more likely to turn to corporate R&D investment. Thus, we propose the following:
Hypothesis 3 The negative impact of the increased intergenerational power gap on R&D investment is less salient in high-tech industries.
We started with all Chinese companies listed in the China Stock Market & Accounting Research (CSMAR) database. Because the China Securities Regulatory Commission stipulated the disclosure specifications for R&D expenditures of listed firms for the first time in 2007 and the vast majority of listed companies started to disclose their R&D information in 2007 (Zhu & Kang, 2022), our sample period is from 2007 to 2016. Firm information is extracted from the CSMAR.
We further selected family firms. Firms are identified as family firms if both criteria are met (Arregle et al., 2017): (1) the actual controller (i.e. the largest shareholder via both direct and indirect shareholding) is a family or a family member, and (2) family members hold management positions in the firm. Specifically, we follow the method of Li et al. (2022), searching for and cross-confirming kinship amongst family members: (1) reading annual reports, prospectuses, listing announcements, descriptions of shareholder relationships or concerted actions, shareholdings of the top ten shareholders and the relationship disclosed in the resumes of executives; and (2) for unknown kinship amongst the board of directors, board of supervisors and senior management team members, we conducted a web search on Google and Baidu to identify kinship. Intergenerational relationships amongst family members were further clarified on the basis of kinship.
Because this study focuses on intergenerational power gap, we only included firms in which both first- and second-generation family members hold a management position in the business. Specifically, we used the founder of a firm as the representative of the first generation because of the deep influence of the founder on a family firm. Furthermore, because adoption is uncommon and blood ties are indispensable in Chinese culture, we required second-generation family members to be the founder's biological children. Consequently, only family firms in which both the founder and their biological son or daughter were involved were included in our sample.
We drew on the sample screening process of Li et al., 2022: (1) remove companies in the financial industry, and (2) remove companies with more than 50% missing R&D investment data. We crosschecked and supplemented suspicious or missing data using the Wind database. The final sample was an unbalanced panel consisting of 320 family-owned public companies and 1655 firm-year observations from 2007 to 2016. We examined the sample representativeness in terms of market capitalisation. The average ratio of the sample market cap to the entire market cap is 3.54% throughout the sample period and exhibited an increasing trend, consistent with the current situation and development history of private family enterprises in China. Table 1 presents the sample distribution by year and industry.
Distribution of sample family firms.
| Panel B:Sample distribution by industry | ||
|---|---|---|
| Number of firms | Proportion | |
| A | 41 | 2.48% |
| B | 3 | 0.18% |
| C | 1435 | 86.71% |
| D | 17 | 1.03% |
| E | 24 | 1.45% |
| F | 19 | 1.15% |
| G | 21 | 1.27% |
| I | 55 | 3.32% |
| K | 16 | 0.97% |
| M | 17 | 1.03% |
| R | 7 | 0.42% |
Notes: Letters refer to the industries in the Guidelines for the Classification of Listed Companies published by the China Securities Regulatory Commission: A—Agriculture, Forestry, Animal Husbandry, Fishery; B—Mining; C—Manufacturing; D—Electricity, Heat, Gas and Water Production and Supply E—Construction; F—Wholesale and retail; G—Transportation, warehousing and postal services; I—Information transmission, software and information technology services; K—Real estate; M—Scientific research and technical services; R—Culture, sports and entertainment.
The dependant variable, R&D investment (R&D), is measured by the ratio of R&D expenditure to revenue. This measure is commonly used in innovation research and a more robust measure of R&D investment compared to absolute R&D spending (Duran et al., 2016).
The key independent variable is intergenerational power gap (Ipg). We followed a three-step procedure to calculate intergenerational power gap. First, we determined a representative of the first and second generations. We used the founder of a firm as a representative of the first generation. The biological son or daughter of the founder, who holds a management position in the family firm, represents the second generation. When there are multiple biological children in the firm, we chose the eldest son to represent the second generation because Chinese families usually follow a concentrically patriarchal structure (Fei, 1985), and the eldest son is most likely to take over the business, given his inheritance priority and the family responsibility. Next, we determined the positions held by the first and second generations according to the historical lists of the board of directors, management team and board of supervisors. Finally, we assigned a score to each position following He and Lian's (2009) managerial position ranking scores of 15 positions.1 Intergenerational power gap is calculated as the difference between the position scores of the second and first generations. A large value indicates that the second generation has higher management autonomy and freedom of action relative to the first generation.
Regarding the moderating effect, we first measured institutional ownership with the ratio of institutional shareholdings to shares outstanding (Inown), following Fernando et al. (2014). The larger the value of this indicator, the stronger is the motivation of institutional investors to hold shares for a long time, and the stronger is their influence on the decision making of the second generation and family business. In addition, to examine the moderating effect of industry type, we divided the sample firms into high-tech industries and traditional industries according to Measures for Administration of Accreditation of New and Hi-tech Enterprises issued by the Ministry of Science and Technology, the Ministry of Finance and the State Administration of Taxation in 2008 (hereinafter referred to as Measures). According to Measures, high-tech industries include electronic and information technologies, biology and new medicinal technologies, aviation and astronautic technologies, new materials, high-tech services, new energy and energy conservation technologies, resources and environmental technologies and advanced manufacturing and automation. Tech is a dichotomous variable equal to 1 if the firm is in a high-tech industry and 0 otherwise.
We also control for a series of variables following previous family business innovation studies. Firm size (Size) and firm age (Age) account for legitimacy, scale and other factors that may affect the acquisition or supply of R&D resources (Chen & Hsu, 2009; Li et al., 2022). The leverage ratio (Lev) represents the adequacy of a firm's financial resources and supply of internal funds that can be used for R&D. Two governance structure variables, the proportion of family shareholding (Fown) and the proportion of independent directors (Indir), capture the degree to which the firm is risk-averse. A high proportion of family shareholding or independent directors is not conducive to R&D investment (Chen & Hsu, 2009; Li et al., 2022). Finally, research based on the resource acquisition and signalling theory suggests that government subsidies can promote corporate R&D (Deng et al., 2019). However, government subsidies can also have a crowding-out effect on R&D investment (Busom, 2000). To isolate the impact of external government subsidies on corporate R&D investment, we control for government subsidies (Sub). The variable definitions are summarised in Table 2.
Variable definition and description.
The mean, standard deviation and correlation coefficient of the variables are shown in Table 3. All continuous variables were winsorised at the top and bottom 5% to mitigate the influence of extreme values. The average R&D investment is 3.21% and the average intergenerational power gap between the second and first generations is 0.15, indicating that the second generation has a greater influence than the first generation in family-owned businesses, but the difference is relatively small. The average family and institutional ownership were 35.06% and 29.18%, respectively. High-tech firms account for only 32% of the sample, consistent with the view that the majority of family businesses are in the traditional manufacturing industry (Li et al., 2022). In addition, the average age of the firms is 15.31 years. The average leverage ratio was 29%, and independent directors accounted for 34.53% of the directors on the board. This is consistent with the China Securities Regulatory Commission's requirement that the board of directors of listed companies include at least one-third of independent directors.
Descriptive statistics and correlation.
Notes: ***, **, and * indicate significance at the 1%, 5%, and 10% levels, respectively. N = 1655. R&D—Research and development; Ipg—Intergenerational power gap; Inown—Institutional ownership; Tech—Industry type; Size—Firm size; Age—Firm age; Lev—Leverage; Fown—Family ownership; Indir—Proportion of independent directors; Sub—Government subsidies.
The correlation results suggest that the intergenerational power gap is negatively correlated with R&D investment. Specifically, when the influence of the second generation increases compared to that of the first generation, the strength of R&D investment decreases in family businesses. R&D investment is higher for firms in high-tech industries, consistent with previous research (Li et al., 2022; Yin & Sheng, 2019). A negative correlation between R&D investment and firm size, leverage ratio and family ownership has also been documented in the literature (Chen & Hsu, 2009; Li et al., 2022).
Hypothesis testing
First, we examined the impact of intergenerational power gap on R&D investment in family firms. Because R&D investment is non-negative, we adopted the Tobit regression model to account for censored data (Li et al., 2022). Specifically, we estimated the following equation:
where R&Dit is R&D expenditure as a percentage of revenue and Ipgit is intergenerational power gap. The model includes all the control variables described in Table 2. Year, industry and firm fixed effects were also included. In the case of multicollinearity, we examined the variance inflation factor (VIF) for all regression models. No VIF greater than 10 was observed, suggesting that multicollinearity is unlikely to be a significant problem.
The regression results are presented in Table 4 Model 1. The estimated coefficient of intergenerational power gap is −0.15, which indicates that firms with relatively high-power second-generation family members have lower R&D investment. Thus, Hypothesis 1 is supported.
Intergenerational power gap and R&D investment.
Notes: ***, **, and * indicate significance at the 1%, 5%, and 10% levels, respectively. R&D—Research and development; Ipg—Intergenerational power gap; Inown—Institutional ownership; Tech—Industry type; Size—Firm size; Age—Firm age; Lev—Leverage; Fown—Family ownership; Indir—Proportion of independent directors; Sub—Government subsidies.
To examine the moderating effect of institutional ownership and industry type, we estimated the following models:
where Inownit and Techit represent the percentage of institutional ownership and high-tech dummy, respectively. The results are presented in Tables 4 Model 2 and Model 3. In Model 2, the coefficient of the interaction term is 0.27, indicating that an increase in institutional investor shareholding can weaken the negative impact of the increased intergenerational power gap on R&D investment. Thus, Hypothesis 2 is supported. In Model 3, the estimated coefficient of the interaction between Ipg and Tech is 0.34, which implies that the negative impact of the intergenerational power gap on R&D investment is alleviated in the high-tech industry. H3 is supported.Endogeneity

The results in Table 4 show that the increased power gap between generations has a significantly negative impact on family businesses’ R&D investment. However, intergenerational succession in family businesses is affected by unobserved internal and external factors. Therefore, the power transition between the first and second generations can be endogenous (Zhao et al., 2020). To mitigate endogeneity concerns, we adopted a two-stage least squares (2SLS) model.
Zhu and Kang (2022) recommended using founder age as the instrumental variable for second-generation involvement. In general, the older the founder, the more likely is the family business to a second generation involved, leading to a larger intergenerational power gap. However, founder age is not likely to correlate with corporate innovation.
Table 5 reports the estimated results of the 2SLS model. The regression results of the first stage show that founder age is significantly and positively correlated with the intergenerational power gap, indicating that founder age affects the intergenerational succession process. The regression results of the second stage show that Ipg is significantly and negatively correlated with R&D investment, suggesting that the negative impact of intergenerational power gap on R&D investment is still significant when endogeneity is considered. Therefore, the results of 2SLS model are qualitatively similar to Tobit regression results.
Two-stage least squares model.
Notes: ***, **, and * indicate significance at the 1%, 5%, and 10% levels, respectively. R&D—Research and development; Ipg—Intergenerational power gap; FounderAge—The age of the founder; Inown—Institutional ownership; Tech—Industry type; Size—Firm size; Age—Firm age; Lev—Leverage; Fown—Family ownership; Indir—Proportion of independent directors; Sub—Government subsidies.
Existing research does not have a consistent indicator of R&D investment, and common measures include the ratio of annual R&D expenditure to revenue, the annual R&D expenditure to asset ratio and the ratio of R&D personnel to the total workforce (Duran et al., 2016). We used the ratio of R&D expenditure to assets as an alternative measure of R&D investment and the rerun models in Table 4. The results are presented in Table 6. The regression coefficient of intergenerational power gap in Model 4 is −0.11 and significant at the 5% level, indicating that high intergenerational power gap adversely affects R&D investment. Model 5 examined the moderating effects of institutional ownership. The results show that the coefficient of the interaction term is 0.15 and significant, suggesting that the negative effect of the intergenerational power gap on R&D investment weakens when institutional ownership is high. Thus, Hypothesis 2 is supported.
Regressions with alternative R&D investment measure.
Notes: ***, **, and * indicate significance at the 1%, 5%, and 10% levels, respectively. R&D—Research and development; Ipg—Intergenerational power gap; Inown—Institutional ownership; Tech—Industry type; Size—Firm size; Age—Firm age; Lev—Leverage; Fown—Family ownership; Indir—Proportion of independent directors; Sub—Government subsidies.
We examined the moderating effect of industry type in Model 6, and the results suggest that the coefficient of the interaction between Ipg and Tech is 0.27, which implies that the negative impact of the increase in the intergenerational power gap on R&D investment is alleviated in the high-tech industry. In summary, the results based on the alternative R&D measure are qualitatively unaltered from the baseline results reported in Table 4. Our conclusions are robust to different R&D investment measure selection.
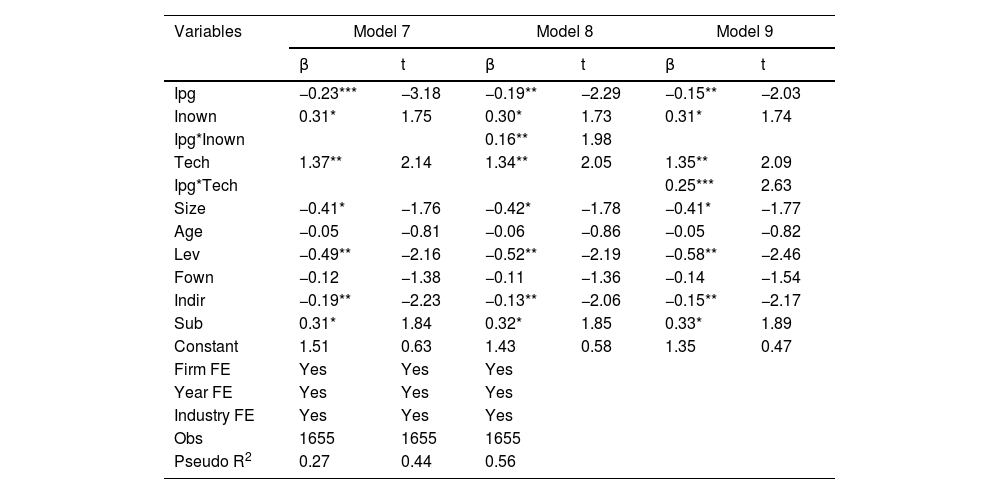
Alternative position ranking scoresTo avoid the numerical nature of the ranking scores assigned by He and Lian (2009), we focused on the ordinal nature of different management positions in family firms by assigning 1 to 15 to the 15 managerial positions (i.e. the highest score, 15, is assigned to the most important position, chairman and general manager, and the lowest score, 1, is assigned to the least important position member of the board of supervisors/employee supervisor). The difference between the second generation's and the first generation's scores is used as an alternative measure of the intergenerational power gap.
Table 7 reports the regression results corresponding to Table 4. The results of Model 7 show that intergenerational power gap has a significant negative impact on corporate R&D investment (β=0.23, p<1%). The moderating effects of institutional ownership (β=0.16, p<5%) and industry type (β=0.25, p<1%) are also found significant in Model 8 and Model 9, respectively. It suggests that our results are robust to various selections of position ranking scores, which further illustrates the robustness of the conclusions of this paper.
Alternative measure of intergenerational power gap.
Notes: ***, **, and * indicate significance at the 1%, 5%, and 10% levels, respectively. R&D—Research and development; Ipg—Intergenerational power gap; Inown—Institutional ownership; Tech—Industry type; Size—Firm size; Age—Firm age; Lev—Leverage; Fown—Family ownership; Indir—Proportion of independent directors; Sub—Government subsidies.
China is currently in a critical period of economic transformation. The era of participating in market competition via the advantages of low labour costs, low product prices and the sacrifice of resources and the environment has passed, and the demand for innovation in economic development has become increasingly urgent (Li et al., 2022). As a pivotal force in the Chinese economy, family businesses are experiencing a peak period of intergenerational succession. Therefore, consistency in innovation strategies in the intergenerational succession process has become an important and urgent problem.
Based on the attention-based view, we used a sample of Chinese listed family firms from 2007 to 2016 to study how intergenerational power gap affects the focus and attention configuration of the second generation and, in turn, impacts corporate R&D investment. We found that intergenerational power gap between generations has a significantly negative impact on corporate R&D investment. Further, we found that the negative impact is less salient when firms are characterised by a high proportion of institutional ownership or a high-tech nature. These results suggest that in the process of intergenerational succession, a series of challenges, such as the lack of legitimacy, the pressure to keep business thriving and the potential performance dilemma, will make the second generation pay more attention to short-term projects with low risk and low investment rather than increasing investment in R&D. Meanwhile, an increase in institutional ownership and the characteristics of high-tech industries will help the second generation shift its attention to long-term projects, such as R&D, and promote an increase in R&D investment.
The contributions of this study are as follows: First, previous studies have documented that the second generation is more conducive to a firm's innovation. However, many factors that may inhibit the second generation's innovation intention are overlooked, leaving the question of why family descendants are more inclined to reduce R&D investment unanswered (Cucculelli et al., 2016; Duran et al., 2016). In addition, according to the Report on the Status of Young Generation of Chinese Family Enterprises issued by the Family Business Committee of the China Private Economic Research Association in 2017, there is no significant difference between younger and older generation entrepreneurs in terms of their attitude toward internal product quality and technological innovation. In fact, longer education experience and overseas experience do not generate a greater sense of innovation. Therefore, whether or not the second generation is more innovative requires further investigation. To address this question, we selected family business succession as the research setting to explore how an increased intergenerational power gap affects corporate R&D investment. The results suggest that in studies of the second generation's innovation, we should pay attention to the impact of specific factors on the emotional, psychological and cognitive aspects of the second generation. Second, existing research on intergenerational power gap mainly focuses on managers in the general sense of business organisation (Krause et al., 2015). However, the issue of power in family businesses is a research field far from being explored (Ucbasaran, 2018). Therefore, based on a special period of power transition, namely, intergenerational succession, we provide empirical evidence of the mechanism through which intergenerational power gap affects R&D investment in family businesses. Finally, extant studies on the intergenerational power gap mainly focus on its impact on executive compensation, employee behaviour and team performance (Krause et al., 2015). However, their relationship with corporate innovation strategy implementation, such as R&D investment, has rarely been explored. This study provides evidence for this hypothesis.
However, our results should be interpreted with caution due to several limitations. First, we eliminated listed firms that do not disclose R&D investment information, a self-selection issue. This self-selection process may alter the conclusions of this study (Saemundsson et al., 2022). Moreover, because the history of listed family firms in China is short, many have not yet entered the succession process. Therefore, our sample is relatively small and consists of the first generation of family firms, leading to a generalisability issue (Zhu & Kang, 2022). Future studies should procure larger samples to provide richer and more robust conclusions.
This research was sponsored by the Major Project of National Social Science Fund of China (No.: 19ZDA078), Key Specialized Research and Development Breakthrough (Soft Science) Program of Henan Province (No.: 222400410163), Social Science Innovation Team of Henan Province (No.: 2022CXTD03), the Fundamental Research Funds for the Central Universities (No.: 63222054), and Improvement Plan for Young Faculty' Research and Innovation Abilities of Beijing University of Agriculture (No.: QJKC2022040).
The method used by He and Lian (2009) is described below: i. The authors identified 15 management positions in Chinese listed family firms: (1) chairman and general manager, (2) chairman and another position, (3) general manager and another position, (4) vice chairman and vice general manager, (5) chairman, (6) vice chairman, (7) board member, (8) general manager/president, (9) vice general manager/vice president, (10) finance director, (11) sales director, (12) human resources or other functional department director, (13) member of the board of supervisors/employee supervisor, (14) chairman of the board of supervisors and (15) board secretary. ii. The authors surveyed Chinese private entrepreneurs and asked them to rank these 15 positions based on the degree of importance with a 7-point Likert scale. iii. Based on 167 questionnaires, the authors first calculated the average scores of all 15 positions and then used the ratio of the average scores to the largest point in the scale (i.e. 7) as the management position ranking score. All scores listed from high to low are: chairman and general manager (0.982), chairman and another position (0.936), chairman (0.930), general manager and another position (0.905), general manager/president (0.832), vice chairman and vice general manager (0.829), vice chairman (0.809), sales director (0.753), finance director (0.746), vice general manager/vice president (0.740), board member (0.706), human resources or other functional department director (0.656), board secretary (0.649), chairman of the board of supervisors (0.635), member of the board of supervisors/employee supervisor (0.542).