


The digital environment, which includes the Internet and social networks, is propitious for digital marketing. However, the collection, filtering and analysis of the enormous, constant flow of information on social networks is a major challenge for both academics and practitioners. The aim of this research is to assist the process of filtering the personal information provided by users when registering online, and to determine which user profiles lie the most, and why. This entailed conducting three different studies. Study 1 estimates the percentage of Spanish users by stated sex and generation who lie the most when registering their personal data by analysing a database of 5,534,702 participants in online sweepstakes and quizzes using a combination of error detection algorithms, and a test of differences in proportions to measure the profiles of the most fraudulent users. Estimates show that some user profiles are more inclined to make mistakes and others to forge data intentionally, the latter being the majority. The groups that are most likely to supply incorrect data are older men and younger women. Study 2 explores the main motivations for intentionally providing false information, and finds that the most common reasons are related to amusement, such as playing pranks, and lack of faith in the company's data privacy and security measures. These results will enable academics and companies to improve mechanisms to filter out cheaters and avoid including them in their databases.
As social media spreads, more and more people are using it to seek, consume and exchange information (Shu et al., 2017), resulting in the generation of a massive amount of data (Kapoor et al., 2018). The reason behind this trend lies in the very nature of social media, as it allows for more timely, easier and less costly consumption and dissemination of information than traditional news media (Shu et al., 2017). This environment is propitious for digital marketing to understand new forms of online consumer behaviour and to promote and sell its products (Kumar et al., 2016). Consumers can be analysed and segmented by referring to information about their demographic characteristics, consumption habits, etc., which can be captured from social networks (e.g. Instagram, Facebook, Twitter, TikTok, Pinterest, Snapchat, etc.) in order to generate leads. This can be done in a variety of ways, ranging from the publication of advertisements, participation in social networks, joining conversations, and creating online contests and sweepstakes (Desai, 2019). However, the information that users provide is not always correct. Many people take advantage of the anonymity offered by social networks to falsify their information, and to act in a dishonest manner (Allcott & Gentzkow, 2017; Bonald et al., 2009; Vosoughi et al., 2018; Wu et al., 2022).
A cheater is someone who participates in a game but breaks the rules in order to gain an advantage. In other words, s/he wants to join in, but is not willing to play fair (Cosmides & Tooby, 2016). Since ancient times, cheating has been a perplexing problem for society and has been an especially huge obstacle for businesses (Cosmides & Tooby, 2016). One form of cheating is to provide false information about oneself by misrepresenting or impersonating another person (Lwin et al., 2016). Although the problems that this causes are recognised, little is known about the profiles of users who are most inclined to do so (Axelrod & Hamilton, 1981; Di Domenico et al., 2020). In the digital marketing environment, where strategies depend on the provision of truthful, accurate information about consumers, it is essential to detect users who enter false information in order to remove them from databases (Blackburn et al., 2014; Cosmides & Tooby, 2016; Pascual-Ezama at al., 2020). Knowledge about the user profiles that are more likely to misrepresent their data could help to refine detection methods and eliminate/reduce fraudulent practices (Ahmed, 2009). The incorporation of this information into artificial intelligence and machine learning algorithms that sift information could help improve their performance (Saura, 2021; Zhang et al., 2020).
The global market for collection, storage and distribution of digital marketing-related data was worth nearly $17.7 billion in 2021, with the US being the largest market, accounting for 47% of the global value, around $24.7 billion. In Spain, digital advertising amounted to €3.03 billion in 2020 and the country is among the top ten in Europe with the highest spending in this area, with a figure that surpasses that for traditional advertising.
Digital marketers need accurate sources of data on potential consumers to target and optimise their marketing investments (Lee et al., 2012). Therefore, it is essential for organizations that build databases from social media to eliminate as much pollution by fraudulent users as possible. The literature on social media marketing has focused more on data collection related to web traffic, on user engagement with each other and with the company or brand, than on the motivations or profiling of digital fraudsters (Chambers et al., 2010). Certain studies have analysed the social and psychological motivations that lead consumers to provide their information online (Balint et al., 2011; Fritsch et al.,2006), but fewer have focused on detecting the profiles of those who lie. One exception is Nazir et al. (2010), which analysed behaviour with false accounts used to play Facebook games. It found that users’ main motivation for providing inaccurate personal data was to gain what they believed to be an advantage in the game, but the study did not profile these users.
One study that analysed a larger number of cases of cheating was carried out by Blackburn et al. (2014). These authors examined the cheaters flagged in an online game, finding that their number is not correlated with population density or the size of the game community. However, they did not provide information on cheaters' profiles, such as their age or sex, or the fields in which they were most likely to lie, although they do suggest that the costs of cheating are extremely significant, especially those to the industry as it seeks to detect and reduce the practice.
This paper aims to contribute by identifying the motivations and profiles of users who provide false data on the Internet. To this end, we requested the collaboration of one of the top lead generation companies in Europe, which has been operating in Spain since 2009. This company allowed us to study certain pieces of information from its database, which we used to estimate the amount of fraudulent data and to characterise cheaters by stated sex and age. We also sought to learn about their motivations for supplying false information. The data generation industry is particularly sensitive and exposed to cheaters, so early detection is critical to prevent them from contaminating the databases that will subsequently be used by companies to offer their products and services. In addition, good quality databases help to target commercial activity better, and generate greater acceptance, engagement and brand loyalty (Menon et al., 2019).
This study analyses the characteristics of users who have provided false information on the lead generation company's web pages, in order to fill the following gaps in the literature:
- –
detection of false information using AI algorithms and, in turn, the users who entered false information
- –
determination of whether users who entered false information did so intentionally or negligently
- –
examination of the fields where cheaters have entered the most false information
- –
characterisation by stated sex and generation of users who falsify their data the most, in order to incorporate these profiles into prediction algorithms, and
- –
understanding of the main motivations for intentionally providing false information.
To our knowledge, no previous work in the literature has analysed users’ profiles and their motivations to enter false information when participating in online sweepstakes and quizzes with the aim of facilitating automatic detection of cheaters on social media. This research adopts a mixed-method approach that combines descriptive and exploratory research. For the descriptive research, we benefited from collaboration with the lead generation company CoRegistros, S.L.U., which provided us with several fields of a database of more than 5 million users.
The rest of the paper is organised as follows. First, a conceptual framework is presented focusing on the profiles of users who enter inaccurate personal data online and their motivations for doing so. Second, the methods and results of the two studies on which this research is based are presented. Following a discussion of the results, the implications for academia and management are addressed. The study concludes by proposing the key themes that emerged from the results, discussing its limitations, and suggesting certain avenues for future research.
Theoretical frameworkDefinition and types of fake information created by cheatersAlthough the concept of fake news originated in the 15th century (Shu et al., 2017), that of online misinformation was coined six centuries later, in the early 21th century, to refer to a series of untruthful news stories and announcements generated and disseminated by websites (Mintz, 2002; Wendling, 2018) that affect most social domains (Allcott & Gentzkow, 2017; Fonseca & Borges-Tiago, 2021). When information hits the web, cheaters, under protection of the anonymity afforded by the online environment, manipulate that information and re-distribute it, generating false content (Allcott & Gentzkow, 2017). Here, it is important to distinguish between misinformation and disinformation, as some studies have used them indiscriminately (Zubiaga et al. 2018). The terms have different meanings, for while misinformation refers to communications whose veracity is not yet confirmed and may or may not contain false information, disinformation involves deliberate manipulation to give the impression that the content is true (Tandoc et al., 2018). That is, while the former concerns the authenticity of the information, the latter implies intentionality (Shu et al., 2017).
This generation of misinformation, its ontology, detection methods and the motivations behind it have aroused much interest in the scientific community, which has carried out several studies to improve our understanding of the phenomenon. There have been studies such as the one by Habib et al. (2019), which endeavoured to classify misinformation into rumours, fake news, disinformation and hoaxes, and also described their characteristics to facilitate their detection and prevent cheating. Meanwhile, Tandoc et al. (2018) sought to categorise the purposes of false information that is disseminated online into satire, parody, political propaganda, advertising and manipulation.
Automated processes of online information dissemination are changing and increasingly attractive headlines and very limited and short-lived content are becoming more and more common, making manual monitoring impossible and thus favouring proliferation of fake news and the detection of cheaters (Conroy et al., 2015). Although online misinformation is a recent phenomenon, some authors propose the adaptation of methods described in earlier literature to the detection of cheaters in different fields of application. Examples include Conroy et al. (2015), Parikh and Atrey (2018) and Shu et al. (2017), who focus on the automatic detection of false information once it has been generated, while others such as Zubiaga et al. (2018) address the problem more holistically, rather than merely detecting it once it has been produced. Along similar lines, Bondielli and Marcelloni (2019) approach false information from its origin, i.e. in terms of data sources and the way in which information is captured. Regardless of how cheaters are detected, all these methodologies recognise that they entail certain limitations and that they need to recurrently train their algorithms by means of behavioural and socio-demographic data.
Profiling types of errors: accidental or intentionalSince misinformation can be generated by accident, it is important to detect whether or not there is any malicious intent behind its creation (Pennycook et al., 2021). To reduce the likelihood of error, it is proposed that robust protocols should be used to control the way that users complete registration forms (Karlova & Fisher, 2013). For example, they might be asked to enter the same data more than once, without being able to see what they typed previously, and the submission is only accepted if both entries match (Fallis, 2014). But these procedures are unable to prevent users from intentionally entering false data (Karlova & Fisher, 2013). For example, if a user gives his/her name as "Fool", and the system asks him/her to repeat it, s/he will do the same thing again. But if the algorithm detects that the word "Fool" is incorrect and lets him/her know, s/he is likely to use a fake, but apparently real, name on the second try, which is much harder to detect. It is therefore important to distinguish whether false data is provided due to error, misinformation, or where this is done intentionally, disinformation, and also to know which kinds of users are more likely to do so. In the former case, to improve the robustness of online forms, and, in the latter, in order to control and isolate such practices (Karlova & Fisher, 2013). Thus, the following research question is proposed:
RQ1. Are errors mainly produced accidentally, generating misinformation, or intentionally, generating disinformation, when filling in personal data online?
Digital marketing often uses databases that gather information from potential consumers (leads) in order to target commercial offers better, and one way to create these databases is through lead generation (Desai, 2019). In the past, leads were acquired by making phone calls, usually without the respondent's authorisation or consent, but nowadays such processes are largely carried out through digital channels (Rothman, 2014) where the user gives their consent under a regulated framework (Spanish Data Protection Agency, 2022).
There are several ways to generate online leads, such as offering interesting content on blogs or websites (Bondarenko et al., 2019), electronic requests made by social activists (Huang et al., 2015), offering financial incentives such as prize draws or direct product discounts, or revealing the answers to a quiz in exchange for the user's data. Another technique is snowballing, which consists of users winning rewards in exchange for recruiting friends and acquaintances, whose information thus becomes available to the company too (Baltar & Brunet, 2012). These all follow the principle of the social contract (Cosmides & Tooby, 2016), whereby participants are given the chance to win a prize (e.g. an iPhone, a gift voucher, a trip, etc.) or some kind of emotional reward, for getting the answers right to a quiz, test or challenge, in exchange for providing personal information.
However, the information provided by participants often contains errors, and checks need to be performed to safeguard the quality of the database. This essentially involves input control and screening of the provided information. Robust data entry procedures are often used for the former, while the latter uses algorithms to detect patterns in transcription errors (incorrect names, missing phone numbers, etc.) regardless of whether they are accidental or intentionally malicious (Thakur et al., 2017).
However, despite the importance of detecting the profiles and patterns of false registrations and, consequently, cheaters, no previous studies have been found that have considered the declared sex and/or age of participants that create false profiles (Perez-Escoda et al., 2021). Some, such as Sharif and Zhang (2014), did identify the main ways in which consumers could mislead and deceive on social media and how such deception can be detected. Others such as Viviani and Pasi (2017) identified and quantified a user's credibility when entering information on social media, while Conroy et al. (2015) demonstrated that some techniques are more effective than others in detecting online deception and identifying fraudsters. Although previous studies have addressed different aspects of the problem (Conroy et al., 2015; Habib et al., 2019; Parikh & Atrey, 2018; Shu et al., 2017; Viviani & Pasi, 2017; Zubiaga et al., 2018), they all highlight the need to create control mechanisms to ensure the quality of databases, and to use the knowledge extracted from them to compare approaches and profile cheaters better.
Profiling cheaters based on their generation and declared sexGenerational cohort marketing, first defined in the US at the turn of the last century, is still being used in marketing around the world (Meredith & Schewe, 1994). Cohorts are groups of individuals who are born around the same time and experience external events in a similar manner in their late teenage/early adult years. These "defining moments" influence their values, references, attitudes and purchasing behaviour in ways that persist throughout their lives (Meredith & Schewe, 1994). The experiences shared during the highly impressionable "coming of age" period [approximately 17-23 years of age] embody these values or "cohort effects" and remain relatively unchanged throughout life. Each generation is defined by its birth years and typically lasts 20 to 25 years, or about as long as it takes to grow up and have children. But a cohort can be as long or short as the external events that define it. Thus, the cohort defined by World War II might only be 6 years long (Meredith & Schewe, 1994). Schuman and Scott (1989) demonstrated that individuals of similar age have similar memories, related mainly to adolescence and young adulthood, and common experiences of major events, which they refer to throughout their lives. These characteristics mean that each cohort is a separate market segment and it can be particularly useful for marketing campaigns to target them in specific ways. In the US, seven distinct cohorts have been delineated as internally homogeneous in values yet heterogeneous across cohort groups. The most widespread classification of generational cohorts is usually: Silent Generation (also known as Mature, born between 1925 and 1942), Baby Boomers (born between 1943 and 1960), Generation X (born between 1961 and 1981), Millennial Generation (often referred to as Generation Y or Millennials, born between 1982 and 2000) (Brosdahl & Carpenter, 2011) and Generation Z (born between 2001 and 2009) (Yadav & Rai, 2017).
While there is growing interest in understanding the use of social media by different generations (Bolton et al., 2013), little is known about which generations cheat the most. Thus, the following research question is proposed:
RQ2. Are there generational differences when entering incorrect personal data?
Another of the most common variables in marketing segmentation is the declared sex of users (Nickel et al., 2020). Consumers have often been classified according to stated sex in order to optimise product design, as well as to create targeted communication and advertising campaigns (Meyers-Levy et al., 2015). The selectivity hypothesis is based on using declared sex as a basic criterion to segment the market between male and female products (Moss, 2009). This theory suggests that most people who claim to be of certain sexes report different preferences and tastes and react differently to commercial stimuli (Nickel et al., 2020). Although there is abundant literature on the different attitudes of men and women towards new technologies and internet use (Alalwan et al., 2017) and even on their attitudes towards sweepstakes in the face of different types of stimuli and incentives (Schulten & Rauch, 2015), there is no evidence of studies that analyse sex differences among cheaters when entering personal data online. Therefore, the following research question is proposed:
RQ3. Are there any differences with regard to declared sex when entering incorrect personal data?
Although the instruments for collecting leads follow the logic of the social contract, in which financial and emotional incentives are offered in exchange for information, not everyone is willing to comply (Cosmides & Tooby, 2016). Previous studies have attempted to find the motivations for the generation of disinformation, and lack of understanding about the need to provide personal data, as well as privacy and security concerns, are cited as the main reasons (Sannon et al., 2018). One of the ways to conceal information is the use of pseudonyms, whereby the participant can not only hide his/her identity, but might also impersonate someone else either for fun or as a joke, or for criminal reasons (harassment). Find that amusement is the main motivation for supplying false information. Also, when companies request a large amount of information this can generate distrust, and Keusch et al. (2019) showed that users feel more confident if data collection is limited to the minimum necessary and, moreover, if data protection rules are clearly explained. Although financial incentives also help, they are not completely decisive (Keusch et al., 2019). Other authors, such as Sullivan et al. (2019), find that clearly describing the purpose of requesting information helps to prevent users from worrying that their privacy might be in jeopardy. Based on the evidence gathered, this study poses the following research question:
RQ4. What are the main motivations for intentionally entering incorrect online data, i.e. to generate disinformation?
To address the research questions, this study has used triangulation, which is the combination of different methods to study the same phenomenon (Denzin, 1978). We used three methodologies in our two studies: Study 1 is quantitative and descriptive, and is used to estimate the volume of cheaters by stated sex and cohort of the database made up of the information provided by volunteer participants in online sweepstakes and tests. Meanwhile, Study 2 is mixed, combining qualitative exploratory research (2a) and quantitative descriptive research (2b), to determine the weight of the main motivators declared in Study 2a. Specifically, Study 1 used AI algorithms to estimate the amount of erroneous and falsified data in a sample provided by the lead generation company of 5,534,702 participants in online sweepstakes and quizzes between 2010 and 2021. Study 2 aimed to explore and estimate the main motivators for intentionally falsifying data provided to sweepstake sponsors. To this end, in the first stage, the exploratory Study 2a consisted of 33 in-depth interviews with participants to enquire about the main motivators for falsifying data and, in the second stage, the descriptive Study 2b used a choice-based conjoint analysis methodology with a sample of 269 participants to estimate the weight of the factors revealed in the first stage.
Study 1In order to build a profile of cheaters, a descriptive analysis was proposed of certain fields of the database provided by the lead generation company after signing a confidentiality agreement. This database contains information provided by participants in sweepstakes (96%) and self-assessment quizzes (intelligence, geography, cooking, etc.) (4%) over a period of eleven years, from 2010 to 2021, and was collected through the use of landing pages (Fig. 1 shows an example) that offer the possibility of winning an iPhone in exchange for the participant providing personal information. Other examples of landing pages can be found on the company's own websites (https://www.sorteopremios.com, https://www.mitest.de).

On average, each user takes 3 minutes and 47 seconds to enter his/her data. To comply with the European Data Protection Regulation and the respective Spanish legislation, LOPD-RGPD, "Ley Orgánica 3/2018, de 5 de diciembre, de Protección de Datos Personales y Garantía de Los Derechos Digitales" (2018), all users accessing the landing page were previously informed. They also had to opt-in by checking the consent box to agree to the different purposes for which their data was collected, declare that they were over 18 years old, confirm that they had read and accepted the entry conditions and data protection policy, and agree to receive commercial information from the sponsors.
Participation in the company's sweepstakes or quizzes does not entail any entry barrier, as the only requirement is to be over 18 years old and have an Internet connection, this latter requirement being met by more than 90% of the Spanish population (INE, 2020). The company has 5,534,702 registered users and it provided us with information on their names and surnames, emails, telephone numbers, and declared sex and ages. Data from users who did not declare their sex was not included in this study as there were only 55 such cases, amounting to just 0.001%. All users said they were of legal age and Spanish.
Based on their stated sex and age, the sample was divided into women and men, and into five generational cohorts: Silent Generation, Baby Boomers, Generation X, Millennials and Generation Z. The sample is somewhat asymmetrical, as there are more women, 65%, than men, 35%. The distribution of the cohorts is also heterogeneous, although all subsamples are representative (Rao et al., 2021). Generation X (52%) is the most highly represented, followed by Millennials (40%), Baby Boomers (7%), Silent Generation (0.8%) and, finally, Generation Z (0.2%). Furthermore, in all cohorts, except for the Silent Generation, the relative frequency of women was almost double that of men.
MeasuresDifferent procedures were followed to estimate the number of errors made unintentionally, misinformation, and intentionally, disinformation, in each of the available fields of the database. These ranged from developing a debugging algorithm for name and surname, to comparisons with official databases, verifications by means of chatbots, and automatic forwarding to registered email addresses. With all these tracking and control mechanisms, estimates of the amount of fraudulently entered data could be calculated.
Starting with the name and surname records, a debugging algorithm was developed from Node.js®, with which JavaScript is used to write command line tools (Escobar-Jeria et al., 2007). This algorithm, which we cannot publish for copyright reasons, compares all the names and surnames registered by users who played sweepstakes and self-assessment quizzes with those in the databases of the repository of the National Statistics Institute and the IDA-Padrón, and detects all those words that do not match Spanish names and/or surnames or which appear fewer than 20 times in the country (or 5 per province). Once all records of suspicious names and surnames had been detected, an algorithm was applied to them to detect typographical errors, which are considered unintentional, while all other unusual names and surnames were considered fraudulent. In addition, to estimate the goodness of fit of the distribution of fraudulent names (Chi-square test), this was compared to the distribution of names in the company's standardised tables and blacklists. Subsequently, this frequency distribution of unusual names was incorporated into the algorithm as a contribution to machine learning. This means that the name registration software will not allow users to register names that have previously been identified as fraudulent.
Regarding the telephone number and e-mail address fields, the registration system is double-entry, which prevents typographical errors. Hence all errors made when entering this information were considered fraudulent. In order to detect bogus telephone numbers, even when they present a valid format according to the Spanish National Commission for Markets and Competition (2021), interactive voice response (IVR) systems were used (Dillman et al., 2009). Call control samples were carried out automatically, by means of chatbots, and manually (control calls) to confirm that the supplied data exists and is valid.
Finally, for email address registration, verification simply consisted of sending automated messages and checking whether they were opened, click rates and other metrics. The bounce rate was measured to estimate fraudulent email addresses, aggregating soft bounces and hard bounces (Poulos et al., 2020). While hard bounces occur when the e-mail indicator is incorrect and/or the user's name before the @ is false, soft bounces occur when, for example, a user cannot receive emails because their inbox is full, the sender's address has been blocked as spam, or the mail server is temporarily down (Maaß et al., 2021).
Analysis and resultsHaving estimated the fraudulent data entered by users in the different fields of the database following the different procedures outlined above, an analysis was performed in different stages to determine the most fraudulent profiles. Following Saunders et al. (2009), we compared the differences between generations and declared sex for name and surname, telephone number and e-mail address information. We used the χ2 test (Chi-square) and then paired t-tests on the distributions and observed significant differences in terms of the results.
We estimated that 325,096 users included one or more errors in their registrations, representing 5.87% of the over 5 million unique users. Regarding the registration of names and surnames, the results show that 268,980 users (4.86% of the total) intentionally supplied fraudulent information, disinformation, a much higher figure than that for those who made errors due to inattention, misinformation, 55,903 (1.01% of the total). Hence, in response to RQ1, we conclude that intentionality and, therefore, the generation of disinformation is the main reason for errors.
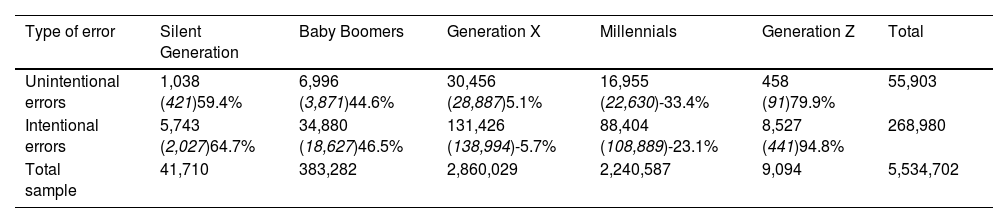
In response to RQ2 and RQ3, the results also suggest different inclinations to provide incorrect information among the five generational and sex cohorts. Generation Z and Silent users are found to proportionally make the most unintentional errors and Millennials make the fewest. These are also the cohorts that make the most (Generation Z and Silent) and fewest (Millennials) intentional errors (see Table 1).
Distribution of unintentional and intentional errors for name and surname compared to sample total.
Notes: In each cell: top figure, absolute frequencies; in brackets, expected values; and percentage deviation from the expected value. Unintentional errors χ2 (4) = 6393.05, p = .000; Intentional errors χ2 (4) = 173165, p = .000.
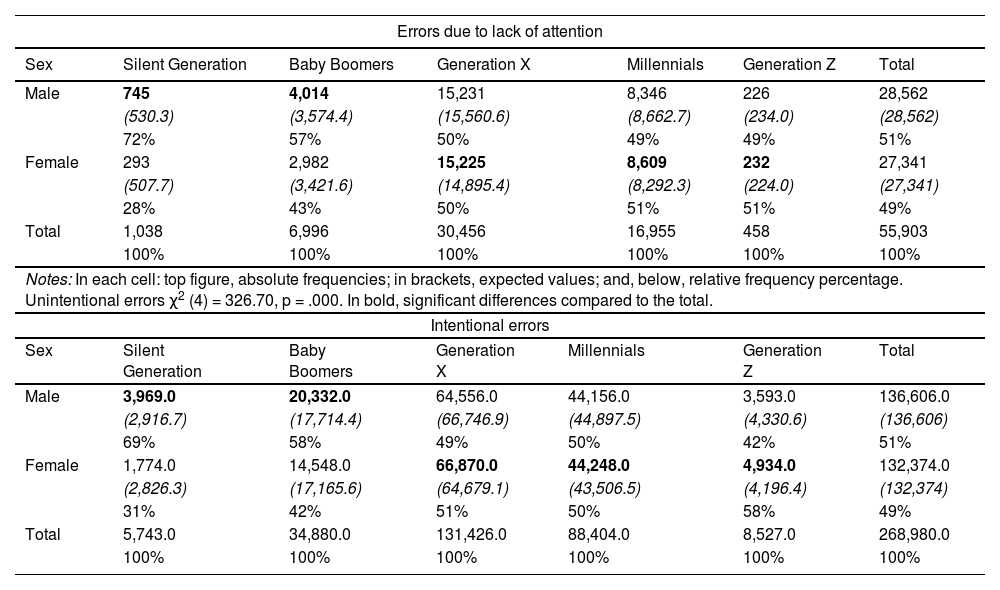
Regarding the comparative analysis by stated sex and generation, the male Silent Generation (72%), followed at a considerable distance by the male Baby Boomers (57%), are far more likely to make mistakes due to inattention. Similar figures were observed for disinformation among males: Silent Generation (69%) and Baby Boomers (58%). However, among females, it is the younger cohorts, Millennials (51%) and Generation X (50%), who have a slightly higher tendency to make errors due to inattention and these generations also make slightly more intentional errors, although Generation Z (58%) does so the most. To summarise, as shown in Table 2, men in the older cohorts and women in the younger cohorts are most likely to provide incorrect data both by accident and intentionally.
Frequency distribution, expected frequency and relative frequency of inattentive and intentional errors for names and surnames by sex and generations.
Notes: In each cell: top figure, absolute frequencies; in brackets, expected values; and, below, relative frequency percentage. Intentional errors χ2 (4) = 2000.0, p = .000. In bold, significant differences compared to the total.
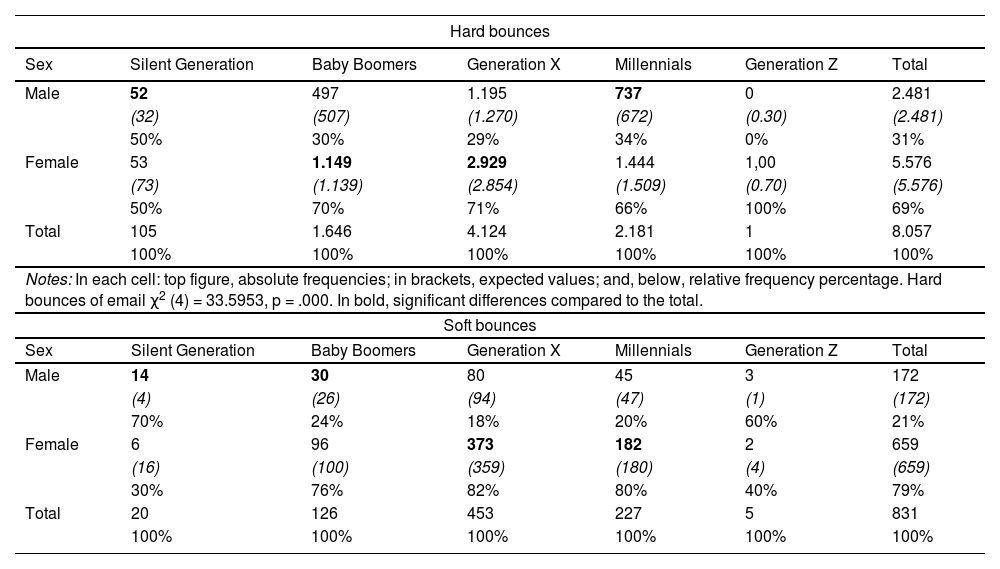
With regard to email address bounce rates, the results of the frequency analysis of hard and soft bounces (see Table 3) reveal that both the sex and generational cohorts affect the inclination to defraud. In the case of hard bounces, generated by entering invalid addresses, a higher frequency was observed among men of the Silent generation (50%) and Millennials (34%). As for soft bounces, which can be caused by the recipient's mailbox being full, the highest frequencies are also found among the Silent generation (70%) and also among Baby Boomers (24%). This reveals that older generations of men have a higher propensity to cheat when entering their email address. Among women, Generation X (71% for hard bounces and 82% for soft bounces) presents similar figures for both hard and soft bounces. The other generation of females that is most prone to soft bounces is Millennials (80%), while for hard bounces, it is Baby Boomers (70%). In the case of Generation Z, in both sexes the values were too low to be considered.
Frequency distribution, expected frequency and relative frequency of the number of hard bounces and soft bounces of email by reported sex and generation.
Notes: In each cell: top figure, absolute frequencies; in brackets, expected values; and, below, relative frequency percentage. Soft bounces of email χ2 (4) = 37.7187, p = .000. In bold, significant differences compared to the total.
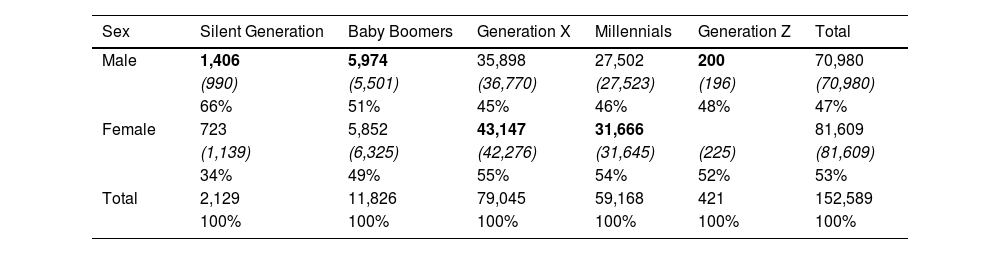
With regard to the number of fraudulent telephone numbers entered, there are also differences between sex and generation of users (see Table 4). Again, males from older cohorts (Silent Generation, 66%, and Baby Boomers, 51%) and, in this case, younger cohorts (Generation Z, 48%) are more likely to make mistakes when filling in their phone number. Among women, it is the middle-aged cohorts (Generation X, 55%, and Millennials, 54%) who have a higher propensity to disinform in this field. The greatest divergence between men and women is between the Silent Generation (with significant male participation) and Generation X (with high female participation).
Frequency distribution, expected frequency and relative frequency of the number of telephone number errors by reported sex and generation.
Notes: In each cell: top figure, absolute frequencies; in brackets, expected values; and, below, relative frequency percentage. Errors in phone χ2 (4) = 440.9970, p = .000. In bold, significant differences by sex compared to the total.
In general, in the fields studied, there continues to be a tendency for older male generations (Silent Generation and Baby Boomers) and middle-aged female generations (Generation X and Millennials) to cheat when registering their personal data.
Study 2aIn order to discover users' main motivations for entering false information, disinformation, a sample of regular users of these online sweepstakes residing in Barcelona was invited to attend an in-depth interview at a central location, with a €50 cheque being offered as an incentive. This qualitative in-depth interview technique is used when a researcher wants to get a clearer idea about a phenomenon or when prior information is insufficient. To recruit participants, 650 telephone calls were made, of which 293 were answered, 163 expressed an intention to participate, and 33 were finally selected (16 stated male (M) and 17 female (F)). The saturation criterion was employed to select the sample size, i.e. the sample recruitment process ended when no new information was received from new sampled units (Lincoln & Guba, 1985).
Data collection processOnce participants arrived at the venue, they were welcomed, given a brief introduction to the study and told about the economic and social consequences of introducing false information in online communication. In order not to condition responses, we followed Sannon et al's (2018) procedure of downplaying the importance of socially reprehensible behaviour. The respondents were told that we did not view the use of lies or falsification of data as good or bad, but that we were simply interested in analysing an important part of human communication. In order to contextualise the participants in the topic of the study, the interviewer presented a series of examples of false information supplied by participants in online sweepstakes and which had been collected by the lead generation company. The interviewees were then asked to try to explain the motives that might have led the entrants to provide incorrect data. After completing the consent form, the interviews were recorded. The interviews lasted an average of about 32 minutes.
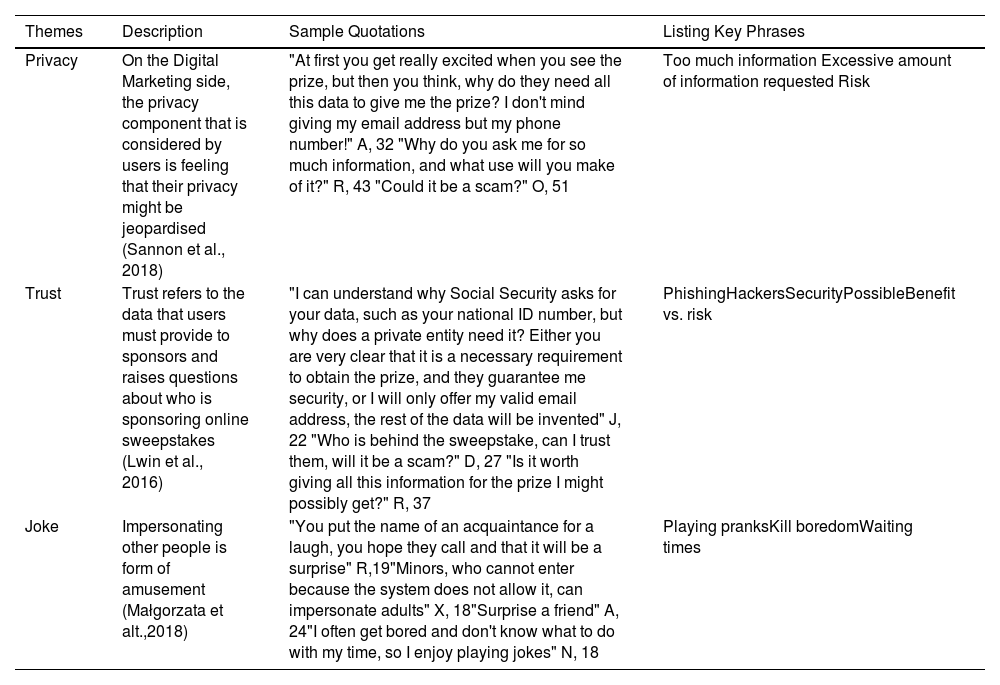
Data analysis and resultsThe recorded data was transcribed and analysed sequentially following the principles of thematic analysis. Coding was performed in three stages: First, the transcripts were read, the interesting sections were highlighted, and annotations were added in the margins. Second, the interesting parts were openly coded, and 24 codes were identified. Third, the codes were grouped hierarchically into a three-order structure. This axial condensation process (Tuomi et al., 2021) ultimately resulted in three main themes: privacy concerns as a consequence of asking for too much information; trust in the company or website providing such quizzes and sweepstakes, and amusement.
To check the analytical consistency of the coding process, the codebook, the descriptions of each main theme, and selected paragraphs from the interviews were emailed to an independent reviewer for recoding. Following the instructions of Tuomi et al (2021), this reviewer was not connected in any way to the research and also came from a different university background (Coder: 37 years old, Computer Engineer). The reliability between the two proposed codifications was determined by Cohen's Kappa, indicating very good inter-coder agreement (>0.80) (Landis & Koch, 1977).
Regarding the results, the participants stated that they use online sweepstakes and quizzes as a source of entertainment, and that transcription errors (‘typos’) are indeed common, as this is the least entertaining or interesting part of the activity. They also comment that intentional mistakes (giving a different name to their own) are made in order to preserve their anonymity. In addition, issues such as the topics of greatest interest (history, geography, celebrities, music, etc.) were raised, including whether the prize was more or less attractive. Regarding the motives for providing false information, the different topics were grouped into three categories that were labelled Privacy, Trust and Amusement.
- (1)
Privacy. Respondents express concern about the loss of anonymity and that websites ask for too much information, which conveys a sense of risk.
- (2)
Trust. Participants expressed some doubts as to who is sponsoring the online sweepstakes and tests. It was commented that advertising should offer guarantees that it is safe and should also engender trust. There was consensus that the site from which data is requested is important. If it belongs to a public body, so much the better.
- (3)
Amusement. Some users impersonate the names of acquaintances for fun. There is also talk of minors, whose participation is not allowed by the system, so they do so by entering false information.
The results of the categorisation from the open coding are shown in Table 5.
Interview results and categorisation from the open coding.
| Themes | Description | Sample Quotations | Listing Key Phrases | |
|---|---|---|---|---|
| Privacy | On the Digital Marketing side, the privacy component that is considered by users is feeling that their privacy might be jeopardised (Sannon et al., 2018) | "At first you get really excited when you see the prize, but then you think, why do they need all this data to give me the prize? I don't mind giving my email address but my phone number!" A, 32 "Why do you ask me for so much information, and what use will you make of it?" R, 43 "Could it be a scam?" O, 51 | Too much information Excessive amount of information requested Risk | |
| Trust | Trust refers to the data that users must provide to sponsors and raises questions about who is sponsoring online sweepstakes (Lwin et al., 2016) | "I can understand why Social Security asks for your data, such as your national ID number, but why does a private entity need it? Either you are very clear that it is a necessary requirement to obtain the prize, and they guarantee me security, or I will only offer my valid email address, the rest of the data will be invented" J, 22 "Who is behind the sweepstake, can I trust them, will it be a scam?" D, 27 "Is it worth giving all this information for the prize I might possibly get?" R, 37 | PhishingHackersSecurityPossibleBenefit vs. risk | |
| Joke | Impersonating other people is form of amusement (Małgorzata et alt.,2018) | "You put the name of an acquaintance for a laugh, you hope they call and that it will be a surprise" R,19"Minors, who cannot enter because the system does not allow it, can impersonate adults" X, 18"Surprise a friend" A, 24"I often get bored and don't know what to do with my time, so I enjoy playing jokes" N, 18 | Playing pranksKill boredomWaiting times | |
Based on the results obtained from the qualitative study, a quantitative study was used to measure the importance of the three factors revealed by the thematic content analysis. Since the aim was to measure the weight of factors of socially reprehensible behaviour (Sannon et al., 2018), instead of asking direct questions, a decomposition methodology (conjoint analysis) was used to estimate the users' preference structure. This consists of forming scenarios by combining the motivations that arose from the exploratory research (privacy, trust and amusement) and asking participants to choose the scenario that best identifies them.
Process of data collection, measurement and analysisDiscrete choice-based decomposition methods require five steps:
- (1)
Determine the number of factors and levels. In this study, three factors at two levels were considered: F1 (Information: +1 excessive information, -1 not too much information), F2 (Distrust: +1 high distrust, -1 trust), F3 (Amusement: +1 for fun, -1 not for fun).
- (2)
Create the experimental design. Considering three factors at two levels, the number of possible scenarios is 2 3 = 8. However, instead of asking participants to compare 8 scenarios and choose the one that best identified with them, as is usual in classical conjoint analysis, we used an adaptive conjoint analysis (ACA) design consisting of twelve blocks of two profiles (Huertas-García et al., 2016). Each respondent was randomly assigned a scenario consisting of three blocks of two profiles each (e.g. block 1 consisting of profiles 1 and 7, block 2 consisting of 2 and 5, and block 3 consisting of 5 and 8). In total, four 3-block scenarios with two profiles each were assigned (24 profiles). From each block, the respondent had to choose one of the two, so three pieces of information were collected from each respondent to allow estimation not only of the weight of the main factors but also between two-factor interactions. This ACA experimental design was proposed by Huertas-García et al. (2016) and a practical application can be found in Perdiger et al. (2019).
- (3)
Develop the appropriate question to elicit the choice in each choice set. The proposal was: "Imagine that you are participating in an online quiz and you have to fill in the data shown below (Figure 1) in order to win the prize. Which of the following sentences best describes your opinion regarding the supply of false information?" An example choice set is: "Please choose only one of the following options":
Option 1 (+ 1 excessive information; -1 confidence; -1 not for fun). "Because an excessive amount of information is requested, although I trust the site, and I do not create false names for fun".
Option 2 (- 1 not too much information, + 1 great mistrust, - 1 not for fun). "Because, although the amount of information requested is not excessive, I am very suspicious of the site, and I am not in favour of creating false names for fun".
Option 3. None of the options identifies me.
- (1)
Implement the choice sets following the experimental design with a sample of consumers. A purposive sampling strategy was used by sending emails and using Google Forms to create and share online forms and analyse responses in real time. 13,500 emails were sent to regular users of the online sweepstakes inviting them to complete the questionnaire and encouraging them to enter the IPhone 13 sweepstake, of which 2,929 were opened, 336 questionnaires were completed, and 269 were valid.
- (2)
Analyse the data with an appropriate analytical model. The results were estimated using the Multinomial Logit Model (Rao, 2014). Data was collected in May 2022.
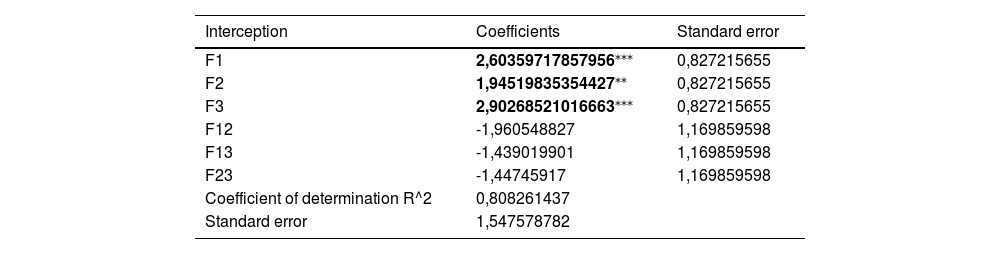
Table 6 summarises the results and shows the weight of main factors and two-factor interactions that motivate the supply of false information.
Relevance of the factors that motivate the introduction of false information obtained through statistical regression inference.
| Interception | Coefficients | Standard error |
|---|---|---|
| F1 | 2,60359717857956⁎⁎⁎ | 0,827215655 |
| F2 | 1,94519835354427⁎⁎ | 0,827215655 |
| F3 | 2,90268521016663⁎⁎⁎ | 0,827215655 |
| F12 | -1,960548827 | 1,169859598 |
| F13 | -1,439019901 | 1,169859598 |
| F23 | -1,44745917 | 1,169859598 |
| Coefficient of determination R^2 | 0,808261437 | |
| Standard error | 1,547578782 |
F1 means "Not trusting enough", F2 = "Safeguarding one's privacy" and F3= "Amusement”; F12 means the interaction between F1 and F2, and so on subsequently.
The results show that the main motivation for users to enter false information was amusement, F3 (Amusement: +1 for fun), followed by not having enough trust in the company's website, F2 (Distrust: +1 high distrust), and, finally, the desire to maintain their privacy and considering that too much information was being requested, F1 (Information: +1 excessive information). Furthermore, the results indicate that the three factors act independently, as no interaction between two factors reached significant values. Therefore, the response to RQ4 on the main motivations for entering false information are: amusement, lack of trust in the company's website, and the desire to maintain one's privacy and not reveal an excessive amount of information.
Recently, the problems generated by the proliferation of misinformation and disinformation on social networks, and the need to detect it, have attracted a great deal of attention (Di Domenico et al., 2020; Pascual-Ezama at al., 2020). Existing approaches to cheater detection are mainly based on the use of certain user characteristics, such as unusual names, offensive words, and non-existent phone numbers or email addresses, and the configuration of blacklists of users, which artificial intelligence algorithms detect quickly and accurately (Saura, 2021; Zhang et al., 2020). However, knowing which user profiles are more inclined to misinform can boost the performance of these bots. In this study, it has been detected that men of older generations and women of younger generations are more likely to falsify their data. In addition, the main reasons for this socially reprehensible behaviour are fun, lack of trust in the website requesting the data and safeguarding privacy. Identification of cheaters and their motivations can help academics and practitioners to try to improve methods for capturing information, and also ways of detecting cheaters on social networks.
General discussion and conclusionsThe emergence of social networks and the information flows generated between them have created an enabling environment for digital marketing. However, it is not easy to synthesise the enormous volume of information that circulates on networks in a way that can help academics and digital marketers to make decisions. One of the ways to analyse relevant information is to use databases of potential consumers collected by lead-generating companies (Desai, 2019). However, in order for these databases to fulfil their function, they must be as reliable as possible, i.e., they must contain real data that is as clean as possible of misinformation.
This study describes the profiles of users who enter false information when registering for online sweepstakes and quizzes, based on estimates of negligent, misinformation, and intentional inaccuracy, disinformation. The results suggest that most errors are made intentionally, at a ratio of almost 5:1 with regard to unintentional actions. Furthermore, men of older generations and women of younger generations are more likely to falsify their data. However, and in line with the findings of Dabija et al. (2018), small differences are also observed regarding the disclosure of names and surnames, emails and telephone numbers. We found that the most repeated motivations for producing disinformation were, in the following order, amusement, lack of trust in the site requesting the data, and safeguarding privacy. These results are in line with previous research, which has shown that trust is a key aspect and can be considered a predictor of whether or not the users of social networks will provide false information (Gefen et al., 2003).
This study furthers our knowledge about the process of capturing data from internet users, in this case by means of online sweepstakes and quizzes, and the problems arising from the volume of fraud committed by users. Indeed, we have not found any previous study that estimates and analyses such practices when users register their information on websites with such a large sample (more than five million) and over such a long period of time (eleven years). Although each of the fields requires a different method for estimating errors, there are common trends among some generational and sex profiles.
In the analysis of names and surnames, the cohorts with a higher propensity to enter incorrect data are Generation Z, Silent and Baby Boomers. However, when crossing the data with declared sex, we find that it is men from the older generations and younger women who are most inclined to misrepresent. However, actions when filling in the email address and phone number fields do not follow the exact same pattern as the previous ones, results that are in line with those obtained by Dabija et al. (2018). The estimation using hard bounces highlights male Silents and Millennials and female Baby Boomers and Generation X as the most fraudulent. Finally, using call-backs, male Silents and Baby Boomers and female Generation X and Millennials were found to be the most fraudulent generations.
Theoretical implicationsWhile this research provides evidence of and support for the tendency of users to enter fraudulent information on social networks (Islam et al., 2020; Pennycook & Rand, 2019), we also find that this occurs in less than 6% of cases (and less than 5% for intentional errors). However, while there is room for improvement in mechanisms to reduce unintentional errors, mechanisms to control for intentional errors should be directed towards cheater profiling (Cosmides & Tooby, 2016).
This study presents evidence that some user profiles are more inclined than others to enter false information when registering on the Internet, so their identification can help predict such behaviour and target measures to control these practices better (Song et al., 2021). For example, it would be logical to assume that older people (Silent and Baby Boomers) are more inclined to make unintentional errors than younger people, as they are more affected by deterioration in physical condition and cognitive abilities (problems with sight, memory loss, difficulty typing letters correctly on a keyboard, etc.). However, this is only true when they are compared with middle-aged generations, but not with younger people (Generation Z) who are the most inclined towards such practices. Maybe, although young people are more accustomed to the Internet, they write in a hurried manner without checking that the information is correct (Valentine & Powers, 2013). Regarding intentional errors, one might assume, on the one hand, that more mature people, with more life experience and who have adopted these technologies much later, use them for a clear purpose and to obtain a specific outcome (Dabija & Grant, 2016). However, the results only partially confirm this assumption, as older, self-trained male cohorts tend to be more likely to enter false information. On the other hand, nor does the assumption hold that younger generations, who were born in the age of the Internet and social networks, behave differently to other generations, for the results of this study do not point in that direction (Lenhart et al., 2010). In fact, in the analysis of the name and surname fields, younger users behave similarly to older generations.
Implications for managementAlthough the introduction of false personal data does not occur in alarming proportions, it does affect both individual users and businesses (Shu et al., 2020). Given that the proliferation of cheaters is inversely correlated with good practices in tacit or explicit negotiations (Axelrod & Hamilton, 1981), it is important to detect them in order to prevent and eliminate fraud. Moreover, online environments with a large number of users facilitate such practices (Allcott & Gentzkow, 2017). Although psychological mechanisms have been developed in offline environments to dissuade cheaters (Mealey et al., 1996), these mechanisms are not directly transferable to online environments, so AI and technology play a key role in developing devices to mitigate the consequences of fraudulent information (Zhang & Ghorbani, 2020). Tackling these problems creates opportunities in the innovation and development of tools for detecting, preventing and monitoring potential fraud, with significant economic benefits through value creation and capture. Therefore, having a clear profile of cheaters as well as knowledge of their motivations for cheating can be very valuable (Nambisan et al., 2019), as it helps to filter the information that is fed into the databases used by companies and decision-makers, and directly affects the outcome of their decisions (Zhang et al., 2016; Ogilvie et al., 2017; Bondarenko et al., 2019; Lin et al., 2021). The determination of the most common cheater profiles (in terms of generation and stated sex) can help to filter databases so that companies can offer better personalised services to their customers (Zhang et al., 2016), preventing them from receiving information that is of no interest to them (Agrawal et al., 2011), and instead increasing the likelihood of making attractive offers and maximising returns (Zhang et al., 2016). For companies, more reliable databases will improve productivity (Lin et al., 2021), ensure they do not miss out on business opportunities (Bondarenko et al., 2019) and, ultimately, raise their profits (Tripathy et al., 2013). In turn, this will increase employee satisfaction, as they will achieve better sales, loyalty and more personalised customer services (Ogilvie et al., 2017). In short, our research helps companies to develop more targeted and effective communication strategies, which will have a positive impact on customer value and loyalty, as well as on the company's profits.
Limitations and future studiesThe results of this study were based exclusively on the data contained in the database provided by the lead generation company. However, they would need to be validated against data supplied by other such companies (Jung et al., 2020), as well as other – even unstructured – data on user behaviour (Choudrie et al., 2021). It would also be interesting to contrast the results with other web data collection formats (Cruz-Benito et al., 2018). Also, the data was analysed globally without taking into account recruitment sources or methodologies, or different origins and social networks (Parekh et al., 2018). This additional information could enrich studies in this field. As indicated by authors such as Borges-Tiago et al., (2020) attitudes differ depending on the country that users come from. Our data was collected in Spain, and it remains to be seen whether its conclusions can be extrapolated to other countries and cultures and whether future generations will continue to behave in the same way (Altman and Bland, 1998). There is also no evidence of exploratory research into the sectoral clustering of profiles that enter their data online and whether there are differences in behaviour by generation or declared gender. It would be especially interesting for future research to examine how different profiles behave in terms of decision-purchase-post-purchase behaviour. It would also be useful to study the clustering of consumer profiles by sector and thus analyse how the resulting algorithm is affected by the false information entered, which would to help to devise mechanisms to correct or eliminate such practices. The particular casuistry of cohorts that are more prone to unintentional errors, such as older people who are more affected by health conditions and accessibility issues, leads to an ethical debate that could be explored further, namely that on mechanisms to avoid penalising the participation of these older users just because they might find it harder to read, write or remember information. In other words, it would be very interesting to look in depth at the ethical implications of systematically excluding or limiting the participation of certain users in prize draws and tests, simply because they may make mistakes due to health conditions, and to investigate why female members of the same cohorts do not seem to be affected by such difficulties to the same extent.