Technology Enhanced Medical Education International Conference (THEME 2019)
Más datosOsteoarthritis (OA) causes pain and disability in patients such that it interferes with daily activities. Pain becomes the main major symptom in joints that suffer from OA. Because of its chronic progressive nature, OA has a great socio-economic impact in developed and developing countries. This study aims to examine the correlation between Body Mass Index (BMI), the degree of pain based on Visual Analogue Scale (VAS) score, and knee osteoarthritis grading viewed from Kellgren–Lawrence criteria in patients with osteoarthritis of the knee joint.
MethodsThis research was an analytic study using a cross-sectional method. BMI was obtained by measuring the height and weight of the patients; the degree of pain was obtained through interviews using VAS score, and knee osteoarthritis grading was measured by Kellgren–Lawrence criteria from a conventional anteroposterior projection of knee X-ray.
ResultsOf the 60 samples of patients with knee OA, most of the samples are female (70% or 42 people) and the rest are male (30% or 18 people). No knee OA was found in patients with BMI below normal, three patients with normal BMI, and 57 patients (95%) with BMI above normal. Knee OA grading based on Kellgren–Lawrence criteria indicates that the most frequent grade is 3 (36.7% or 22 people), followed by Grade 2 (30% or 18 people). The highest degree of pain is severe VAS (56.7% or 34 people), followed by moderate VAS (38.3% or 23 people). The most frequent therapy given is surgery (53.3% or 32 people). The result of ANOVA correlation test indicates a significant correlation between BMI and knee osteoarthritis grading, with p=0.039 (p<0.05), in which the higher the BMI value, the more severe the knee OA grading. The pain scale assessed by VAS score is strongly correlated with knee OA grading suffered, with p<0.001, in which the more severe the knee osteoarthritis grading, the higher the pain scale (VAS).
ConclusionThe higher the BMI value, the heavier the grading of OA of the knee. As well, the heavier the grading of OA of the knee, the higher the pain scale (VAS).
Overweight is one of the strongest modifiable risk factors for OA, especially in the knee joint. Half of a person's weight rests on the knee joint during walking. Increased body weight will aggravate the burden on the knee joint.1
The prevalence of obesity throughout the world is increasing from year to year. In 2003, the World Health Organization (WHO) highlighted that around one billion people in the world were overweight, and at least 300 million were clinically obese. The WHO also predicted that in 2015, 2.3 billion adults would be overweight, and 700 million would be obese.2 As the number of people reaching middle age increases, and with the increase in the incidence of OA, the impact will be worse later on.3 Obesity that can be seen from a high BMI (Body Mass Index) can trigger pain in knee OA and has a greater impact on society, such as a person's limited activity compared to an individual with a normal BMI.1
OA causes pain and disability in patients such that it interferes with daily activities and causes severe socio-economic impacts. Pain becomes the main major symptom in joints that suffer from OA. Because of its chronic progressive nature, OA has a great socio-economic impact in developed and developing countries.1
For this reason, researchers feel the need to make observations about the relationship of body weight as measured by BMI and the degree of pain as measured by the VAS score toward grading knee OA based on Kellgren–Lawrence criteria.
MethodsThis research was carried out in the Orthopedic Outpatient Departments of Wahidin Sudirohusodo Hospital and the Hospital Network in Makassar, Indonesia. The research is an observational study using a cross-sectional study design.
All procedures for human experiments were approved by our local ethics commission, number: 226/UN4.6.4.5.31/PP36/2019.
Population and sampleThe participants in this study were all outpatients in the Orthopedic Division of Wahidin Sudirohusodo General Hospital and Hospital Network in the period March 2019. The study sample was 60 people selected from all knee OA patients who met the inclusion criteria.
Data collection methodData collection was carried out by researchers. Data regarding the identity and degree of pain based on the Visual Analogue Scale (VAS) score were obtained by interview. Body Mass Index (BMI) data is based on body weight and height measurements. Grading of knee OA based on Kellgren–Lawrence criteria is determined by the anteroposterior X-ray projection of the knee joint.
Data analysisData analysis was performed using SPSS (IBM SPSS Statistics for Windows, Version 22, Released 2013. IBM Corp., Armonk, NY). Statistical analysis was performed by using descriptive statistical calculations and frequency distribution and statistical tests. Univariate analysis was used to assess sample characteristics. The bivariate analysis used was the ANOVA test to assess the relationship between BMI values and pain scores based on VAS with knee OA grade based on Kellgren–Lawrence criteria. The results of the test were statistically significant if the p-value was <0.05.
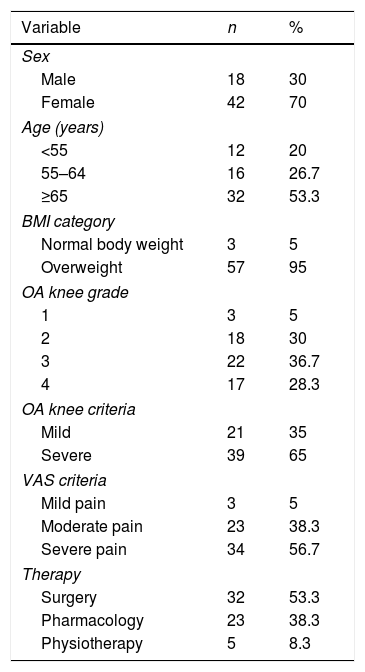
ResultsSample characteristicsBased on Table 1, information was obtained regarding the distribution of the characteristics of the study sample. Of 60 samples, 42 (70%) were women, and 18 (30%) were men. Most of the participants were more than 65 years old, with 32 people (53.3%) of the total sample. Almost all of the study sample had above normal BMI (57 people, 95%), and only a very few had a normal weight (three people, 5%). None of the sample had a BMI below normal. Of 60 people sampled with knee OA, about 39 people (65%) came to the hospital with severe-grade OA of the knee (Grade 3 and Grade 4 according to Kellgren–Lawrence criteria), of which, 22 people had Grade 3 knee OA and 17 people had Grade 4. Thirty-four people (56.7%) had high pain scores (very painful) according to pain measurements based on the VAS score. Regarding the therapy obtained for knee OA patients in this study sample, the main therapy was surgery (32 people or 53.3%); 23 people (38.3%) received pharmacological therapy, and only a few (five people, 8.3%) received physiotherapy. Based on Table 2, the subjects studied were between 33 and 85 years old, with an average age of 63.9±9.6 years. BMI values were between 20.8 and 28.6, with an average BMI of 25.7, and the VAS score has a range between 3 and 8, with an average score of 6.2.
Patient characteristics.
| Variable | n | % |
|---|---|---|
| Sex | ||
| Male | 18 | 30 |
| Female | 42 | 70 |
| Age (years) | ||
| <55 | 12 | 20 |
| 55–64 | 16 | 26.7 |
| ≥65 | 32 | 53.3 |
| BMI category | ||
| Normal body weight | 3 | 5 |
| Overweight | 57 | 95 |
| OA knee grade | ||
| 1 | 3 | 5 |
| 2 | 18 | 30 |
| 3 | 22 | 36.7 |
| 4 | 17 | 28.3 |
| OA knee criteria | ||
| Mild | 21 | 35 |
| Severe | 39 | 65 |
| VAS criteria | ||
| Mild pain | 3 | 5 |
| Moderate pain | 23 | 38.3 |
| Severe pain | 34 | 56.7 |
| Therapy | ||
| Surgery | 32 | 53.3 |
| Pharmacology | 23 | 38.3 |
| Physiotherapy | 5 | 8.3 |
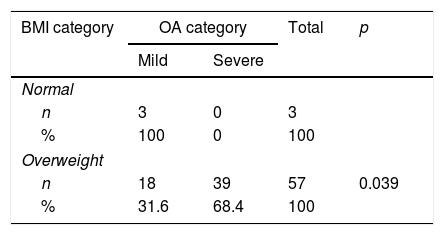
The results of BMI relationship analysis categories with knee OA grading in Table 3 show a significant relationship between BMI and the severity of knee OA with p=0.039 (p<0.05). The percentage of severe knee OA in excess BMI (68.4%) was significantly higher than in normal BMI (0.0%) (Fig. 1).
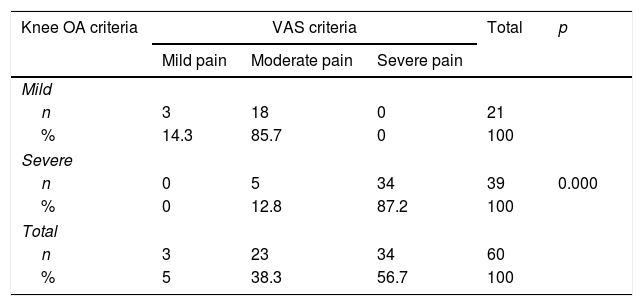
The results of the analysis of the relationship between knee OA criteria and VAS score in Table 4 show a significant relationship between the severity of knee OA grading and the degree of pain (p<0.001). The percentage of very painful was significantly higher in heavy knee OA (87.2%) than in mild knee OA (0.0%), while the percentage of moderate and mild pain was found to be higher in mild knee OA (85.7% and 14.3%) than in severe OA (12.8% and 0.0%), as seen in Fig. 2.
Based on the characteristics of the sample, most of the participants are female (70%) or 31. Research by Natya2 at Al-Islam Islamic Hospital Bandung and Yofara (2013)4 at Fatmawati General Hospital Jakarta obtained similar results. This is consistent with the widely accepted theory that female sex is a risk factor for OA, especially knee OA, where female sex increases the risk of OA genu by 1.84 times.4
Based on age, the highest proportion of knee OA sufferers in this study was 65 years and older (53.3%), with an average age of 63 years. This is in line with research conducted by Sara (2010)5 at the Hospital Dr. Kariadi Semarang. Further, in their study, Litwic et al. (2013)6 found the prevalence of OA in America and Europe as much as > 50% at the age >75 years. Likewise, Kim et al. (2010)6 in Korea found similar results. This is in line with the theory that age is a major risk factor for OA, with the prevalence and severity of OA increasing with age. Radiographic evidence shows that the incidence of OA is rare in individuals under 40 years. OA rarely occurs in children, and often occurs in those over 60 years of age (Maya, 2014).7 This follows the theory where toward older age, there is a decrease in the capacity of anabolism, which results in decreased regeneration capacity of chondrocytes, which are the only cells making up the cartilage matrix.4
Based on BMI, almost all of the study sample had higher than normal BMI criteria (57 people, 95%), and very few had normal weight (three people, 5%). There were no knee OA sufferers in the study with lower BMI. In this study, three knee OA patients with normal BMI were female sex and >55 years old. Besides age, female gender is a risk factor for OA. Research conducted by Annas et al. (2015)8 in Surakarta found, out of 25 obese elderly people, 14 suffered from OA, while of 25 elderly people who were not obese, only three suffered from OA, and all three people were over 70 years old. Age is also a factor in OA. The same results were found in research conducted by Elen Mahmud Lukum et al. (2011)9 in Makassar, where data were obtained from 60 patients with knee OA. Of the sample, 75% (45 people) had BMI higher than normal; 13 people (21.7%) had normal body weight, and two people (3.3%) were low weight. However, the study did not explain other risk factors for OA that might be experienced in individuals with lower BMI in this study.
Based on Kellgren–Lawrence grading, the highest proportion of patients with knee OA in this study was Grade 3 (36%), followed by Grade 2 (30%), Grade 4 (28%), and Grade 1 (5%). This is not in line with research conducted by Muraki et al. (2013)10 in Japan, where in the results of epidemiological studies conducted in several studies mentioned, most knee OA was Grade 2, followed by Grade 3. However, a study at the Sanglah Hospital in Bali11 obtained results similar to this study, where Grade 3 knee OA was the highest percentage (39%), followed by Grade 2 knee OA. Research conducted by Ilham et al.12 at RSUP Dr. Sutomo, Surabaya obtained similar results to this study, where Grade 3 knee OA is the most frequent, compared to Grade 2 knee OA.
Based on the results of the studies above, it can be seen that in Indonesia, most knee OA patients come for treatment at Grade 3, whereas in Japan, most patients come for treatment at Grade 2. The high percentage at Grade 3 above is also influenced by the type of hospital where the study was conducted; it is the largest referral center hospital in its area, so most knee OA patients coming for treatment are Grade 3 and Grade 4.
Based on the VAS score, the highest proportion of patients with knee OA in this study (56.7%, 34 people) came with a high pain score (severe pain), moderate pain in as much as 38.3% (23 people), and mild pain in as much as 5% (3 people). Mean VAS value was 6.2±1.6. This is almost in line with research conducted by Nyoman (2012),13 in which the study found the mean VAS in knee OA patients was 5.2±2.4. However, according to the theory, individual perceptions of pain are different; the nature of pain is very subjective because pain feelings differ in each person in terms of scale or level, and only that person can explain or evaluate the pain they experience.14
In terms of therapy, the most-used therapy for knee OA in this study was surgery (53.3%), then pharmacology (38.3%), and the least-used was physiotherapy (8.3%). This is in line with the large number of people in this study who came for treatment with heavy knee OA grading (Grade 3 and Grade 4), which amounted to 65% and was also influenced by the high value of VAS reported by patients.
Indications for action outside physiotherapy and pharmacology are if there is any suspicion or evidence of inflammatory arthritis, suspicion or evidence of infectious arthritis, patients who experience progressive complaints and interference with daily physical activity, pain complaints that interfere with the patient's quality of life, severe mechanical symptom problems such as walking disturbances, locking knees, and not being able to squat, signs of abnormalities in joint structures. Then surgery in the form of arthroscopy or knee replacement or osteotomy is indicated (IRA, 2014).15
From the results of the analysis of the relationship, there is a significant relationship between BMI and knee OA severity with a value of p=0.039 (p<0.05). The percentage of severe knee OA in individuals with excess BMI (68.4%) was significantly higher than in normal BMI (0.0%). Fig. 1 shows a significant relationship between BMI values and knee OA grade (p<0.001), where the higher the BMI value, the higher the knee OA grade. Research conducted by Annas et al. (2015)8 in Surakarta also found the same results (p=0.001). Rifa et al. (2011)16 in Semarang obtained similar results, with p=0.001. Mambodiyanto et al. (2016)17 in Cilacap report that from the results of the odds ratio test, it appears that excess body weight is very influential in the risk of knee OA.
Many studies have looked for an association between obesity and arthritis. In Indonesia, through a study by Nainggolan (2009),17 it was found that for every increase in body weight of 1/2kg, knee pressure increases by 1–1½kg. Weight gain of 1kg increases the risk of OA by 10%. For obese people, any weight reduction, even 5kg, will reduce the risk of knee OA by 50%.
Based on the results of the analysis of the relationship, there is a significant relationship between the severity of knee OA and the degree of pain (p<0.001). The percentage of severe pain is significantly higher in heavy knee OA (87.2%) than in mild knee OA (0.0%), while the percentage of moderate and mild pain was found to be higher in mild knee OA (85.7% and 14.3%) than in severe OA (12.8% and 0.0%). Fig. 2 shows a significant relationship between knee OA grade and VAS score (p<0.001), where the higher the knee OA grade, the higher the VAS score. Research conducted by Elen Mahmud Lukum et al. (2011)9 at the same hospital, namely, Wahidin Sudirohusodo General Hospital Makassar, obtained the same results (p=0.001). The same results were also found in a study conducted by Ke Wang et al. (2017),6 who found a significant relationship (p<0.001) between the severity of knee OA grading and the prevalence of knee pain that often occurs in all racial/ethnic populations. This is consistent with the theory that decreasing the size of the femorotibial joint gap from normal size causes an increase in intramedullary pressure, subchondral fracture, causing pain.3,6
ConclusionIt was concluded that the higher the BMI value, the heavier the grading of OA of the knee, and the heavier the grading of OA of the knee, the higher the pain scale (VAS). It is expected that improving BMI toward normal can reduce the risk of getting more severe OA of the knee and reduce the scale of pain caused by the severity of knee OA.
Ethical approvalAll procedure for this study has been approved by Ethics Commission Faculty of Medicine, Hasanuddin University Number: 226/UN4.6.4.5.31/PP36/2019.
ConsentThe research was conducted ethically in accordance with the World Medical Association Declaration of Helsinki. The patients have given their written informed consent on admission to use their prospective data base and files for research work.
FundingThe authors declared that this study has received no financial support.
Author contributionLS, CHR, AS, and Pri wrote the manuscript and participated in the study design. LS, CHR, and Pri drafted and revised the manuscript. LS, CHR, and Pri performed the treatment and surgery. LS, AS, and Pri performed bioinformatics analyses and revised the manuscript. All authors read and approved the final manuscript.
Conflicts of interestThe authors declare that they have no conflict of interests.
Peer-review under responsibility of the scientific committee of the Technology Enhanced Medical Education International Conference (THEME 2019). Full-text and the content of it is under responsibility of authors of the article.


