Previous studies showed gender-associated clinical and MRI differences in multiple sclerosis (MS) evolution. However, only few studies were done with nonconventional MRI techniques and no study was done in a South American MS population. The aim of this study was to investigate gender differences according to nonconventional MRI measures in patients with MS from Buenos Aires, Argentina.
MethodsRelapsing-remitting MS patients (RRMS) with at least 6 years of follow up and an MRI at onset and at 6 years were included. Patients were assessed using nonconventional MRI measures: total brain volume (TBV), neocortical grey brain volume (GBV), white brain volume (WBV), lesion load (LL), % of brain volume change between onset and year 6 (% BVC) and regional brain volume change. Gender-related MRI differences were investigated using general linear model analysis.
ResultsThe 45 patients were included (25 female). Mean follow up time was 7.3±0.2 years. No differences in age, EDSS at onset, DMD treatment, TBV, GBV, WBV neither LL were found between gender at baseline. Six years later, males showed a decrease in TBV (P=.002) and GBV (P≤.001) and an increase in LL (P=.02) and % BVC (P<.001) vs. females. Female patients showed a decrease in the volume of frontal subcortical region.
DiscussionThis is the first study showing differences in brain volume changes between gender in MS patients from South America. Future studies will confirm our initial findings.
Algunos estudios demostraron una evolución clínica diferente de la esclerosis múltiple (EM) entre los varones y las mujeres. Son escasos los trabajos que muestran esta diferencia con técnicas no convencionales de resonancia magnética (RM). El objetivo es investigar las diferencias estructurales cerebrales en RM entre los varones y las mujeres con EM durante el curso de la enfermedad.
MétodosSe incluyeron pacientes con EM forma recaída-remisión (EMRR), con al menos 6 años de seguimiento desde el inicio, que tuviesen una RM basal y al sexto año del primer evento desmielinizante. Se midió: volumen cerebral total (VCT), volumen de sustancia gris neocortical (VSG), volumen de sustancia blanca (VSB), volumen lesional (VL) y tasa de atrofia cerebral global (TAg) y regional (TAr). Se analizaron las diferencias transversales (basal y al sexto año) y longitudinales entre sexos, utilizando SIENAXr®, SIENA®, SIENAr® y SepInria.
ResultadosSe incluyeron 45 pacientes, 25 mujeres. El seguimiento fue de 7,3±0,2 años. No hubo diferencias entre edad ni EDSS de inicio, tiempo de seguimiento o tratamiento, VCT, VSG, VSB ni de VL en la RM basal. A los 6 años no se observaron diferencias en EDSS ni en VSB; sin embargo los varones tuvieron una reducción del VCT (p=0,002) y VSG (p≤0,001) y un incremento del VL (p=0,02) y de TAg (p<0,001) respecto de las mujeres. Regionalmente, las mujeres presentaron mayor atrofia frontal subcortical que los varones.
DiscusiónEste es el primer estudio que muestra diferencias regionales de atrofia y de volumen lesional entre género en una población latinoamericana con EM.
Multiple sclerosis (MS) is a chronic inflammatory and degenerative disease of the central nervous system (CNS). It is pathologically characterised by multiple lesions that gradually increase, resulting in significant disability in most affected patients within 20 to 30 years after onset of the disease.1–3
Prior studies have shown that the course of MS differs between men and women. Some studies found that men presented more marked progression of physical disability than women,4–6 as well as more inflammatory lesions in T1 and T2-weighted MRI sequences.5,7
The appearance of MRI techniques has allowed researchers to measure atrophy in different areas of the central nervous system. These techniques include longitudinal measurement of cerebral atrophy with Structural Image Evaluation using Normalisation of Atrophy software (SIENA®), assessment of damage to the white matter with the Tract-Based Spatial Statistics software (TBSS®), measurement of the cortical and subcortical atrophy using Voxel Based Morphometry techniques, and other more recently introduced methods.8 Despite their widespread use in MS research, these techniques have rarely been employed to investigate the differences in brain structure between men and women with MS during the course of the disease.
We carried out a longitudinal study to examine the structural differences in the brains of men and women with MS using MR imaging.
MethodsPatientsThe study included patients with relapsing-remitting MS (RRMS)9–11 and at least 6 years of follow-up after onset of the disease. Patients were treated in the neuroimmunology and demyelinating diseases section of the neurology department at Hospital Italiano de Buenos Aires. Onset of disease was defined as the appearance of the first sign/symptom suggesting CNS demyelination and affecting the optic nerves, brainstem, spinal cord, or other regions. This symptom was not attributable to other diseases.12 All cases were assessed by a neurologist with experience in the management of demyelinating diseases who examined patients’ complementary studies and their demographic and clinical characteristics. A brain MRI was performed within 60 days of the first demyelinating episode and after 6 years of follow-up. MRI scans were taken using a 1.5 tesla Siemens scanner and following standardised image acquisition protocols for patients with demyelinating diseases (proton density-weighted, T2-weighted, FLAIR, and T1-weighted sequences with or without intravenous contrast). Each patient's MRI was analysed every time images were captured to measure total brain volume (TBV), neocortical grey matter volume (GMV), and white matter volume (WMV), along with lesion volume (LV), global cerebral atrophy rate (gAR) and regional cerebral atrophy rate (rAR). We analysed cross-sectional and longitudinal differences between men and women. Measurements were carried out using the following software: SIENAXr®, SIENA®, SIENAr, and SepInria®.
Analytical techniquesMeasuring total brain volumeWe used T1-weighted MRI sequences to measure TBV, GMV, and WMV and SIENAXr®13 software and techniques to measure cerebral atrophy. When taking measurements, SIENAXr® uses a brain extraction tool (BET) from the FMRIB Software Library (FSL) to extract the patient's brain and cranial data from the MR images. After data extraction, tissue segmentation software called FAST® (also from the FSL)14 groups the imaging data by tissue type (neocortical grey matter, white matter, and CSF). Once this step is completed, it can estimate the TBV, GMV, and WMV.15 By following this automated process, SIENAXr® is able to provide precise brain volumes. The resulting brain volume is then multiplied by a pre-established normalisation factor provided by the software, which yields the final normalised brain volume of the patient.
Analysis of global and regional cerebral atrophyWe analysed global and regional cerebral atrophy by measuring the percentage of change in brain volume between MRI scans using SIENA®13 software from the FSL (http://www.fmrib.ox.ac.uk). This software extracts brain and skull images from T1-weighted axial sequences captured at 2 different times. The images are then aligned with each other and segmented in order to distinguish between cerebral and non-cerebral tissue and detect any perpendicular displacements. The programme subsequently measures each segment in order to detect the percentage of change in the cerebral parenchyma between MRI1 and MRI2. This technique is currently used to measure changes in brain volume and atrophy among MS patients. We used SIENAr® software (a variation of SIENA®) to detect regional atrophy in different groups of patients.
Measuring lesion volumeLesion volume was measured using SepInria® software, designed as a semi-automatic method of measuring lesion volumes in T2-weighted and proton density-weighted sequences.
Statistical analysisThe baseline characteristics of the cohort were reported as percentages for categorical variables and as means with standard deviation (SD) for continuous variables. Results from men and women were compared using Fisher's exact test (categorical variables) and the Mann–Whitney U test (continuous variables). The level of statistical significance was set at P<.05. Data were gathered and analysed using Stata® software version 9.1.
The study was approved by the research protocol ethics committee at Hospital Italiano de Buenos Aires.
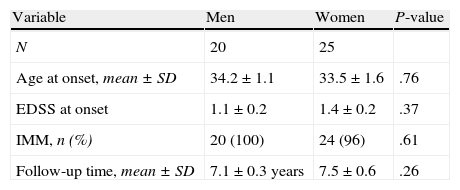
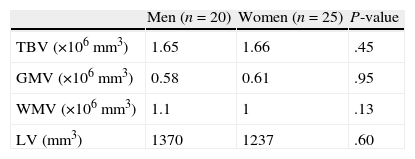
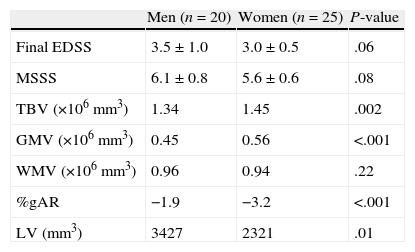
ResultsWe included 45 patients, of whom 25 were women. Mean follow-up time was 7.3±0.2 years. There were no sex-related differences in age at onset, follow-up time, and treatment (Table 1). The first MRIs revealed no sex-related differences in TBV, GMV, WMV and LV (Table 2). After 6 years, we observed no differences on the EDSS, multiple sclerosis severity score (MSSS), or WMV. However, men presented a significantly sharper decrease in TBV (P=.002) and GMV (P≤.001) and a significantly larger increase in LV (P=.02) and gAR (P<.001) than women (Table 3). Regarding regional atrophy, women presented more marked subcortical frontal atrophy than men, who in turn exhibited significantly greater global atrophy (Fig. 1).
Comparison between men and women's cerebral volumes after 6 years of follow-up.
| Men (n=20) | Women (n=25) | P-value | |
| Final EDSS | 3.5±1.0 | 3.0±0.5 | .06 |
| MSSS | 6.1±0.8 | 5.6±0.6 | .08 |
| TBV (×106mm3) | 1.34 | 1.45 | .002 |
| GMV (×106mm3) | 0.45 | 0.56 | <.001 |
| WMV (×106mm3) | 0.96 | 0.94 | .22 |
| %gAR | −1.9 | −3.2 | <.001 |
| LV (mm3) | 3427 | 2321 | .01 |
%gAR, percentage of global cerebral atrophy; EDSS, expanded disability status scale; MSSS, multiple sclerosis severity score; TBV, total brain volume; LV, lesion volume; WMV, white matter volume; GMV, grey matter volume.
Comparison of cerebral atrophy between men and women. Areas of atrophy more typically seen in women in the longitudinal follow-up are shown in blue, while atrophic areas more typically seen in men are shown in yellow/red. These colours can only be seen in the online version of this article.
Few studies have revealed sex-related differences among RRMS patients by using non-conventional MRI techniques. In our study, men presented a greater gAR than women, while women displayed more marked subcortical frontal atrophy. This finding was not associated with differences in physical disability as shown by the EDSS and MSSS of the sample. This may be due to the short observation period and the low sensitivity of the instruments (EDSS and MSSS) for detecting the subtle changes that may occur. Different cognitive functions may demonstrate a better correlation to MRI findings than to the patient’ physical characteristics.
Results from this study support recent volumetric findings in MS patients.16 Antulov et al. demonstrated the presence of sex-related differences in regional atrophy among MS patients; TBV and GMV were more compromised in men than in women. Although their study included a large patient sample, it does not provide data that would serve to detect cerebral structural changes over the course of the disease.16
Differences between men and women may be due to the influence of sex hormones on the patient's immune response. Researchers have reported that testosterone may have a inhibitory effect on autoimmune response by acting on B lymphocytes and the production of antibodies.17,18 The decrease in men's testosterone bioavailability with ageing would alter the regulatory control of B lymphocytes, therefore leading to a more aggressive immune response in men than in women.19 This theory is supported by recent findings revealing that men with MS who received testosterone replacement therapy experienced a slower cerebral atrophy rate.19 Likewise, this theory is also supported by other studies showing that preserved grey matter volume is associated with testosterone replacement therapy in patients with Klinefelter syndrome and supernumerary X-chromosome.20 Beyond these observations, more research on the potential relationship between testosterone and brain structural changes will be required in order to establish a specific causal association.
One of our study's limits is its observational design; however, its strict inclusion criteria and the distribution of confounders reduce the likelihood that biases and confounders would be able to affect observations.
In conclusion, our study demonstrates the presence of sex-related structural changes over the course of the disease. Men present greater global atrophy of cortical grey matter than women, who in turn experience more severe subcortical frontal impairment.
This is the first Latin American longitudinal study to use non-conventional MRI measurements (structural volumes, lesion volumes, and global and regional atrophy rate) to identify regional differences between men and women with MS. Future studies will help researchers confirm our initial observations, and clarify the possible role played by sex hormones.
Conflicts of interestThe authors have no conflicts of interest to declare.
Please cite this article as: Rojas J, Patrucco L, Besada C, Funes J, Cristiano E. Diferencias en la tasa de atrofia global y regional y del volumen lesional entre género en esclerosis múltiple. Neurología. 2013;28:389–393.


