This study examined the psychometric properties of a bilingual version of the Internet Addicion Test (IA) (Malay and English) in a sample of undergraduate students. A total of 104 students from Universiti Teknologi Malaysia (UTM) participated in this study. Result of Rasch Model analysis on the items of IAT showed that the 6-point rating scale was the optimal and the unidimensional structure of IAT was confirmed. The evidences provided by Rasch Model analysis supported that IAT was a good and reliable instrument to examine psychopathological internet use (PIU). The undelying construct of IAT was examined by EFA, which found a six-factor model as the best fit model (tolerance, time management problems & neglect of duty, neglect of social life, problematic use & reality substitute, withdraw & emotional conflict, intentionally concealing behavior, and lack of control). Time spent online was found to be significantly correlated to each factor subscales of IAT, but weakly. Factors of lack of control and problematic use & reality substitute were two salient underlying structures of IAT in this study. A bigger sample size was suggested to confirm the underlying construct by using CFA in the future study.
Este estudio ha analizado las propiedades psicométricas de una versión bilingüe del Test de Adicción a Internet, IAT (malayo e inglés) en una muestra de estudiantes universitarios. Un total de 104 alumnos de la Universiti Teknologi Malaysia (UTM) participaron en el estudio. El resultado del análisis del modelo de Rasch sobre los items del IAT mostró que era óptima la escala de valoración de 6 puntos y se confirmó la estructura unidimensional del IAT. Las pruebas proporcionadas por el análisis del modelo de Rasch confirmaron que este test es un instrumento bueno y fiable para evaluar el uso patológico de Internet. Mediante un EFA se analizó el constructo subyacente al IAT, apareciendo un modelo de 6 factores como el mejor modelo de ajuste (tolerancia, problemas de gestión del tiempo y descuido de las obligaciones, desatención de la vida social, uso problemático y sustitución de la realidad, alejamiento y conflicto emocional, ocultación intencionada del comportamiento y falta de control). Se vio que el tiempo transcurrido online correlacionaba significativamente, aunque débilmente, con cada factor subescala del IAT. Los factores de falta de control y uso problemático y sustitución de la realidad constituían dos estructuras subyacentes sobresalientes del IAT en este estudio. Se propuso utilizar una muestra mayor para confirmar la estructura subyacente del constructo mediante CFA en un futuro estudio.
Young (1996) was one of the first persons to study Internet use related problems and take the term “Internet addiction” to describe a portion of population that fascinated on Internet use and suffered from negative consequences. She further developed the criterion of Internet addiction based on the diagnostic criterion of pathological gambling in the DSM-IV and cited the term “pathological Internet use” (PIU) instead of “Internet addiction” in her recent publication “Internet Addiction: A Handbook and Guide to Evaluation and Treatment” (Young & Nabuco de Abreu, 2011).
Although there is no single standardized definition or terminology on PIU, researchers dedicated to defining the characteristics of PIU symptoms got similar conclusion in many aspects, such as tolerance, withdrawal, or mood adjustment. Griffiths (1998) explained the PIU in six aspects, including salience, mood modification, tolerance, withdrawal symptoms, conflict, and relapse. The recent description of PIU was from a dissertation, which was based on previous literature and DSM-IV-TR for impulse control disorder (DiNicola, 2004). The researcher proposed nine criteria for PIU: (1) “preoccupation with the Internet or Internet related activates”; (2) “tolerance in terms of a need to spend increasing amounts of time online in order to achieve desired excitement”; (3) “repeated attempts to control, reduce, or stop Internet use or to avoid a particular type of content”; (4) “withdrawal symptoms including restless or irritability when attempting to cut down or stop Internet use”; (5) “Internet use to escape problems or as a means of relieving dysphoric mood (e.g., helplessness, guilt, anxiety, depression)”; (6) “lying to family members, significant others, employers, or therapist to conceal extent of involvement with the Internet or type of content accessed online”; (7) “has committed illegal acts online (e.g., hacking into computer networks, copying files illegally, downloading illegal content), but not including swapping or sharing of music files”; (8) “has jeopardized or lost a significant relationship, job, or educational opportunity because of involvement with the Internet”; (9) “guilt about the amount of time spent online and/or guilt related to the activities engaged in online”.
Developing a valid instrument is always an important concern for research development in this field. Currently, there are at least 13 instruments designed to measure PIU (Moreno, Jelenchick, Cox, Young, & Christakis, 2011). Some were adapted from the criteria of DSM-IV regarding to substance abuse and dependence or pathological gambling, such as the Internet Addiction Disorder Diagnostic Criteria(Goldberg, 1996), the Internet-Related Addictive Behavior Inventory (Chang & Man Law, 2008), the Young Diagnostic Questionnaire (Young, 1996), and The Internet Addiction Test (IAT) (Widyanto & McMurran, 2004), the Chen Internet Addiction Scale (Chen, Weng, Su, Wu, & Yang, 2003) and the Problematic Internet Usage Questionnaire (Jia & Jia, 2009). Some are developed based on the cognitive-behavioral model, including the Online Cognition Scale (OCS) (Davis, Flett, & Besser, 2002), the Generalized Problematic Internet Use Scale (GPIUS) (Caplan, 2002) and the Generalized Problematic Internet Use Scale 2 (GPIUS 2) (Caplan, 2010). Other instruments are based on the PIU behavioral addiction model, such as the Compulsive Internet Use Scale (Meerkerk, van den Eijnden, Vermulst, & Garretsen, 2009).
Apart from the various instruments mentioned above, the Internet Addiction Test (IAT) is one of the most widely used instruments and has been regarded as the first validated instrument to assess Internet addiction (Widyanto & McMurran, 2004), which was deemed as a reliable instrument that covers the significant traits of Pathological Internet Use (PIU). It has been validated in many languages, including English, Greek, Italian, French, Turkish, Chinese, and Korean (Chang & Law, 2008; Khazaal et al., 2008; Panayides & Walker, 2012; Yang, Choe, Baity, Lee & Cho, 2005; Young & Nabuco de Abreu, 2011), and can be adapted and applied in outpatient and inpatient settings (Young & Nabuco de Abreu, 2011). This study aimed to evaluate the psychometric properties of this popular instrument: Young's Internet Addiction Test (Young & Nabuco de Abreu, 2011)
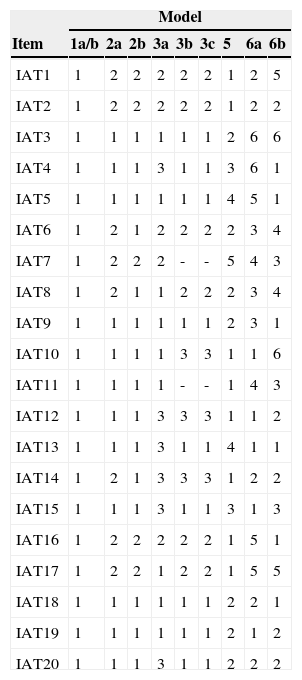
The psychological properties of IAT were examined in various countries and language versions, yielding satisfactory reliability and construct validity (Chang & Law, 2008; Khazaal et al., 2008; Ng, Isa, Hashim, Pillai, & Harbajan Singh, 2012; Yang et al., 2005; Widyanto & McMurran, 2004), but the result of construct of IAT using factor analysis was not consistent as shown in Table 1. For instance, Widyanto and McMurran (2004) extracted six factors (salience, excessive use, neglect work, anticipation, lack of control, and neglect social life) using exploratory factor analysis (EFA) in a sample of UK adults, while another study on UK college students found a three-factor model (psychological/emotional conflict, time-management problems, and mood modification; Widyanto, Griffiths, & Brunsden, 2011).
Factor Structure of IAT in the Prior Research.
| Model | |||||||||
|---|---|---|---|---|---|---|---|---|---|
| Item | 1a/b | 2a | 2b | 3a | 3b | 3c | 5 | 6a | 6b |
| IAT1 | 1 | 2 | 2 | 2 | 2 | 2 | 1 | 2 | 5 |
| IAT2 | 1 | 2 | 2 | 2 | 2 | 2 | 1 | 2 | 2 |
| IAT3 | 1 | 1 | 1 | 1 | 1 | 1 | 2 | 6 | 6 |
| IAT4 | 1 | 1 | 1 | 3 | 1 | 1 | 3 | 6 | 1 |
| IAT5 | 1 | 1 | 1 | 1 | 1 | 1 | 4 | 5 | 1 |
| IAT6 | 1 | 2 | 1 | 2 | 2 | 2 | 2 | 3 | 4 |
| IAT7 | 1 | 2 | 2 | 2 | - | - | 5 | 4 | 3 |
| IAT8 | 1 | 2 | 1 | 1 | 2 | 2 | 2 | 3 | 4 |
| IAT9 | 1 | 1 | 1 | 1 | 1 | 1 | 2 | 3 | 1 |
| IAT10 | 1 | 1 | 1 | 1 | 3 | 3 | 1 | 1 | 6 |
| IAT11 | 1 | 1 | 1 | 1 | - | - | 1 | 4 | 3 |
| IAT12 | 1 | 1 | 1 | 3 | 3 | 3 | 1 | 1 | 2 |
| IAT13 | 1 | 1 | 1 | 3 | 1 | 1 | 4 | 1 | 1 |
| IAT14 | 1 | 2 | 1 | 3 | 3 | 3 | 1 | 2 | 2 |
| IAT15 | 1 | 1 | 1 | 3 | 1 | 1 | 3 | 1 | 3 |
| IAT16 | 1 | 2 | 2 | 2 | 2 | 2 | 1 | 5 | 1 |
| IAT17 | 1 | 2 | 2 | 1 | 2 | 2 | 1 | 5 | 5 |
| IAT18 | 1 | 1 | 1 | 1 | 1 | 1 | 2 | 2 | 1 |
| IAT19 | 1 | 1 | 1 | 1 | 1 | 1 | 2 | 1 | 2 |
| IAT20 | 1 | 1 | 1 | 3 | 1 | 1 | 2 | 2 | 2 |
Note. 1a: derived from Khazaal et al., 2008 (EFA & CFA)
1b: derived from Korkeila, Kaarlas, Jaaskelainen, Vahlber, & Taiminen (2010). EFA
2a: F1 - dependent use; F2 - excessive use (Jelenchick, Becker, & Moreno, 2012). EFA
2b: F1 - salient use; F2-loss of control (Korkeila, Kaarlas, Jaaskelainen, Vahlberg & Taiminen, 2010). EFA
3a: F1 - psychological/emotional conflict; F2 - time-management problems; F3 - mood modification (Widyanto, Griffiths, & Brunsden, 2011). EFA
3b: F1 - withdrawal & social problems; F2 - time management & performance; F3 - reality substitute (Chang & Man Law, 2008). EFA & CFA
3c: F1 - withdrawal & social problems; F2-time management & performance; F3 - reality substitute (Lai, Mak, Watanabe, Ang, Pang, & Ho, 2013). CFA
5: F1 - lack of control; F2 - neglect of duty; F3 - problematic use; F4 - social relationship disruption; F5 - email privacy (Ng, Isa, Hashim, Pillai, & Harbajan Singh, 2012). EFA
6a: F1 - salience; F2 - excessive use; F3 - neglect work; F4 - anticipation; F5 - lack of control; F6 - neglect social life (Widyanto & McMurran, 2004). EFA
6b: F1 - compromised social quality of life; F2 - compromised individual quality of life; F3 - compensatory usage of the Internet; F4 - compromised academic/working careers;
F5 - compromised time control; F6 - excitatory usage of the Internet (Ferraro, Caci, D’Amico, & Di Blasi, 2007).
For the Italian version, Ferraro, Caci, D’Amico, and Di Blasi (2007) got a six-factor model (compromised social quality of life, compromised individual quality of life, compensatory usage of the Internet, compromised academic/working careers, compromised time control, and excitatory usage of the Internet). Chang and Law (2008) got a three-factor solution (withdrawal & social problems, time management & performance, and reality substitute) using both EFA and CFA for a bilingual version (Chinese and English), while a study on a sample of Chinese Adolescents confirmed and improved Chang and Law‘s (2008) three-factor model using CFA (Lai et al., 2013). Khazaal et al. (2008) only got one-factor solution for a French version. A recent study on US college students identified a two-factor model (dependent use and excessive use; Jelenchick, Becker, & Moreno, 2012). A study in Finland supported both a single factor and two-factor models using EFA. Finally, Ng et al. (2012) extracted five factors (lack of control, neglect of duty, problematic use, social relationship disruption, and email privacy) for a Malay version in a sample of 162 medical students by using EFA.
Besides the studies concentrated on the construct underlying IAT using factor analysis, the Rasch Model theory was also applied to assess the items of IAT, which was conducted in a sample of Cypriot high school students (Panayides & Walker, 2012). It is the only study in current literature to examine the psychometric properties of IAT in an alternative way, which found a satisfactory person reliability (.86) and item reliability (.99). The researcher further concluded that “all 20 items were sufficiently spread out and describe distinct levels along the variable and do define a linear continuum of increasing difficulty”. The unidimentionality and good construct validity of this scale was confirmed (Panayides & Walker, 2012). This study intended to employ the Rasch model to examine the items of a bilingual IAT version (Malay and English). Although the recent study in Malaysia got a five-factor model for the Malay version of IAT, the sample was restricted to medical students. This study also intended to explore the construct of IAT among a more varied sample, such as undergraduate students from various majors.
ObjectivesFirst, this study examined the items of IAT using Rasch Model analysis, which could check the rating scales and item quality. Second, linking to the previous studies and theories, the construct of IAT was explored. Last, this study identified the level of PIU and its sub-construct and examined the relationship of PIU and Internet use experience, time spent online, as well as the PIU sub-construct ‘salience’ for this sample.
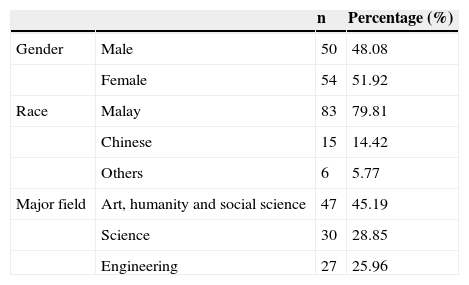
MethodSubjectsA total of 104 undergraduate students from Univerisiti Teknologi Malaysia (UTM) answered the questionnaire. As shown in Table 2, the sample consisted of 46 students from Arts, Humanity, and Social Science, 27 from Science and 27 from Engineering. There were 50 males and 54 females.
MeasureThe pencil-paper questionnaire used in this study was comprised by two parts: first, basic information of undergraduate students including gender, major field, time spent online per day, and years of Internet use; second, the Internet Addiction Test (IAT) —a 20-item self-report instrument used to measure an individual's Internet use from the perspective of psychological symptoms and behaviours, such as psychological dependence, compulsive use, withdrawal, problems of school, sleep, family, and time management. It was developed based on Young's YDQ (Young & Nabuco de Abreu, 2011; Young, 1996). The original English version of IAT was translated into Malay using translation and back translation procedures. Both English and Malay were shown in the questionnaire in this study. In Young and Nabuco de Abreu's latest book, Internet Addiction: A Handbook and Guide to Evaluation and Treatment, the items are rated on a six-point scale regarding participants’ experience of their Internet use: 0 = not applicable, 1 = rarely, 2 = occasionally, 3 = frequently, 4 = often, 5 = always. The score range is 0 to 100, and the higher score, the greater level of PIU. An individual who gets a total score between 0 and 30 is deemed as normal Internet user, between 31 and 49 mild Internet user, between 50 and 79 moderate PIU, and between 80 and 100 he is supposed to suffer from severe PIU. In this study, the individual who got 80 or above on IAT was categorized as PIU, the remaining were non-PIU.
Statistical AnalysesFirst, this study exmined the items of IAT using Winsteps, version 3.75.0, which is a Rasch Model analysis software. The Rasch Model theory is a kind of item response theory (IRT) which intends to measure item responses rather than total scores (Thissen, 2001). There are some critical concepts used in this study under Rasch Model analysis. Person fit in the Rasch model is an index of individual's response to items. People may be considered as “misfit” when they respond in an inconsistent manner because of feeling bored and inattentive to the task, confused, or an item evokes an unusually salient response from an individual (Linacre, 2012). Linacre (2012) suggested that the value of INFIT and OUTFIT MNSQ should be in the range of 0.6 and 1.4 for rating scales. Separation coefficient is the signal-to-noise ratio, the ratio of “true” variance to error variance. Person separation is used to classify people. Low person separation implies that the instrument may not be sensitive enough to distinguish person with high and low performance. More items may be needed. Item separation is used to verify the item hierarchy. Low item separation implies that the person sample is not large enough to confirm the item difficulty hierarchy of the instrument. This is analogous to the Fisher Discriminant Ratio. Reliability (separation index) is separation reliability. The person reliability is equivalent to KR-20, Cronbach's alpha coefficient. And the item reliability is equivalent to construct validity (Linacre, 2012).
Second, exploratory factor analysis (EFA) was conducted by Mplus, version 6. The EFA in Mplus could provide the goodness of fit statistics as CFA. This study took the following model fit index to evaluate the EFA model. First, there is the chi-square and degrees of freedom, which suggested that a model can be considered to fit well if χ2/df ratio is below 2. Second, the Root Mean Square Error of Approximation (RMSEA) suggested that the value between 0 and .05 indicated a good fit and between .05 and .08 indicated an acceptable one. Third, the Standardized Root Mean Square Residual (SRMR) was suggested to be in the range of .05 and .10 as acceptable, between 0 and .05 as good fit (Schermelleh-Engel & Moosbrugger, 2003). The fourth index is the Comparative Fit Index (CFI), which was suggested to be greater than .95 as good fit, and above .90 acceptable (Hu & Bentler, 1999). Last, there is the Tucker-Lewis Index (TLI), also known as the Non-normed Fit Index, (NNFI), whose value was recommended to be greater than .95 as good fit (Hu & Bentler, 1999).
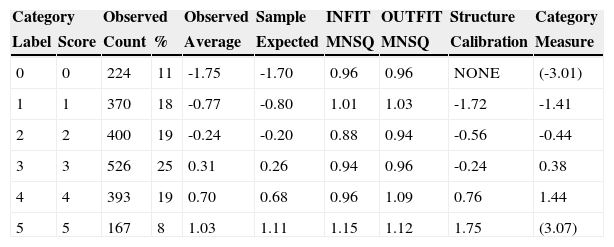
ResultsRasch Model Analysis on ItemsTo examine the rating scale with six categories, the result of category structure for IAT is shown in Table 3. The observed average measure increases with the category score (-1.75, -0.77, -0.24, 0.31, 0.70 and 1.03 for categories 1, 2, 3, 4, and 5 respectively) and is close to sample expected value. The value of structure calibration also increases with the category value, which indicated that there was no disordered category. The value of INFIT and OUTFIT is close to 1 on categories 1, 2, 3, 4, and 5 (from 0.88 to 1.15).
Category Structure.
| Category | Observed | Observed | Sample | INFIT | OUTFIT | Structure | Category | ||
|---|---|---|---|---|---|---|---|---|---|
| Label | Score | Count | % | Average | Expected | MNSQ | MNSQ | Calibration | Measure |
| 0 | 0 | 224 | 11 | -1.75 | -1.70 | 0.96 | 0.96 | NONE | (-3.01) |
| 1 | 1 | 370 | 18 | -0.77 | -0.80 | 1.01 | 1.03 | -1.72 | -1.41 |
| 2 | 2 | 400 | 19 | -0.24 | -0.20 | 0.88 | 0.94 | -0.56 | -0.44 |
| 3 | 3 | 526 | 25 | 0.31 | 0.26 | 0.94 | 0.96 | -0.24 | 0.38 |
| 4 | 4 | 393 | 19 | 0.70 | 0.68 | 0.96 | 1.09 | 0.76 | 1.44 |
| 5 | 5 | 167 | 8 | 1.03 | 1.11 | 1.15 | 1.12 | 1.75 | (3.07) |
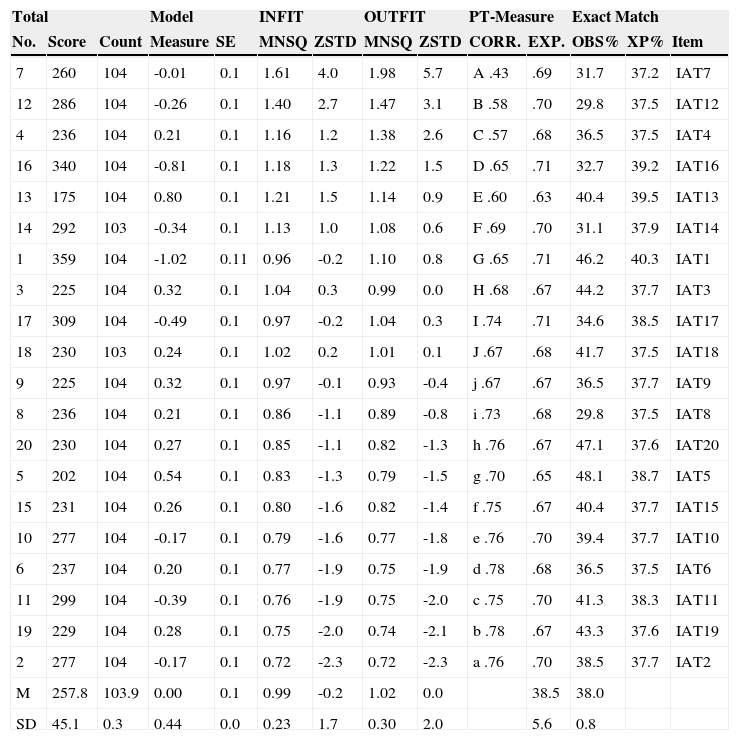
Table 4 is the Rasch analysis result of item fit statistics in misfit order, which showed that all the point-measure correlations (CORR.) are positive and high, range from .43 to .78, and all are close to the expected correlation (EXP.). It implied that all the items are aligned with the abilities of person. The infit and outfit mean-square (MNSQ) values in Table 4 showed that all the items fit the Rasch model very well with mean infit and outfit of 0.99 and 1.02 respectively, except IAT 7 and IAT 12 with higher infit and outfit MNSQ (> 1.40). Further examination on a person's performance of items found that the misfit on IAT 7 and IAT 12 was due to the abnormal response from five students. The infit and outfit MNSQ of IAT 7 and IAT 12 dropped below the cut-off value of 1.4 (IAT 7: 1.39 and 1.35; IAT 12: 1.35 and 1.38) once the response of these five students was removed from the dataset. Therefore, IAT 7 and IAT 12 could be kept, as the misfit was caused by the unexpected responses of five students.
Item Fit Statistics of IAT in Misfit Order.
| Total | Model | INFIT | OUTFIT | PT-Measure | Exact Match | ||||||||
|---|---|---|---|---|---|---|---|---|---|---|---|---|---|
| No. | Score | Count | Measure | SE | MNSQ | ZSTD | MNSQ | ZSTD | CORR. | EXP. | OBS% | XP% | Item |
| 7 | 260 | 104 | -0.01 | 0.1 | 1.61 | 4.0 | 1.98 | 5.7 | A .43 | .69 | 31.7 | 37.2 | IAT7 |
| 12 | 286 | 104 | -0.26 | 0.1 | 1.40 | 2.7 | 1.47 | 3.1 | B .58 | .70 | 29.8 | 37.5 | IAT12 |
| 4 | 236 | 104 | 0.21 | 0.1 | 1.16 | 1.2 | 1.38 | 2.6 | C .57 | .68 | 36.5 | 37.5 | IAT4 |
| 16 | 340 | 104 | -0.81 | 0.1 | 1.18 | 1.3 | 1.22 | 1.5 | D .65 | .71 | 32.7 | 39.2 | IAT16 |
| 13 | 175 | 104 | 0.80 | 0.1 | 1.21 | 1.5 | 1.14 | 0.9 | E .60 | .63 | 40.4 | 39.5 | IAT13 |
| 14 | 292 | 103 | -0.34 | 0.1 | 1.13 | 1.0 | 1.08 | 0.6 | F .69 | .70 | 31.1 | 37.9 | IAT14 |
| 1 | 359 | 104 | -1.02 | 0.11 | 0.96 | -0.2 | 1.10 | 0.8 | G .65 | .71 | 46.2 | 40.3 | IAT1 |
| 3 | 225 | 104 | 0.32 | 0.1 | 1.04 | 0.3 | 0.99 | 0.0 | H .68 | .67 | 44.2 | 37.7 | IAT3 |
| 17 | 309 | 104 | -0.49 | 0.1 | 0.97 | -0.2 | 1.04 | 0.3 | I .74 | .71 | 34.6 | 38.5 | IAT17 |
| 18 | 230 | 103 | 0.24 | 0.1 | 1.02 | 0.2 | 1.01 | 0.1 | J .67 | .68 | 41.7 | 37.5 | IAT18 |
| 9 | 225 | 104 | 0.32 | 0.1 | 0.97 | -0.1 | 0.93 | -0.4 | j .67 | .67 | 36.5 | 37.7 | IAT9 |
| 8 | 236 | 104 | 0.21 | 0.1 | 0.86 | -1.1 | 0.89 | -0.8 | i .73 | .68 | 29.8 | 37.5 | IAT8 |
| 20 | 230 | 104 | 0.27 | 0.1 | 0.85 | -1.1 | 0.82 | -1.3 | h .76 | .67 | 47.1 | 37.6 | IAT20 |
| 5 | 202 | 104 | 0.54 | 0.1 | 0.83 | -1.3 | 0.79 | -1.5 | g .70 | .65 | 48.1 | 38.7 | IAT5 |
| 15 | 231 | 104 | 0.26 | 0.1 | 0.80 | -1.6 | 0.82 | -1.4 | f .75 | .67 | 40.4 | 37.7 | IAT15 |
| 10 | 277 | 104 | -0.17 | 0.1 | 0.79 | -1.6 | 0.77 | -1.8 | e .76 | .70 | 39.4 | 37.7 | IAT10 |
| 6 | 237 | 104 | 0.20 | 0.1 | 0.77 | -1.9 | 0.75 | -1.9 | d .78 | .68 | 36.5 | 37.5 | IAT6 |
| 11 | 299 | 104 | -0.39 | 0.1 | 0.76 | -1.9 | 0.75 | -2.0 | c .75 | .70 | 41.3 | 38.3 | IAT11 |
| 19 | 229 | 104 | 0.28 | 0.1 | 0.75 | -2.0 | 0.74 | -2.1 | b .78 | .67 | 43.3 | 37.6 | IAT19 |
| 2 | 277 | 104 | -0.17 | 0.1 | 0.72 | -2.3 | 0.72 | -2.3 | a .76 | .70 | 38.5 | 37.7 | IAT2 |
| M | 257.8 | 103.9 | 0.00 | 0.1 | 0.99 | -0.2 | 1.02 | 0.0 | 38.5 | 38.0 | |||
| SD | 45.1 | 0.3 | 0.44 | 0.0 | 0.23 | 1.7 | 0.30 | 2.0 | 5.6 | 0.8 | |||
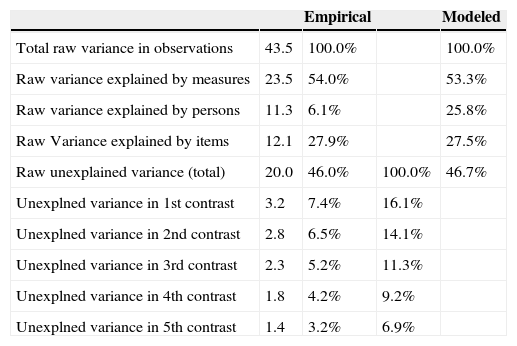
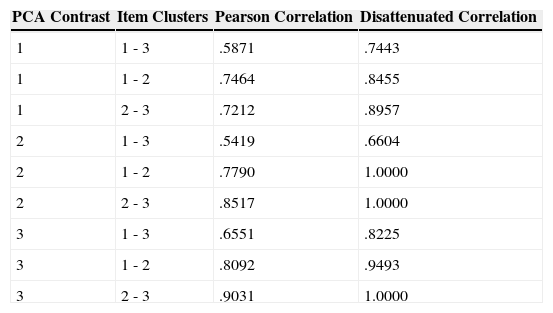
The result of Rasch principal component analysis (PCA) in Table 5 indicated that the raw variance in observations of IAT was 54%, with 23.5 eigenvalue units. The unexplained variance in the first contrast was 7.4%, with 3.2 0.500 units; the second contrast was 6.5%, with 2.8 0.500 units; and the third contrast was 5.2%, with 2.3 eigenvalue units. The 0.500 units of first, second, and third contrast are bigger than 2.0, which implied that IAT may be multidimensional with items measuring different constructs. To further test the unidimensionality of IAT, the items were segmented into subtests according to the cluster numbers to perform the disattenuated correlation on person measures, which got significant high positive value of disattenuated correlation, ranging from .6604 to 1.00 (Table 6). The high positive disattenuated correlation implied that the person measures on the different clusters of items are statistically the same, which implied that the three clusters of items measure the same thing. Based on the result of PCA and attenuated correlation, all the items of IAT measure the same construct with four subdimensions, which suggested to identify the sub-construct of IAT.
Standardized Residual Variance of IAT (in Eigenvalue Units).
| Empirical | Modeled | |||
|---|---|---|---|---|
| Total raw variance in observations | 43.5 | 100.0% | 100.0% | |
| Raw variance explained by measures | 23.5 | 54.0% | 53.3% | |
| Raw variance explained by persons | 11.3 | 6.1% | 25.8% | |
| Raw Variance explained by items | 12.1 | 27.9% | 27.5% | |
| Raw unexplained variance (total) | 20.0 | 46.0% | 100.0% | 46.7% |
| Unexplned variance in 1st contrast | 3.2 | 7.4% | 16.1% | |
| Unexplned variance in 2nd contrast | 2.8 | 6.5% | 14.1% | |
| Unexplned variance in 3rd contrast | 2.3 | 5.2% | 11.3% | |
| Unexplned variance in 4th contrast | 1.8 | 4.2% | 9.2% | |
| Unexplned variance in 5th contrast | 1.4 | 3.2% | 6.9% |
Approximate Relationships between the Person Measures.
| PCA Contrast | Item Clusters | Pearson Correlation | Disattenuated Correlation |
|---|---|---|---|
| 1 | 1 - 3 | .5871 | .7443 |
| 1 | 1 - 2 | .7464 | .8455 |
| 1 | 2 - 3 | .7212 | .8957 |
| 2 | 1 - 3 | .5419 | .6604 |
| 2 | 1 - 2 | .7790 | 1.0000 |
| 2 | 2 - 3 | .8517 | 1.0000 |
| 3 | 1 - 3 | .6551 | .8225 |
| 3 | 1 - 2 | .8092 | .9493 |
| 3 | 2 - 3 | .9031 | 1.0000 |
The overall property of IAT showed high person and item separation (3.52 and 4.61 respectively) corresponding to person reliability of .93 and item reliability of .95. The high person separation indicated the students were separated into more than three groups by IAT, while the high item reliability meant that the item ability was widely spread, and could distinguish approximately five different levels of Internet addiction.
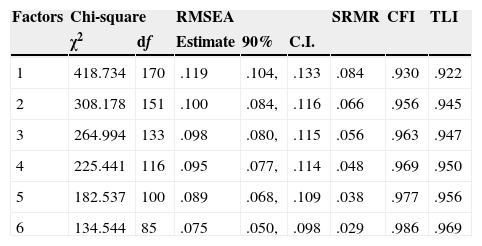
Exploratory Factor AnalysisExploratory factor analysis (IAT) was run in Mplus v. 6. to identify the underlying sub-construct of IAT using weight least square with mean and variance (WLSMV) estimation. As previous research have found one- to six-factor solutions, this research identified the one- to six-factor models respectively using oblique direct quartimin rotation. The goodness-of-fit of the six EFA models are listed in Table 7, which indicates that a 6-factor model is fit better and acceptable (χ2/df < 2, RMSEA = .075, SRMR = .029, CFI = .986, TLI = .969).
Goodness of Fit EFA 1-6 Factors.
| Factors | Chi-square | RMSEA | SRMR | CFI | TLI | |||
|---|---|---|---|---|---|---|---|---|
| χ2 | df | Estimate | 90% | C.I. | ||||
| 1 | 418.734 | 170 | .119 | .104, | .133 | .084 | .930 | .922 |
| 2 | 308.178 | 151 | .100 | .084, | .116 | .066 | .956 | .945 |
| 3 | 264.994 | 133 | .098 | .080, | .115 | .056 | .963 | .947 |
| 4 | 225.441 | 116 | .095 | .077, | .114 | .048 | .969 | .950 |
| 5 | 182.537 | 100 | .089 | .068, | .109 | .038 | .977 | .956 |
| 6 | 134.544 | 85 | .075 | .050, | .098 | .029 | .986 | .969 |
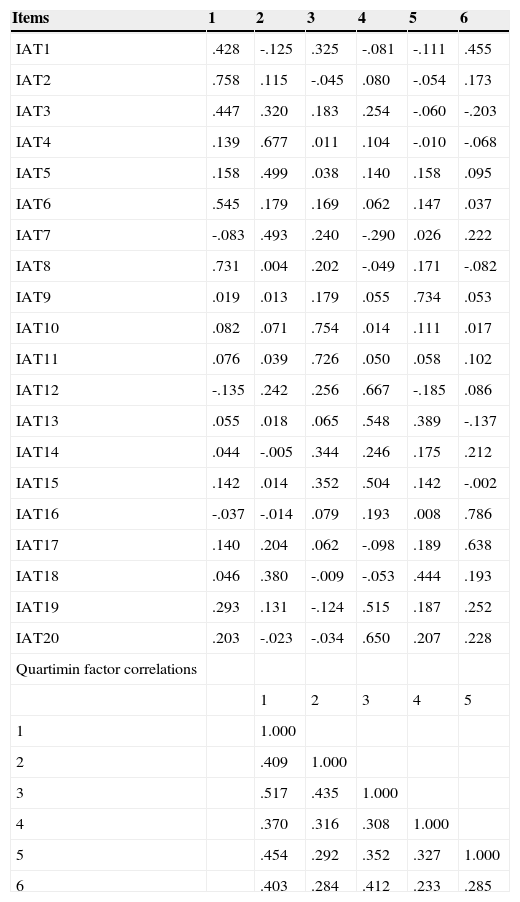
The factor loading and correlations of the 6-factor model are shown in Table 8. All items had strong primary loadings on their corresponding factors, ranging from .344 to .786. There were four salient cross-loading items that were IAT1, IAT13, IAT15, and IAT18. All the six factors were correlated weakly to moderately (r = .233 -.517).
Factor Loadings and Correlations for Exploratory Factor Analyses.
| Items | 1 | 2 | 3 | 4 | 5 | 6 |
|---|---|---|---|---|---|---|
| IAT1 | .428 | -.125 | .325 | -.081 | -.111 | .455 |
| IAT2 | .758 | .115 | -.045 | .080 | -.054 | .173 |
| IAT3 | .447 | .320 | .183 | .254 | -.060 | -.203 |
| IAT4 | .139 | .677 | .011 | .104 | -.010 | -.068 |
| IAT5 | .158 | .499 | .038 | .140 | .158 | .095 |
| IAT6 | .545 | .179 | .169 | .062 | .147 | .037 |
| IAT7 | -.083 | .493 | .240 | -.290 | .026 | .222 |
| IAT8 | .731 | .004 | .202 | -.049 | .171 | -.082 |
| IAT9 | .019 | .013 | .179 | .055 | .734 | .053 |
| IAT10 | .082 | .071 | .754 | .014 | .111 | .017 |
| IAT11 | .076 | .039 | .726 | .050 | .058 | .102 |
| IAT12 | -.135 | .242 | .256 | .667 | -.185 | .086 |
| IAT13 | .055 | .018 | .065 | .548 | .389 | -.137 |
| IAT14 | .044 | -.005 | .344 | .246 | .175 | .212 |
| IAT15 | .142 | .014 | .352 | .504 | .142 | -.002 |
| IAT16 | -.037 | -.014 | .079 | .193 | .008 | .786 |
| IAT17 | .140 | .204 | .062 | -.098 | .189 | .638 |
| IAT18 | .046 | .380 | -.009 | -.053 | .444 | .193 |
| IAT19 | .293 | .131 | -.124 | .515 | .187 | .252 |
| IAT20 | .203 | -.023 | -.034 | .650 | .207 | .228 |
| Quartimin factor correlations | ||||||
| 1 | 2 | 3 | 4 | 5 | ||
| 1 | 1.000 | |||||
| 2 | .409 | 1.000 | ||||
| 3 | .517 | .435 | 1.000 | |||
| 4 | .370 | .316 | .308 | 1.000 | ||
| 5 | .454 | .292 | .352 | .327 | 1.000 | |
| 6 | .403 | .284 | .412 | .233 | .285 |
Note. F1 = tolerance, time management problems & neglect of duty.
F2 = neglect of social life
F3 = problematic use & reality substitute
F4 = withdraw & emotional conflict
F5 = intentionally concealing behavior
F6 = lack of control
Factor 1, named as tolerance, time management problems, and neglect of duty, comprised four items (IAT2, IAT 3, IAT6, IAT8). Factor 2, termed neglect of social life, consisted of three items (IAT4, IAT5, IAT7). Factor 3, named problematic use and reality substitute, contained three items (IAT 10, IAT11, IAT14). Factor 4 was termed as withdraw and emotional conflict, and contained five items (IAT 12, IAT13, IAT15, IAT19, IAT20). Factor 5, namely, intentionally concealing behavior, had two items (IAT 9, IAT18). Factor 6, termed lack of control, comprised three items (IAT1, IAT16, IAT17).
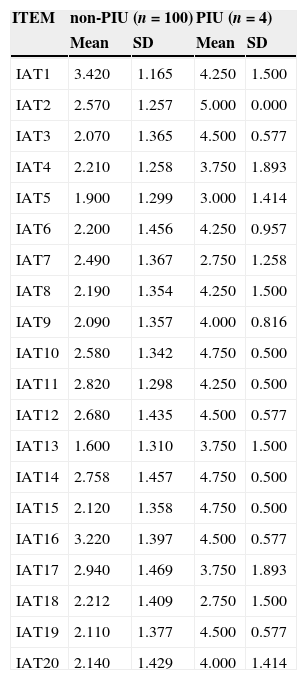
IAT Overall, Factor Subscale Scores and Relationship With Internet Use StatusThe overall mean IAT score was 49.567 ± 19.323. Result of two- way ANOVA without interaction showed that there were no significant main effect of gender F(1, 100) = 3.838, p = .053 and major field F(2, 100) = 0.554, p = .576 on overall IAT mean score. There were only four students reported the overall IAT score above 80, who were categorized as PIU. As shown in Table 9, the mean item scores ranged from 1.600 ± 1.310 to 3.220 ± 1.397 for the non-PIU students and from 2.750 ± 1.258 to 5.000 ± 0.000 for PIU students.
Internet Addiction Test (IAT) Item Scores of non-PIU and PIU.
| ITEM | non-PIU (n = 100) | PIU (n = 4) | ||
|---|---|---|---|---|
| Mean | SD | Mean | SD | |
| IAT1 | 3.420 | 1.165 | 4.250 | 1.500 |
| IAT2 | 2.570 | 1.257 | 5.000 | 0.000 |
| IAT3 | 2.070 | 1.365 | 4.500 | 0.577 |
| IAT4 | 2.210 | 1.258 | 3.750 | 1.893 |
| IAT5 | 1.900 | 1.299 | 3.000 | 1.414 |
| IAT6 | 2.200 | 1.456 | 4.250 | 0.957 |
| IAT7 | 2.490 | 1.367 | 2.750 | 1.258 |
| IAT8 | 2.190 | 1.354 | 4.250 | 1.500 |
| IAT9 | 2.090 | 1.357 | 4.000 | 0.816 |
| IAT10 | 2.580 | 1.342 | 4.750 | 0.500 |
| IAT11 | 2.820 | 1.298 | 4.250 | 0.500 |
| IAT12 | 2.680 | 1.435 | 4.500 | 0.577 |
| IAT13 | 1.600 | 1.310 | 3.750 | 1.500 |
| IAT14 | 2.758 | 1.457 | 4.750 | 0.500 |
| IAT15 | 2.120 | 1.358 | 4.750 | 0.500 |
| IAT16 | 3.220 | 1.397 | 4.500 | 0.577 |
| IAT17 | 2.940 | 1.469 | 3.750 | 1.893 |
| IAT18 | 2.212 | 1.409 | 2.750 | 1.500 |
| IAT19 | 2.110 | 1.377 | 4.500 | 0.577 |
| IAT20 | 2.140 | 1.429 | 4.000 | 1.414 |
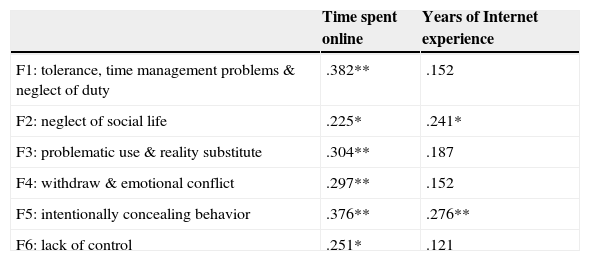
Table 10 provided the correlation of six IAT factors, time spent online per day and years of Internet experience, which showed that time spent online per day was significantly related to each IAT factors, while years of Internet experience was significantly correlated to two IAT factors (F2: neglect of social life; F5: intentionally concealing behavior).
Correlations among IAT Factor Subscale, Time Spent Online, and Internet Experience.
| Time spent online | Years of Internet experience | |
|---|---|---|
| F1: tolerance, time management problems & neglect of duty | .382** | .152 |
| F2: neglect of social life | .225* | .241* |
| F3: problematic use & reality substitute | .304** | .187 |
| F4: withdraw & emotional conflict | .297** | .152 |
| F5: intentionally concealing behavior | .376** | .276** |
| F6: lack of control | .251* | .121 |
*p < .05, **p < .01
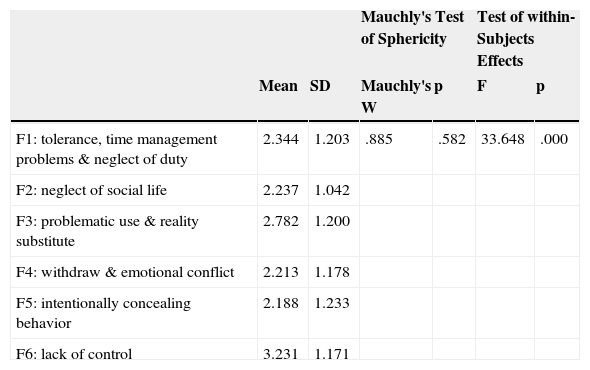
As the number of items in IAT factor subscales was not identical, this study computed the mean of IAT factor instead of the total factor scores. As shown in Table 11, the undergraduate students in this study reported a highest mean score in lack of control, followed by problematic use & reality substitute, tolerance, time management problems & neglect of duty, neglect of social life, withdraw & emotional conflict, and intentionally concealing behavior. The followed up pairwise comparisons showed that lack of control reported significantly higher score compared with other IAT factor subscale scores (mean difference with F1 = .887, p =.000; mean difference with F2 = .994, p = .000; mean difference with F3 = .449, p = .000; mean difference with F4 = 1.017, p = .000; mean difference with F5 = 1.403, p = .000). The problematic use & reality substitute was reported as the second higher factor subscale score (mean difference with F1 = .438, p = .000; mean difference with F2 = .545, p = .000; mean difference with F4 = .569, p = .000; mean difference with F5 = .595, p = .000; mean difference with F6 = -.449, p = .000).
Repeated-Measure ANOVA for IAT factor subscale.
| Mauchly's Test of Sphericity | Test of within-Subjects Effects | |||||
|---|---|---|---|---|---|---|
| Mean | SD | Mauchly's W | p | F | p | |
| F1: tolerance, time management problems & neglect of duty | 2.344 | 1.203 | .885 | .582 | 33.648 | .000 |
| F2: neglect of social life | 2.237 | 1.042 | ||||
| F3: problematic use & reality substitute | 2.782 | 1.200 | ||||
| F4: withdraw & emotional conflict | 2.213 | 1.178 | ||||
| F5: intentionally concealing behavior | 2.188 | 1.233 | ||||
| F6: lack of control | 3.231 | 1.171 | ||||
The first main objective of this study was to examine the item of IAT using Rasch Model analysis. It first evaluated the 6-point rating scale which did not find any disordered category. The 6-point rating scale was psychometrically optimal. There was only one study using Rasch Model to examine a Greek version of IAT, which found that collapsing the three middle categories into one to become 3-point rating scale performed better than 5-point rating scale (Panayides & Walker, 2012). As this study provided a satisfactory result of category structure test, it is not necessary to collapse any category to become 3-point rating scale. Thus, this study kept the 6-point rating scale which was applicable for this bilingual version IAT.
For the item fit statistics, this study found two misfit items (IAT7 and IAT12) at first, but the value of infit and outfit MNSQ dropped to the normal range once it removed the unexpected responses. It was same as Panayides and Walker (2012), which kept the IAT7 after removing the unexpected responses from the dataset.
Panayides and Walker (2012) reported 40.8% of total variance (eigenvalue 13.8) for principal component analysis (PCA) and provided the evidence of unidimensional structure of IAT. This study reported a higher variance explained by the measure of 20- item IAT (54%, eigenvalue 23.5) units. The unidimensional structure of IAT was also supported by this study.
Panayides and Walker (2012) found a satisfactory person and item separation (2.48 and 3.64 respectively) for the modified 20- item Greek version IAT (3-point rating scale), which was deemed as an effective measurement. This study also found a high person and item separation (3.52 and 4.61 respectively) and supported that the bilingual version IAT used in this study is a reliable instrument to assess the PIU.
Exploratory Factor Analysis for IAT Factor StructureAs previous studies have found one- to six-factor model for IAT, this study examined the one- to six-factor solution using EFA respectively, and found that the six-factor model was fit better compared to other five models. The different factor model found in the past research and this study may be influenced by the different culture and sample's background. Widyanto and McMurran (2004) first identified a six-factor model among UK college students, and another six-factor model was identified using a more distinct age group (between 13 and 50 years old) for an Italian version (Ferraro et al., 2007). The three-factor model was always identified for the bilingual (Chinese and English) version IAT by a Chinese sample (Chang & Man Law, 2008; Lai et al., 2013). Despite the different factor arrangement among the six-factor model in previous research and in this study, the major underlying structure of IAT is consistent. For instance, F6 - lack of control in this study was quite similar as Widyanto and McMurran's (2004) “lack of control” factor and Ferraro et al.’s (2007) “comprised time control”, where the majority of item arrangement was consistent for the factor about Internet use control in previous research and this study.
The salient difference of this study and the previous six-factor models was that this study identified IAT9 and IAT18 as one factor named intentionally “concealing behaviour”. IAT 9 is “defensive or secretive when anyone asks you what do you online”, while IAT 18 is “hid how long you have been online”. Both items in IAT are related to hide the real Internet use of individual including content and time spent. Previous research arranged these two items in “excessive use” of six-factor model (Widyanto & McMurran, 2004), “neglect of duty” of five-factor model (Ng et al., 2012), “withdrawal & social problem” of three-factor model (Chang & Man Law, 2008; Lai et al., 2013), “psychological/emotional conflict” of three-factor model (Widyanto et al., 2011), “salient use” of two-factor model (Korkeila, Kaarlas, Jaaskelainen, Vahlberg, & Taiminen, 2010), dependent use of two- factor model (Jelenchick et al., 2012). Although there was certain connection between these two items and the factors listed above, the IAT 9 and IAT18 were clearly grouped as a factor of intentionally concealing behaviour in this study that was consistent with DiNicola's (2004) sixth criterion of PIU. Thus, this study suggested keeping the IAT9 and IAT18 to construct one of the underlying structures.
The recent study for a Malay version IAT only extracted five factors among medicine students (lack of control, neglect of duty, problematic use, social relationship disruption, and email privacy) (Ng et al., 2012). One of the factors, “email privacy”, was only constituted by one item IAT7, which was suggested to be dropped. Although this study also examined the structure of IAT (Malay and English version) using EFA as Ng et al. (2012), the discrepancy of this study and Ng et al.’s (2012) may be due to the different estimation method and rotation type for EFA, as well as the sample constitution. Despite the different amount of factors extracted by this study and Ng et al.’s (2012), the F1-tolerance, time management problems & neglect of duty and F6-lack of control identified in this study contained items that loaded on Ng et al.’s “lack of control” and “neglect of duty” factors. The salience cross-loading was also identified in this study, which are IAT1, IAT3, IAT13, and IAT15. Three of them (IAT13, IAT15, IAT18) were also found to be loaded on more than one factor in Ng et al.’s (2012) study.
Based on the EFA result of primary factor loading and the previous models, this study suggested a six-factor model to be applicable for undergraduate students. The underlying construct of IAT should include tolerance, time management problems & neglect of duty, neglect of social life, problematic use & reality substitute, withdraw & emotional conflict, intentionally concealing behavior, and lack of control.
IAT Overall, Factor Subscale Scores, and Relationship with Internet Use StatusCompared to the study on the US college students which also used the 6-point rating scale of IAT (Jelenchick et al., 2012), the undergraduate students in this study reported extremely higher overall scores in IAT (US: 28.4 ± 10.3 vs Malaysia: 49.567 ± 19.323). It is difficult to identify the reason of this huge discrepancy between US college students and Malaysian students in the current study, which implied a further study on the culture difference in Internet use. But the extremely higher overall scores in IAT for Malaysian undergraduate students did call for the attention from the Ministry of Higher Education Malaysia and universities on their students’ Internet use.
Differently from Chang and Man Law's (2008), this study found significantly positive relationship between time spent online per day and each factor subscales of IAT. Chang and Man Law (2008) only found the significant positive relationship of “reality substitute” factors and time spent online. The relationship found in this study and the study of Chang and Man Law were weak, which indicated that time spent online did play a role in developing PIU, but not the sole criterion. And the relationship between the years of Internet experience and three factor subscales of IAT was not identified (Chang & Man Law, 2008). Slightly differently, this study found that there were a significantly positive relationship between the years of Internet experience and two factor subscales (neglect of social life and intentionally concealing behavior), but it was weak. It implied that individual tended to ignore their real social relationship and hide their behavior of Internet use by their increasing years of experiences with Internet.
F6 - lack of control and F3 - problematic use & reality substitute were identified as the salient factor subscales of IAT in this study, which revealed that the symptoms of PIU, as measured by IAT, were acted sharply compared with other four factors. It further implied that lack of control and problematic use & reality substitute were two major criteria of PIU.
Conclusion and Future StudyThe Rasch model analysis on the items of the bilingual version IAT (Malay and English) provided evidences of good instrument on assessing PIU. The EFA showed a six-factor model of IAT. The positive relationships of time spent online and the subconstructs of IATwere confirmed. A bigger sample size was recommended in the future study, using CFA in order to further confirm the construct underlying IAT in Malaysia context.
Resumen ampliadoEl objetivo de este estudio es analizar las propiedades psicométricas del Test de Adicción a Internet (IAT). Una muestra de 104 alumnos de la Universiti Teknologi Malaysia (UTM) cumplimentaron el cuestionario de papel y lápiz. La muestra estaba compuesta por 46 alumnos de Letras, Humanidades y Ciencias Sociales, 27 de Ciencias y 27 de Ingenierías. Por sexo, 50 eran hombres y 54 mujeres.
El cuestionario de papel y lápiz utilizado en el estudio tenía dos partes, una con información básica sobre los alumnos, como el sexo, la carrera, el tiempo diario conectados a Internet y los años de experiencia en el uso de Internet. La segunda parte la constituye el test IAT propiamente, un autoinforme de 20 ítems que mide el uso individual de Internet desde el punto de vista de los síntomas y comportamientos psicológicos, tales como la dependencia psicológica, el uso compulsivo y la abstinencia, problemas con el alcohol, sueño, familia y gestión del tiempo. Se tradujo al malayo la versión original en inglés, siguiéndose el procedimiento de traducción y traducción inversa. En este estudio se mostraron las versiones en ambos idiomas. Los ítems se valoran en una escala de 6 puntos que mide la experiencia del participante en el uso de Internet. El rango de puntuaciones va de 0 a 100; a mayor puntuación mayor experiencia en el uso patológico de Internet (PIU). Una persona que obtenga una puntuación total entre 50 y 79 se considera que sufre un moderado PIU y entre 80 y 100 un PIU grave. En este estudio, la persona que obtenga 80 o más en el IAT se considera como PIU; el resto se consideran no PIU.
El análisis del modelo de Rasch aplicado a los ítems mostró que era óptima la escala de valoración de 6 puntos. El análisis de componentes principales (PCA) y la correlación atenuada confirmaron que el IAT tiene una estructura unidimensional, lo que indica que todos los ítems miden el mismo constructo, aunque implicaba identificar el subconstructo del IAT. El análisis del modelo de Rasch puso de manifiesto que el IAT era un buen instrumento, fiable, para analizar el PIU. El constructo que subyacía al IAT se analizó mediante un análisis factorial exploratorio (EFA) que encontró un modelo de 6 factores como el modelo de mejor ajuste (tolerancia, problemas de gestión de tiempo y descuido de las obligaciones, descuido de la vida social, utilización problemática y sustitución de la realidad, abstinencia y conflictos emocionales, ocultación intencionada de comportamientos y falta de control). Se vio que el tiempo empleado online correlacionaba significativa, aunque débilmente, con cada una de las subescalas factores del IAT. Los factores de falta de control y utilización problemática y sustitución de la realidad constituían dos estructuras destacadas subyacentes del IAT en este estudio.
La discusión, comparando el resultado de este estudio con otros hallazgos, indica que a pesar de las ligeras diferencias en los resultados al validar al IAT mediante el análisis del modelo de Rasch, mayormente eran congruentes en cuanto a la estructura unidimensional del IAT utilizado en este estudio y en la gran separación de los sujetos y de los ítems. La versión bilingüe del IAT que se ha utilizado en este estudio es un instrumento fiable para evaluar el PIU.
Si bien los estudios previos han hallado un modelo de IAT de entre uno y seis factores, este estudio ha encontrado que el modelo de seis factores es el mejor. La incongruencia de los resultados de la investigación previa en relación a los de este estudio puede explicarse por la cultura diferente y el bagaje de la muestra. A pesar de la diferente disposición de factores en el modelo de seis factores en la investigación previa y en ese estudio, la principal estructura subyacente es congruente. Por ejemplo, el factor “falta de control” en este estudio era bastante parecido al factor homónimo de Wydanto y McMurran (2004) y al factor de “control del tiempo”; la mayor parte de la disposición de los ítems era congruente para el factor “control del uso de Internet” en la investigación previa y en esta.
La diferencia más notable de este estudio y de los modelos previos de seis factores era que el primero identificó el IAT9 y el IAT18 como un único factor, designado como comportamiento ocultado intencionadamente. El IAT9 es “ser defensivo o con secretos cuando alguien te pregunta por lo que haces cuando estás conectado” y el IAT18, “cuánto tiempo has estado conectado”. Ambos ítems del IAT se relacionan con la ocultación del uso real de Internet de aspectos tales como el contenido y el tiempo transcurrido (conectado). De acuerdo con la revisión de los estudios previos, este estudio recomienda mantener el IAT9 y el IAT18 para construir una de las estructuras subyacentes.
En comparación con los alumnos universitarios norteamericanos (Jelenchick, Becker y Moreno, 2012), las puntuaciones globales mucho más elevadas en el IAT de los alumnos malayos (norteamericanos: 28.4 ± 10.3 vs malayos: 49.567 ± 19.323) son una llamada de atención al Ministerio de Educación malayo y a las universidades sobre el uso de Internet por parte de los alumnos.
A diferencia del estudio Chan y Man Law (2008), este halló relaciones positivas significativas entre el tiempo diario transcurrido conectado y cada una de las subescalas factores del IAT. Dichos autores sólo encontraron una relación positiva significativa de los factores “substitución de la realidad” y “tiempo transcurrido conectado”. La relación hallada en este estudio y en el de Chang y Man Law era débil, lo cual indicaba que el tiempo transcurrido online no jugaba un papel en el desarrollo del PIU, no siendo el único criterio. Este estudio también halló una relación positiva significativa entre los años de experiencia de Internet y dos subescalas factor (descuido de la vida social y la conducta ocultada intencionadamente), aunque débil, lo cual implicaba que la persona tendía a soslayar su relación social real y a ocultar su comportamiento de utilización de Internet a través de sus muchos años de experiencia en Internet.
La falta de control y el uso problemático y sustitutivo de la realidad se identificaron como las escalas factor del IAT en este estudio, lo cual revelaba que los síntomas de PIU, tal y como lo mide el IAT, se manifestaban de modo directo en comparación con los otros cuatro factores, lo que abunda en la conclusión de que la falta de control y el uso problemático y sustitución de la realidad eran dos criterios importantes del PIU.
Conflict of InterestThe authors of this article declare no conflict of interest.


