To perform an external validation of Euroscore I, Euroscore II and SAPS III.
Patients and methodRetrospective cohort study over three years on all adult patients who underwent cardiac surgery. We reviewed the clinical data, following the patient until outcome or discharge from hospital (dead, alive). We computed the predicted mortality by Euroscore I (EI), II (EII) and SAPS III. The model validation was assessed by discrimination: area under curve ROC; and calibration (Hosmer–Lemeshow test).
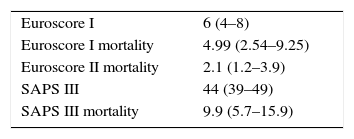
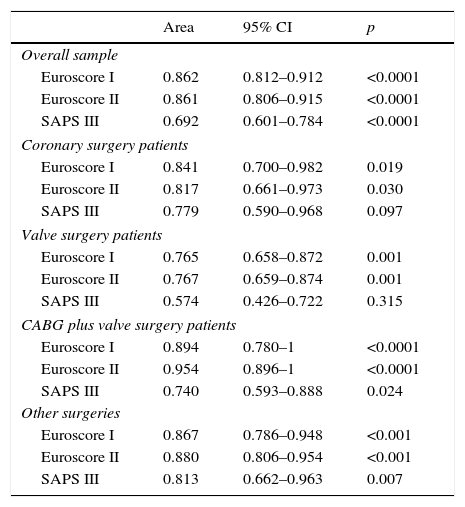
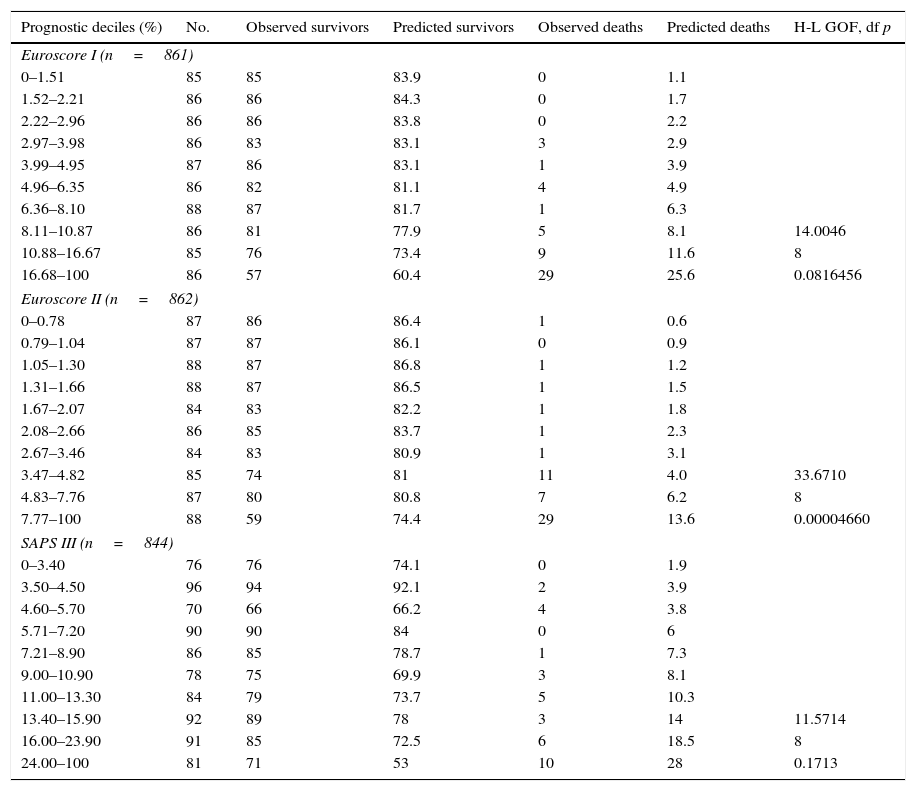
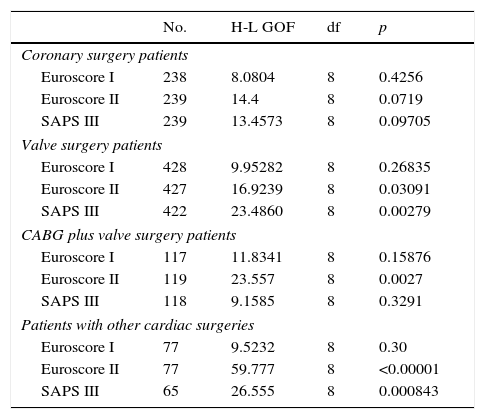
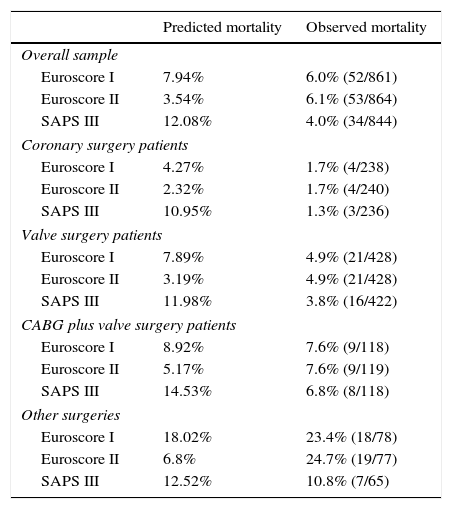
Results866 patients were included. 62.5% of them male, with a median age of 69 years, 6.1% died during hospitalization. Predicted mortality: E I 7.94%, E II 3.54, SAPS III 12.1%. Area under curve (95% IC): E I 0.862 (0.812–0.912); E II 0.861 (0.806–0.915); SAPS III 0.692 (0.601–0.784). Hosmer–Lemeshow test: E I 14.0046 (p=0.08164); E II 33.67 (p=0.00004660); SAPS III 11.57 (p=0.171).
ConclusionsEII had good discrimination, but the calibration was not good with predicted mortality lower than the real mortality. E I showed the best discrimination with good calibration and a tendency to overestimate the mortality. SAPS III showed poor discrimination with good calibration and a tendency to greatly overestimate the predicted mortality. We saw no improvement in the predictive performance of EII over I and we reject the use of SAPS III in this kind of patient.
Realizar una validación externa del Euroscore I, Euroscore II y SAPS III.
Pacientes y métodoEstudio de cohorte retrospectivo durante 3 años de todos los pacientes adultos intervenidos de cirugía cardiaca. Se revisó la historia clínica siguiendo al paciente hasta el alta hospitalaria (vivo, muerto). Se calcularon las mortalidades predichas por el Euroscore I (EI), II (EII) y SAPS III. La validación de los modelos se determinó mediante la discriminación mediante el área bajo la curva ROC y la calibración mediante el test de Hosmer–Lemeshow.
ResultadosOchocientos sesenta y seis pacientes incluidos, el 62,5% varones, con una edad mediana de 69 años. El 6,1% falleció durante su ingreso hospitalario. Mortalidad predicha: EI 7,94%, EII 3,54, SAPS III 12,1%. Área bajo la curva (IC 95%): EI 0,862 (0,812-0,912); EII 0,861 (0,806-0,915); SAPS III 0,692 (0,601-0,784). Prueba de Hosmer–Lemeshow: EI 14,0046 (p=0,08164); EII 33,67 (p=0,00004660); SAPS III 11,57 (p=0,171).
Conclusionesel EII presentó una discriminación adecuada, aunque la calibración no fue apropiada con cifras de mortalidad predicha menores a la real. El EI mostró la mejor discriminación con una calibración adecuada y una tendencia a sobreestimar la mortalidad. El SAPS III ha mostrado mala discriminación con una calibración adecuada y una tendencia a aumentar exageradamente la predicción de la mortalidad. No hemos observado ninguna mejoría en el rendimiento predictivo del EII sobre el I y rechazamos la utilización del SAPS III en este tipo de enfermos.
Artículo
Comprando el artículo el PDF del mismo podrá ser descargado
Precio 19,34 €
Comprar ahora


