


Sirtuin 1 is a human protein involved in gene silencing and in inducing the deacetylation of proteins involved in the metabolic and adaptive response mechanisms. Polymorphisms in the SIRT1 gene have been studied with respect to aging. This study aims to determine the allelic and genotypic frequencies of the rs7895833 A/G polymorphism in the SIRT1 gene, and to identify the association between this polymorphism and the co-morbidities prevalent in the elderly population.
Material and methodsA total of 216 patients were evaluated in an outpatient clinic in Central Brazil. The individuals underwent validated tests for cognitive impairment and falls risk, serum biochemistry analysis, as well as polymer chain reaction (PCR) with confronting two-pair primers for polymorphism genotyping.
Resultsrs7895833 polymorphism in SIRT1 gene was observed in these patients as follows: AA (56/216), AG (138/216), and GG (22/216). The frequency of allele A was 0.58, and that of allele G was 0.42. In the multivariate analysis of the exploratory variables, glucose, high density lipoprotein (HDL) cholesterol, systemic arterial hypertension, dyslipidaemia, and depression, which were associated in the univariate analysis with the polymorphism rs7895833, only dyslipidaemia showed a statistically significant difference in a greater number of individuals with this polymorphism.
ConclusionThe variant allele G of the SIRT1 gene polymorphism was found in 42% of these Brazilian geriatric patients, and was associated with dyslipidaemia. Further studies should be performed to confirm this result and to elucidate the role of SIRT1 in lipid metabolism.
Sirtuin 1 es una proteína humana implicada en el silenciamiento génico y en la inducción de la desacetilación de proteínas involucradas en los mecanismos de respuesta metabólica y adaptativa. Los polimorfismos en el gen SIRT1 se han estudiado con respecto al envejecimiento. Este estudio tiene como objetivo determinar las frecuencias alélicas y genotípicas del polimorfismo rs7895833 A/G en el gen SIRT1, e identificar la asociación entre este polimorfismo y las comorbilidades prevalentes en la población anciana.
Material y métodosDoscientos dieciséis pacientes fueron evaluados en una clínica ambulatoria en el centro de Brasil. Los individuos fueron sometidos a pruebas validadas de déficit cognitivo y riesgo de caídas, análisis de bioquímica sérica y reacción en cadena de la polimerasa (PCR) con los cebadores enfrentados de 2 pares para el genotipado del polimorfismo.
ResultadosEl polimorfismo rs7895833 en el gen SIRT1 se observó en estos pacientes de la siguiente manera: AA (56/216), AG (138/216) y GG (22/216). La frecuencia del alelo A fue de 0,58 y la del alelo G fue de 0,42. En el análisis multivariado de las variables exploratorias, a saber, glucosa, colesterol de lipoproteínas de alta densidad (HDL), hipertensión arterial sistémica, dislipidemia y depresión, que se asociaron en el análisis univariante con el polimorfismo rs7895833, solo la dislipidemia mostró una diferencia estadísticamente significativa en un mayor número de individuos con este polimorfismo.
ConclusiónEl alelo variante G del polimorfismo del gen SIRT1 se encontró en el 42% de estos pacientes geriátricos brasileños y se asoció con dislipidemia. Se deben realizar más estudios para confirmar este resultado y para dilucidar el papel de SIRT1 en el metabolismo de los lípidos.
Aging of the population is a worldwide reality, both in developed and developing countries; for the first time, most people can expect to live beyond 60 years of age, and estimates show that by 2020, there will be a larger number of people aged 60 years than the number of children aged five years and below worldwide. The number of elderly people is expected to reach almost two billion by 2050.1
Due to the worldwide increase in life expectancy, the profile of diseases responsible for morbidity and mortality gradually changed, especially among the elderly population; this has led to a large number of the elderly individuals suffering from chronic diseases. Therefore, aging has become not only an achievement, but also a challenge for the world and health policies today.1 Identifying factors that may be associated with life expectancy or that may positively affect the quality of aging have been the objective of numerous research studies.
Sirtuins are part of a family of proteins initially described in lower organisms as being related to increased longevity in those lifeforms.2 The seven human sirtuins, SIRT1–7, are present in different locations within the cell; they coordinate different cellular processes and decrease gene expression.
Sirtuin 1 (SIRT1), the most studied sirtuin, is a histone deacetylase that targets key proteins involved in the mechanism of adaptive metabolic response of the organism against homeostasis-threatening situations. SIRT1 targets proteins such as p53, forkhead transcription factors, the liver X receptor (LXR), and the peroxisome proliferator-activated receptor gamma (PPARγ). Therefore, SIRT1 activity affects glucose and lipid metabolism.2,3 Several polymorphisms in the SIRT1 gene were described while evaluating its possible associations with aging-related diseases and increased human life expectancy. The present study aimed to assess whether the polymorphism rs7895833 in the gene SIRT1 is associated with some diseases prevalent during the aging process.
Materials and methodStudy populationThis study included individuals, treated at the geriatric outpatient clinic of the Júlio Müller University Hospital, Cuiabá, Mato Grosso from August 2016 to May 2017. The participants or their legal representatives were informed about the study objectives and the research protocol. All enrollees signed the informed consent form and were aware of our need to collect their blood for DNA extraction and laboratory tests. This study was approved by the Research Ethics Committee of the Júlio Müller University Hospital under opinion number 1.486.821/2016, and followed the ethical principles stated in the Declaration of Helsinki.
Clinical interviewThe individuals who participated in the study were interviewed and subjected to a physical examination. During the interview, they were questioned about their life habits, personal history, and use of medications. The following validated tests were then performed: mini-mental state examination, according to the protocol of Brucki et al.4; clock-drawing test, according to the protocol of Sunderland et al.5; verbal fluency, according to the method described by Brucki et al.6; short-form 15-question geriatric depression scale devised by Sheikh and Yesavage7; the timed up and go, according to the protocol of Podsiadlo and Richardson.8
The reports on the use of medications for the treatment of chronic diseases such as systemic arterial hypertension, diabetes mellitus, dyslipidemia, hypothyroidism, and depression were used to classify the individuals as bearers of these pathologies, even if the laboratory tests were normal. Individuals with performances below the expected values for their schooling in mini-mental state examination were classified with a cognitive deficit. Individuals who were reported to have a history of malignant neoplasia were classified as patients with this pathological condition. Patients who presented a score >5 points in the geriatric depression scale were classified as depressive.
Height (cm) and weight (kg) were measured at the initial examination, in standing position wearing clothes without shoes. Body mass index (BMI) was computed as weight in kilograms divided by height in meters squared (kg/m2). The blood pressures were measured by the physician in the sitting position with the aid of a random-zero sphygmomanometer; individuals who had blood pressure levels ≥140/90mmHg, or an isolated systemic systolic blood pressure ≥140mmHg, were regarded as hypertensive.
Blood collection and laboratory dosagePeripheral blood samples were collected from all patients after a 12-h fasting duration. The following biochemical and hematological parameters were determined based on the methods of the Brazilian Society of Biochemistry and Hematology: total cholesterol (TC), triglycerides (TG), low-density lipoprotein (LDL), high-density lipoprotein (HDL), glucose, urea, creatinine, thyroid-stimulating hormone (TSH), and hemoglobin. Patients who had isolated hypercholesterolemia (LDL-C≥130mg/dl), isolated hypertriglyceridemia (TG≥150mg/dl), mixed hyperlipidemia (LDL-C≥130mg/dl and TG≥150mg/dl), and low HDL-C (<40mg/dl) alone or in combination with increased LDL-C or TG were classified as having dyslipidemia. Patients with a fasting plasma glucose ≥126mg/dl were considered diabetic.
DNA extraction and quantificationThe technique used to extract DNA was the salting out method described by Lahiri and Nurnemberg.9 All samples extracted were quantified using NANODROP spectrophotometer (ND-1000 – NANODROP USA).
Genotyping of the polymorphism in the SIRT1 geneThe single nucleotide polymorphism (SNP) rs7895833 was selected because it is one of the most frequent polymorphisms in the SIRT1 gene, and has been associated with changes in the metabolic profile.10,11 The identification of the rs7895833 polymorphism in the promoter region of the gene was performed using the polymerase chain reaction (PCR) by the PCR-CTPP technique with two pairs of primers; one pair is for the A allele and the other is for G.12 The primers used were the following:
Forward primer 1: CCCAGGGTTCAACAAATCTATGTTG
Forward primer 2: CCCAGGGTTCAACAAATCTATGTTG
Reverse primer 1: GCTTCCTAATCTCCATTACGTTGAC
Reverse primer 2: CCTCCCAGTCAACGACTTTATC
The amplified product was visualized on a 2% agarose gel. The gel was then stained with ethidium bromide to visualize the bands of interest: 320- and 241-bp bands for the AA genotype, 320-, 241-, and 136-bp bands for the AG genotype, and 320- and 136-bp bands for the GG genotype.
Statistical analysisAll quantitative results were expressed as the mean±standard deviation (SD). The significance level was defined as p<0.05. The descriptive data was analyzed using the software EpiData V2.2.2.2.186. The Hardy–Weinberg equilibrium test was performed to test for allele/genotype frequency deviations.
The Shapiro–Wilk test was performed to test the normality of the continuous variables. Univariate analysis of SIRT1 polymorphism-associated factors was performed with the statistical software package Stata version 11.0 (Stata Corp., Texas, USA) using the Pearson's chi-squared test (categorical variables), analysis of variance for continuous variables, or Kruskal–Wallis test (when assessing non-normal distribution and/or heterogeneity of variances between genotypes).
The multiple logistic regression method was used to determine the independent association between the study characteristics and the SIRT1 polymorphism.13 Those variables were included in the logistic models whose p-values were <0.20 for association with the polymorphism in the univariate analysis.14 Only exploratory variables associated with the response variable for p-values <0.05 were retained in the model. The crude odds ratio (OR) and its 95% confidence intervals (CI) (Woolf method) were calculated in the multivariate analysis to estimate the strength of the association between the variables.15
ResultsIn this study, 230 elderly individuals treated at the geriatric outpatient clinic of the Júlio Muller University Hospital were included in the final study sample; 216 individuals were subjected to a complete analysis of the polymorphism and to laboratory tests, as 14 individuals were not included in the study due to their failure to provide data and samples for laboratory tests. The distribution based on sex was similar, with a slight predominance of women (57.4%). The mean age was 69.3±6.8 years, and 91.6% subjects were aged 60–79 years. Most of them were white or brown (88.9%); 7.0% of them had received more than 12 years of education. The study participants were predominantly low-income elderly people (87.9%), and a married or cohabitation marital status was reported for nearly half of them (48.4%) (Table 1).
Clinical and laboratorial sociodemographic characteristics of the elderly attended at the geriatric outpatient clinic of the Júlio Muller University Hospital, Cuiabá (MT), 2017.
| Characteristics | n | (%) |
|---|---|---|
| Sex | ||
| Male | 92 | 42.6 |
| Female | 124 | 57.4 |
| Age (years) | Mean (standard deviation): 69.3 (6.8) | |
| 60–69 | 118 | 54.6 |
| 70–79 | 80 | 37.0 |
| 80–89 | 16 | 7.4 |
| 90–99 | 2 | 0.9 |
| Ethnicity | ||
| White | 97 | 44.9 |
| Black | 24 | 11.1 |
| Mulatto | 95 | 44.0 |
| Marital status | ||
| Married | 105 | 48.6 |
| Divorced | 36 | 16.7 |
| Widover | 67 | 31.0 |
| Single | 8 | 3.7 |
| Education (years) | ||
| None | 40 | 18.2 |
| 1–4 | 99 | 45.8 |
| 5–8 | 40 | 18.5 |
| 9–11 | 22 | 10.2 |
| >12 | 15 | 7.0 |
| Monthly income | ||
| Up to three minimum wages | 189 | 87.9 |
| 3–10 minimum wages | 26 | 12.1 |
| Diabetes mellitus | 54 | 25.0 |
| Systemic arterial hypertension | 160 | 74.1 |
| Dyslipidemia (n=206) | 168 | 81.5 |
| Depression | 13 | 6.0 |
| Tumors | 14 | 6.5 |
| Cognitive deficits (n=214) | 25 | 11.7 |
| Hypothyreoidism | 15 | 6.9 |
| Parkinsonian syndrome | 5 | 2.3 |
| Mean (Standard deviation) | ||
| Systolic blood pressure (mmHg) | 139.1 (24.6) | |
| Diastolic blood pressure (mmHg) | 78.0 (13.6) | |
| Body mass index (kg/m2) | 27.2 (5.6) | |
| Waist circumference (cm) n=210 | 92.8 (15.6) | |
| Hip circumference (cm) n=210 | 98.0 (13.4) | |
| MMSE (points) n=215 | 23.0 (5.0) | |
| Verbal fluency test (points) n=214 | 13.1 (4.6) | |
| Clock drawing test (score) n=212 | 5.9 (3.1) | |
| GDS (score) n=210 | 2.5 (1.5) | |
| Get up and go test (seconds) n=209 | 12.0 (11.1) | |
| Fasting glucose (mg/dl) n=208 | 111.3 (50.3) | |
| Total cholesterol (mg/dl) n=204 | 193.9 (45.5) | |
| HDL cholesterol (mg/dl) n=202 | 47.1 (15.0) | |
| LDL cholesterol (mg/dl) n=197 | 117.5 (39.3) | |
| Triglyceride (mg/dl) n=203 | 152.6 (86.8) | |
| Hemoglobin (g/dl) n=204 | 13.9 (1.7) | |
| Urea (mg/dl) n=194 | 38.3 (13.1) | |
| Creatinine (mg/dl) n=200 | 0.9 (0.3) | |
| TSH (mg/dl) n=155 | 2.6 (3.5) | |
Obs: variation of n due to lack of information for the respective variable; MMSE: mini-examination of mental state; GDS: geriatric depression scale.
The physical examination indicated that the elderly individuals had a mean body mass index (BMI) of 27.18±5.60kg/m2, and mean waist and hip circumferences of 92.75 (±15.64) cm and 97.97±13.40cm, respectively. The mean systolic and diastolic blood pressures were 139.09±24.60 and 77.95±13.55mmHg, respectively. A high frequency of dyslipidemia (81.1%), followed by systemic arterial hypertension (74.1%), diabetes mellitus (25%), hypothyroidism (6.9%), tumors (6.5%) and depression (6.0%), was observed for the chronic diseases studied. Cognitive deficit, regardless of the etiology, was observed in 11.7% of elderly individuals, and 2.3% showed signs and/or symptoms characteristic of Parkinsonian syndrome during anamnesis (Table 1).
The following mean scores were determined with respect to the performance of the elderly individuals in the tests to screen for dementia and depression: 23.03±4.97 points in the MMSE, 13.07±4.63 points in the verbal fluency test, and a lower score of 5.91±3.09 on the clock-drawing test. A low GDS score, averaging 2.52±2.76 was observed for most individuals. The risk of fall was assessed using the timed get-up-and-go test, for which the mean time recorded was 11.96±4.59s (Table 1).
The laboratory tests showed the following results: mean fasting glucose level, 111.26±50.28mg/dl; total cholesterol level, 193.86±45.45mg/dl; HDL level, 47.14±15.01mg/dl; LDL level, 117.48±39.26mg/dl; triglyceride level, 152.58±86.78mg/dl; TSH level, 2.60±3.46mg/dl; hemoglobin level, 13.86±1.74g/dl; urea level, 38.28±13.11mg/dl; and creatinine level, 0.88±0.296mg/dl (Table 1).
The genotypic and allelic frequencies were calculated for all samples. The genotypic frequency of normal AA homozygous individuals was 25.9%, whereas that of the heterozygous individuals for the AG polymorphism was 63.9%. The rest of the samples were GG homozygous variants, accounting for 10.2% of the individuals in this sample group (Table 2). The same table also shows the allelic frequency of those individuals: the frequency of allele A was 0.58, and that of allele G was 0.42. Thus, most of the individuals in this sample contain the wild-type allele. The sample was found to be in Hardy–Weinberg equilibrium.
Analysis of the association of demographic, behavioral, and co-morbidity variables with the genotypes of polymorphism rs7895833 among the 216 elderly individuals treated at the geriatric outpatient clinic of the Júlio Muller University Hospital in Cuiabá (Mato Grosso – MT), 2017.
| Characteristics | Genotypes n (%) | Total | p* | ||
|---|---|---|---|---|---|
| AA56 (25.9) | AG138 (63.9) | GG22 (10.2) | |||
| Sex | |||||
| Female | 27 (21.8) | 85 (68.5) | 12 (9.7) | 124 | 0.233 |
| Ethnicity | |||||
| White | 26 (26.8) | 66 (68.0) | 5 (5.2) | 97 | |
| Brown | 26 (27.4) | 55 (57.9) | 14 (14.7) | 95 | 0.175 |
| Black | 4 (16.7) | 17 (70.8) | 3 (12.5) | 24 | |
| Tobacco smoking | |||||
| No | 50 (25.4) | 127 (64.4) | 20 (10.2) | 197 | 0.828 |
| Alcoholism | |||||
| No | 49 (26.5) | 119 (64.3) | 17 (9.2) | 185 | 0.757 |
| Physical activity | |||||
| No | 36 (27.9) | 81 (62.8) | 12 (9.3) | 129 | 0.674 |
| Elderly group | |||||
| No | 46 (26.0) | 116 (65.5) | 15 (8.5) | 177 | 0.117 |
| Arterial hypertension | |||||
| Yes | 44 (27.5) | 100 (62.5) | 16 (10.0) | 160 | 0.671 |
| Dyslipidemia | |||||
| Yes | 49 (29.2) | 104 (61.9) | 15 (8.9) | 168 | 0.043 |
| Diabetes mellitus | |||||
| No | 41 (25.3) | 106 (65.4) | 15 (9.3) | 162 | 0.643 |
| Depression | |||||
| No | 56 (27.6) | 126 (62.1) | 21 (10.3) | 213 | 0.066 |
| Cognitive deficit | |||||
| No | 41 (27.0) | 120 (63.5) | 18 (9.5) | 189 | 0.734 |
Allele frequencies: A: 250 (0.58); G: 182 (0.42).
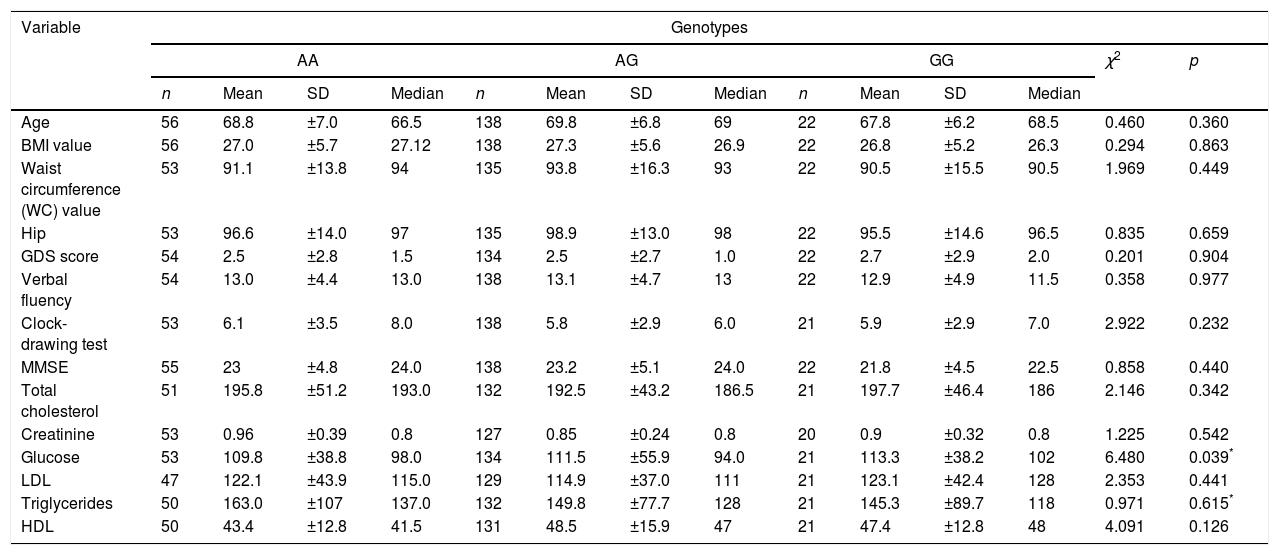
In the analysis of the association between demographic and behavioral variables, a significant association was not observed with respect to sex, ethnicity, tobacco smoking, alcoholism, physical activity, and elderly group, and the three different genotypes of the polymorphism rs7895833 (Table 2). The analysis of chronic co-morbidity showed that dyslipidemia was the more frequent among elderly individuals with the AA genotype (p=0.043). A significant association was not observed for the other co-morbidities (Table 2). Association of the different genotypes of the polymorphism rs7895833 with quantitative variables was only observed with respect to glucose levels. Although without relevance in clinical practice; individuals with the genotype GG showed the highest fasting glycemic levels (p=0.039; Table 3).
Analysis of the association of the genotype with the quantitative variables of elderly individuals treated at the geriatric outpatient clinic of the Júlio Muller University Hospital, in Cuiabá (Mato Grosso – MT), 2017.
| Variable | Genotypes | |||||||||||||
|---|---|---|---|---|---|---|---|---|---|---|---|---|---|---|
| AA | AG | GG | χ2 | p | ||||||||||
| n | Mean | SD | Median | n | Mean | SD | Median | n | Mean | SD | Median | |||
| Age | 56 | 68.8 | ±7.0 | 66.5 | 138 | 69.8 | ±6.8 | 69 | 22 | 67.8 | ±6.2 | 68.5 | 0.460 | 0.360 |
| BMI value | 56 | 27.0 | ±5.7 | 27.12 | 138 | 27.3 | ±5.6 | 26.9 | 22 | 26.8 | ±5.2 | 26.3 | 0.294 | 0.863 |
| Waist circumference (WC) value | 53 | 91.1 | ±13.8 | 94 | 135 | 93.8 | ±16.3 | 93 | 22 | 90.5 | ±15.5 | 90.5 | 1.969 | 0.449 |
| Hip | 53 | 96.6 | ±14.0 | 97 | 135 | 98.9 | ±13.0 | 98 | 22 | 95.5 | ±14.6 | 96.5 | 0.835 | 0.659 |
| GDS score | 54 | 2.5 | ±2.8 | 1.5 | 134 | 2.5 | ±2.7 | 1.0 | 22 | 2.7 | ±2.9 | 2.0 | 0.201 | 0.904 |
| Verbal fluency | 54 | 13.0 | ±4.4 | 13.0 | 138 | 13.1 | ±4.7 | 13 | 22 | 12.9 | ±4.9 | 11.5 | 0.358 | 0.977 |
| Clock-drawing test | 53 | 6.1 | ±3.5 | 8.0 | 138 | 5.8 | ±2.9 | 6.0 | 21 | 5.9 | ±2.9 | 7.0 | 2.922 | 0.232 |
| MMSE | 55 | 23 | ±4.8 | 24.0 | 138 | 23.2 | ±5.1 | 24.0 | 22 | 21.8 | ±4.5 | 22.5 | 0.858 | 0.440 |
| Total cholesterol | 51 | 195.8 | ±51.2 | 193.0 | 132 | 192.5 | ±43.2 | 186.5 | 21 | 197.7 | ±46.4 | 186 | 2.146 | 0.342 |
| Creatinine | 53 | 0.96 | ±0.39 | 0.8 | 127 | 0.85 | ±0.24 | 0.8 | 20 | 0.9 | ±0.32 | 0.8 | 1.225 | 0.542 |
| Glucose | 53 | 109.8 | ±38.8 | 98.0 | 134 | 111.5 | ±55.9 | 94.0 | 21 | 113.3 | ±38.2 | 102 | 6.480 | 0.039* |
| LDL | 47 | 122.1 | ±43.9 | 115.0 | 129 | 114.9 | ±37.0 | 111 | 21 | 123.1 | ±42.4 | 128 | 2.353 | 0.441 |
| Triglycerides | 50 | 163.0 | ±107 | 137.0 | 132 | 149.8 | ±77.7 | 128 | 21 | 145.3 | ±89.7 | 118 | 0.971 | 0.615* |
| HDL | 50 | 43.4 | ±12.8 | 41.5 | 131 | 48.5 | ±15.9 | 47 | 21 | 47.4 | ±12.8 | 48 | 4.091 | 0.126 |
The two-group comparison analysis of the genotypes (AA vs AG+GG) with the quantitative variables showed an association between HDL levels and the two different groups (p=0.044; Table 4). A strong association was noted between the polymorphism analyzed (AA vs AG+GG) and dyslipidemia (p=0.018) and depression (p=0.028); a higher frequency of dyslipidemia and lower frequency of depression was observed in the patients with the genotype AA (Table 5).
Analysis of the association of genotype with the continuous variables using two comparison groups among elderly individuals treated at the geriatric outpatient clinic of the Júlio Muller University Hospital, in Cuiabá (Mato Grosso – MT), 2017.
| Variables | Genotypes | p* | |||||
|---|---|---|---|---|---|---|---|
| AA | AG+GG | ||||||
| n | Mean | SD | n | Mean | SD | ||
| Age (years) | 56 | 68.8 | ±7.0 | 160 | 69.5 | ±6.7 | 0.493 |
| BMI (kg/m2) | 56 | 27.0 | ±5.7 | 160 | 27.2 | ±5.6 | 0.761 |
| Waist circumference (cm) | 53 | 91.1 | ±13.8 | 157 | 93.3 | ±16.2 | 0.373 |
| Hip (cm) | 53 | 96.6 | ±14 | 157 | 98.4 | ±13.2 | 0.385 |
| GDS (score) | 54 | 2.5 | ±2.8 | 156 | 2.5 | ±2.7 | 0.725 |
| Verbal fluency (score) | 54 | 13.0 | ±4.4 | 160 | 13.1 | ±4.7 | 0.878 |
| Clock-drawing test (score) | 53 | 6.1 | ±3.5 | 159 | 5.8 | ±2.9 | 0.547 |
| MMSE (score) | 55 | 23.0 | ±4.8 | 160 | 23.0 | ±5.1 | 0.618 |
| Total cholesterol (mg/dl) | 51 | 195.8 | ±51.2 | 153 | 193.2 | ±43.5 | 0.726 |
| Creatinine (mg/dl) | 53 | 0.96 | ±0.39 | 147 | 0.86 | ±0.25 | 0.282* |
| Glucose (mg/dl) | 53 | 109.8 | ±38.85 | 155 | 111.8 | ±53.7 | 0.199* |
| LDL (mg/dl) | 47 | 122.1 | ±43.9 | 150 | 116 | ±37.7 | 0.358 |
| Triglycerides (mg/dl) | 50 | 163 | ±107 | 153 | 149.2 | ±79.2 | 0.541* |
| HDL (mg/dl) | 50 | 43.4 | ±12.8 | 152 | 48.4 | ±15.5 | 0.044 |
| Comorbities | n (%) | n (%) | p** |
|---|---|---|---|
| Arterial hypertension | 40 (29.0%) | 98 (71.0%) | 0.1723 |
| Diabetes | 15 (27.8%) | 39 (72.2%) | 0.7199 |
| Dislipidemia | 49 (29.2%) | 119 (70.8%) | 0.0176 |
| Depression | 0 (0%) | 13 (100%) | 0.028 |
Significant results from the multivariate analysis of the characteristics associated with the polymorphism (wild type/mutant) of the SIRT1 gene in the sample of elderly individuals treated at the geriatric outpatient clinic of the Júlio Muller University Hospital in Cuiabá (Mato Grosso – MT), 2017.
| Characteristics | Genotype Sirt-1 | RC | (95% CI) | p | |
|---|---|---|---|---|---|
| AA | GG/AG | ||||
| Dyslipidemia | |||||
| Yes | 49 (92.5) | 119 (77.8) | 3.65 | 1.22; 10.89 | 0.020 |
| No | 4 (7.5) | 34 (22.2) | 1.00 | ||
OR (95% CI): Odds ratio (95% confidence interval) adjusted for dyslipidemia using the multiple logistic regression model (190 elderly participated in the analysis). The initial model included the following variables: ethnicity, blood glucose levels, arterial hypertension, HDL levels, depression, dyslipidemia, and participation in the elderly group.
In the multivariate analysis of the exploratory variables, namely, glucose levels, HDL cholesterol levels, dyslipidemia, and depression, which were associated with the polymorphism rs7895833 in the univariate analysis, only dyslipidemia remained independently associated with the AA genotype. The odds ratio (95% CI) of the genotype AA for elderly individuals with dyslipidemia is 3.65 (CI: 1.22, 10.89) times the odds of this genotype for the non-dyslipidemic elderly individuals (p=0.020; Table 5).
DiscussionIn this study, we analyzed the SIRT1 polymorphism, rs7895833, among elderly patients, and its possible associations with diseases prevalent in this population, and observed a higher frequency of allele A in patients with dyslipidemia. SIRT1 is a molecule possibly involved in the epigenetic control of metabolic and aging-related diseases.3,16 The findings showed a frequency of 0.42 for allele G. On surveying the literature, we observed that the frequency of the variant allele changes according to the population. The frequency observed in South African Indians was 0.41, 0.22 for people of African descent in the same region, and 0.71 among the Japanese population. In another study with a Brazilian population in São Paulo, the frequency of the minor allele was found to be 0.28.17,18 These differences in the distribution of the polymorphism may explain the different prevalence rates of diseases among these populations.
We know that SIRT1 plays a role in cholesterol metabolism. During fasting, liver lipogenesis decreases and lipolysis in the adipose tissue is favored. SIRT1 participates in this process, deacetylating and targeting the protein responsible for lipogenesis and cholesterol synthesis, the sterol regulatory element-binding protein 1 (SREBP1), to thus regulate cholesterol homeostasis. SIRT1 also acts on the oxysterol receptor (LXR), thereby facilitating the reverse transport of cholesterol, and modulates the expression of bile acid receptors such as the farnesoid X receptor (FXR). This receptor is important for bile acid synthesis and cholesterol catabolism, facilitating reverse transport, decreasing the hepatic production of cholesterol, and reducing atherosclerosis.19
The allele G of rs7895833 was associated with a decreased BMI and decreased risk of obesity in 13–18% of the cases.11 Results of studies, such as those by Kilic et al. (2014),20 which analyzed SIRT1 expression in patients with the polymorphism rs7895833 A>G, may explain our findings, as the patients with this polymorphism show increased SIRT1 levels and may therefore, exhibit increased cholesterol metabolism efficiency. This would reduce the occurrence of dyslipidemia, which was also suggested by our findings.
In the univariate analysis, we observed an association between this polymorphism and glucose levels that was not observed in the multivariate analysis, thus, confirming the previously published data, which indicated that there was no association between the polymorphism and glucose levels.17
The association between depression and the polymorphism rs7895833 was also not confirmed in the multivariate analysis. In the Japanese population, another polymorphism in the SIRT1 gene, rs3758931, has already been associated with depression.21 In the present study, the small group of individuals with depression may have limited the evaluation of this association.
An association between this polymorphism and the results from the cognitive and functional tests, to which the elderly individuals were subjected, was not observed.
The associations determined suggest that individuals with the polymorphism rs7895833 may show differences in regulation of lipid metabolism; however, studies assessing the SIRT1 expression in this population should be performed to confirm this finding.
Some limitations of the present study should be noted: we have studied elderly individuals only from a university hospital, which may constitute a selection bias. Another constraint of the study is the sample size, which was insufficient to detect all associations with the other studied variables. However, our findings are supported by previously published literature; several studies with probabilistic samples and a greater number of individuals reported changes in lipid metabolism and an association of the polymorphism rs7895833 involving allele A with obesity, thus showing that SIRT1 affect adipogenesis.3,11,22
ConclusionThe SIRT1 gene polymorphism was found in 42% of these Brazilian geriatric patients and was associated with dyslipidemia. Further studies should be performed to confirm this result and to elucidate the role of SIRT1 in lipid metabolism.
Author contributionsThis study was conducted by the authors Andréia Athayde Firmiano Casarotto, Bianca Borsatto Galera, Larissa Midori Sumiyoshi, and Thays Maldonado Floôr. The experiments were performed by Bianca Borsatto Galera and Andréia Athayde Firmiano Casarotto, the database construction and statistical analysis was performed by Andréia Athayde Firmiano Casarotto, Larissa Midori Sumiyoshi and Thays Maldonado Floôr, and the manuscript was written by Andréia Athayde Firmiano Casarotto and Bianca Borsatto Galera. All authors read and approved the final version of the manuscript.
Conflict of interestThe authors declare no conflicts of interest.
The authors thank the School of Medicine of the Federal University of Mato Grosso (Universidade Federal do Mato Grosso – UFMT) for providing access to the genetics laboratory to conduct this research study.
