To investigate quantitative methods of tumor proliferation using 3′-[18F]fluoro-3′-deoxythymidine ([18F]FLT) PET in patients with breast cancer (BC), studied before and after one bevacizumab administration, and to correlate the [18F]FLT-PET uptake with the Ki67 index.
Material and methodsThirty patients with newly diagnosed, untreated BC underwent a [18F]FLT-PET before and 14 days after bevacizumab treatment. A dynamic scan centered over the tumor began simultaneously with the injection of [18F]FLT (385±56MBq). Image derived input functions were obtained using regions of interest drawn on the left ventricle (LV) and descending aorta (DA). Metabolite corrected blood curves were used as input functions to obtain the kinetic Ki constant using the Patlak graphical analysis (time interval 10–60min after injection). Maximum SUV values were derived for the intervals 40–60min (SUV40) and 50–60min (SUV50). PET parameters were correlated with the Ki67 index obtained staining tumor biopsies.
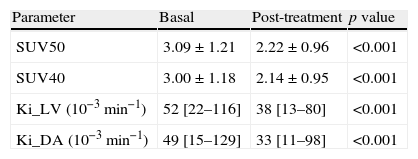
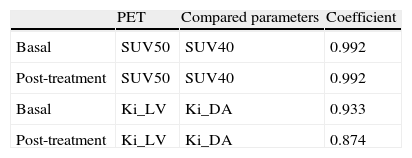
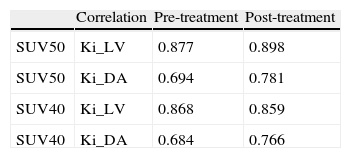
Results[18F]FLT uptake parameters decreased significantly (p<0.001) after treatment: SUV50=3.09±1.21 vs 2.22±0.96; SUV40=3.00±1.18 vs 2.14±0.95, Ki_LV(10–3)=52[22–116] vs 38[13–80] and Ki_DA(10–3)=49[15–129] vs 33[11–98]. Consistency interclass correlation coefficients within SUV and within Ki were high. Changes of SUV50 and Ki_DA between baseline PET and after one bevacizumab dose PET correlated with changes in Ki67 index (r-Pearson=0.35 and 0.26, p=0.06 and 0.16, respectively).
Conclusions[18F]FLT-PET is useful to demonstrate proliferative changes after a dose of bevacizumab in patients with BC. Quantification of tumor proliferation by means of SUV and Ki has shown similar results, but SUV50 obtained better results. A correlation between [18F]FLT changes and Ki67 index was observed.
Evaluar métodos cuantitativos de proliferación celular en PET con 3′-[18F]fluoro-3′-desoxitimidina ([18F]FLT), antes y después de una dosis de bevacizumab en pacientes con carcinoma de mama (CM), y correlacionar la captación de [18F]FLT con el índice Ki67.
Material y métodosSe incluyeron 30 mujeres con CM no tratado. Se realizó [18F]FLT-PET antes y 14 días después de una dosis de bevacizumab. La PET dinámica centrada en el tumor se inició simultáneamente con la infusión de [18F]FLT (385±56MBq). Se dibujaron regiones de interés en ventrículo izquierdo (VI) y aorta descendente (AD), obteniéndose funciones de entrada, que corregidas por metabolitos, se utilizaron para obtener la constante Ki de Patlak (intervalo: 10-60min). Se calcularon valores máximos del SUV en los intervalos 40-60min (SUV40) y 50-60min (SUV50). Los parámetros PET se correlacionaron con el Ki67, obtenido en biopsias tumorales teñidas.
ResultadosLos parámetros de la captación de [18F]FLT disminuyeron significativamente (p<0,001) tras el tratamiento: SUV50=3,09±1,21 vs 2,22±0,96; SUV40=3,00±1,18 vs 2,14±0,95, Ki_VI(10-3)=52[22–116] vs 38[13–80] y Ki_AD(10-3)=49[15–129] vs 33[11–98]. Los coeficientes de correlación intraclase fueron elevados en los SUV y en los Ki. Los cambios de SUV50 y Ki_AD entre la PET basal y la PET tras bevacizumab se correlacionaron con los cambios en el Ki67 (r-Pearson=0,35 y 0,26, p=0,06 y 0,16, respectivamente).
ConclusionesLa [18F]FLT-PET refleja los cambios en la proliferación celular tras una dosis de bevacizumab en pacientes con CM. La cuantificación de la proliferación por medio del SUV y la Ki arrojó resultados similares, si bien fueron mejores con el SUV50. Los cambios en [18F]FLT se correlacionaron con los cambios en el índice Ki67.
Artículo
Comprando el artículo el PDF del mismo podrá ser descargado
Precio 19,34 €
Comprar ahora


