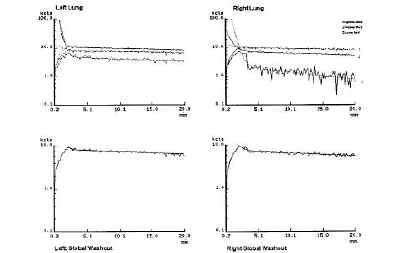
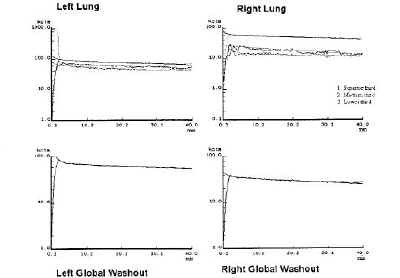
array:18 [ "pii" => "13006303" "issn" => "2253654X" "estado" => "S300" "fechaPublicacion" => "1999-01-01" "documento" => "article" "crossmark" => 0 "subdocumento" => "fla" "cita" => "Rev Esp Med Nucl Imagen Mol. 1999;18:21-31" "abierto" => array:3 [ "ES" => false "ES2" => false "LATM" => false ] "gratuito" => false "lecturas" => array:2 [ "total" => 1199 "formatos" => array:3 [ "EPUB" => 16 "HTML" => 1148 "PDF" => 35 ] ] "itemSiguiente" => array:15 [ "pii" => "13006304" "issn" => "2253654X" "estado" => "S300" "fechaPublicacion" => "1999-01-01" "documento" => "article" "crossmark" => 0 "subdocumento" => "fla" "cita" => "Rev Esp Med Nucl Imagen Mol. 1999;18:32-6" "abierto" => array:3 [ "ES" => false "ES2" => false "LATM" => false ] "gratuito" => false "lecturas" => array:2 [ "total" => 1640 "formatos" => array:3 [ "EPUB" => 8 "HTML" => 1590 "PDF" => 42 ] ] "es" => array:7 [ "idiomaDefecto" => true "titulo" => "Valoración del receptor del factor de crecimiento epidérmico (EGFR) en patología benigna de la mama y su relación con la expresión en tumores malignos clasificados en función de su dependencia hormonal" "tieneTextoCompleto" => "es" "paginas" => array:1 [ 0 => array:2 [ "paginaInicial" => "32" "paginaFinal" => "36" ] ] "titulosAlternativos" => array:1 [ "en" => array:1 [ "titulo" => "Evalutarion of the epidermal growth factor receptor (EGFR) in benign breast disease and its relation with expression in malignant tumors classified by hormonal dependence." ] ] "contieneTextoCompleto" => array:1 [ "es" => true ] "autores" => array:1 [ 0 => array:2 [ "autoresLista" => "M T Allende, P F Raigoso, A Alvarez, B Llana, A Sánchez, M I Martínez, M T Miralles, C Roiz" "autores" => array:8 [ 0 => array:2 [ "Iniciales" => "M T" "apellidos" => "Allende" ] 1 => array:2 [ "Iniciales" => "P F" "apellidos" => "Raigoso" ] 2 => array:2 [ "Iniciales" => "A" "apellidos" => "Alvarez" ] 3 => array:2 [ "Iniciales" => "B" "apellidos" => "Llana" ] 4 => array:2 [ "Iniciales" => "A" "apellidos" => "Sánchez" ] 5 => array:2 [ "Iniciales" => "M I" "apellidos" => "Martínez" ] 6 => array:2 [ "Iniciales" => "M T" "apellidos" => "Miralles" ] 7 => array:2 [ "Iniciales" => "C" "apellidos" => "Roiz" ] ] ] ] ] "idiomaDefecto" => "es" "EPUB" => "https://multimedia.elsevier.es/PublicationsMultimediaV1/item/epub/13006304?idApp=UINPBA00004N" "url" => "/2253654X/0000001800000001/v0_201308011545/13006304/v0_201308011545/es/main.assets" ] "itemAnterior" => array:15 [ "pii" => "13006302" "issn" => "2253654X" "estado" => "S300" "fechaPublicacion" => "1999-01-01" "documento" => "article" "crossmark" => 0 "subdocumento" => "fla" "cita" => "Rev Esp Med Nucl Imagen Mol. 1999;18:16-20" "abierto" => array:3 [ "ES" => false "ES2" => false "LATM" => false ] "gratuito" => false "lecturas" => array:2 [ "total" => 1798 "formatos" => array:3 [ "EPUB" => 8 "HTML" => 1769 "PDF" => 21 ] ] "es" => array:8 [ "idiomaDefecto" => true "titulo" => "Estudio gammagráfico de los melanomas cutáneos  con 99mTc-HMPAO: visualización de metástasis y recidivas" "tieneTextoCompleto" => "es" "paginas" => array:1 [ 0 => array:2 [ "paginaInicial" => "16" "paginaFinal" => "20" ] ] "titulosAlternativos" => array:1 [ "en" => array:1 [ "titulo" => "Radionuclide study of cutaneous melanomas with 99m Tc-HMPAO: visualization of metastases and recurrence." ] ] "contieneTextoCompleto" => array:1 [ "es" => true ] "resumenGrafico" => array:2 [ "original" => 0 "multimedia" => array:6 [ "identificador" => "fig1" "tipo" => "MULTIMEDIAFIGURA" "mostrarFloat" => true "mostrarDisplay" => false "copyright" => "Elsevier España" "figura" => array:1 [ 0 => array:4 [ "imagen" => "125v18n1-13006302fig01.jpg" "Alto" => 234 "Ancho" => 229 "Tamanyo" => 11315 ] ] ] ] "autores" => array:1 [ 0 => array:2 [ "autoresLista" => "A A Collazo de la Maza, M C Borrón Molinos, N Cordiés Justiz, G Pimentel González, I Sánchez Monzón" "autores" => array:5 [ 0 => array:2 [ "Iniciales" => "A A" "apellidos" => "Collazo de la Maza" ] 1 => array:2 [ "Iniciales" => "M C" "apellidos" => "Borrón Molinos" ] 2 => array:2 [ "Iniciales" => "N" "apellidos" => "Cordiés Justiz" ] 3 => array:2 [ "Iniciales" => "G" "apellidos" => "Pimentel González" ] 4 => array:2 [ "Iniciales" => "I" "apellidos" => "Sánchez Monzón" ] ] ] ] ] "idiomaDefecto" => "es" "EPUB" => "https://multimedia.elsevier.es/PublicationsMultimediaV1/item/epub/13006302?idApp=UINPBA00004N" "url" => "/2253654X/0000001800000001/v0_201308011545/13006302/v0_201308011545/es/main.assets" ] "en" => array:11 [ "idiomaDefecto" => true "titulo" => "Evaluation of the alveolar-capillary membrane permeability using 99mTc-HMPAO aerosols in severe diffuse interstitial fibrosis" "tieneTextoCompleto" => true "paginas" => array:1 [ 0 => array:2 [ "paginaInicial" => "21" "paginaFinal" => "31" ] ] "autores" => array:1 [ 0 => array:2 [ "autoresLista" => "Mª F Botelho, João J P de Lima, Manuel D Cerqueira" "autores" => array:3 [ 0 => array:2 [ "nombre" => "Mª F" "apellidos" => "Botelho" ] 1 => array:2 [ "nombre" => "João J P" "apellidos" => "de Lima" ] 2 => array:2 [ "nombre" => "Manuel D" "apellidos" => "Cerqueira" ] ] ] ] "titulosAlternativos" => array:1 [ "en" => array:1 [ "titulo" => "Evaluación de la permeabilidad de la membrana alveolocapilar utilizando aerosoles de 99m Tc-HMPAO en la fibrosis intersticial difusa." ] ] "resumenGrafico" => array:2 [ "original" => 0 "multimedia" => array:6 [ "identificador" => "fig1" "tipo" => "MULTIMEDIAFIGURA" "mostrarFloat" => true "mostrarDisplay" => false "copyright" => "Elsevier España" "figura" => array:1 [ 0 => array:4 [ "imagen" => "125v18n1-13006303fig01.jpg" "Alto" => 86 "Ancho" => 160 "Tamanyo" => 2208 ] ] ] ] "textoCompleto" => "<p class="elsevierStylePara"><span class="elsevierStyleBold">originales</span></p><p class="elsevierStylePara"><span class="elsevierStyleItalic">Rev. Esp. Med. Nuclear 18, 1 (21-31), 1999</span></p><hr></hr><p class="elsevierStylePara">Evaluation of the alveolar-capillary membrane permeability using <span class="elsevierStyleSup">99m</span>Tc-HMPAO aerosols in severe diffuse interstitial fibrosis</p><p class="elsevierStylePara">M F Botelho, J J P De Lima, M D Cerqueira</p><p class="elsevierStylePara"><span class="elsevierStyleItalic">Biophysics Service-Faculty of Medicine. University of Coimbra. Coimbra. Portugal and Division of Cardiology. Department of Medicine, Georgetown University, Washington, DC USA.</span></p><p class="elsevierStylePara">Recibido: 1-5-98.<br></br> ceptado: 2-8-98.<br></br><span class="elsevierStyleItalic">Correspondencia:</span><br></br> María F Botelho<br></br> Serviço de Biofisica<br></br> Faculdade de Medicina<br></br> 3000 Coimbra. Portugal<br></br> Email: filomena@imagem.ibili.uc.pt</p><hr></hr><p class="elsevierStylePara"><span class="elsevierStyleBold">Resumen.--</span>La inhalación de aerosoles y el procedimiento digital de los datos permiten que, a través de imágenes paramétricas, se pueda obtener información local sobre la permeabilidad de la barrera alveolocapilar (PBAC). En este trabajo comparamos los aerosoles de HMPAC-Tc<span class="elsevierStyleSup">99m</span> con los aerosoles de DTPA-Tc<span class="elsevierStyleSup">9m</span>, la técnica generalizada. En la comparación, aplicamos las dos técnicas en dos muestras: controles normales y pacientes con patología intersticial pulmonar grave. En todos los sujetos se realizaron estudios de perfusión con MAA-Tc<span class="elsevierStyleSup">99m</span>. Los aerosoles fueron producidos con ultrasonidos y soluciones de tensión superficial reducida de HMPAO-Tc<span class="elsevierStyleSup">99m</span> y de DTPA-Tc<span class="elsevierStyleSup">99m</span>. Las curvas de actividad/tiempo, de cada pixel del área pulmonar sirvieron para calcular los tiempos medios de aclaramiento. Con estos valores y una escala de colores, se generaron imágenes paramétricas. Una comparación de los resultados obtenidos con los dos tipos de aerosoles, sugieren que los primeros son mis específicos y muestran alteraciones locales de transporte epitelial pulmonar en cada tipo de patología estudiada. Este método permite distinguir entre alteraciones de ]a permeabilidad debidas a disminución de la perfusión, local y al deterioro de la barrera alveolocapilar.</p><p class="elsevierStylePara"><span class="elsevierStyleBold">PALABRAS CLAVE: Permeabilidad epitelial pulmonar. Aerosoles. HMPAO-Tc<span class="elsevierStyleSup">99m</span>. Tensión superficial.</span></p><p class="elsevierStylePara"><span class="elsevierStyleBold">Summary.--</span>Local information on permeability of the alveolar-capillary barrier (PACB) can be ascertained by parametric images, after inhalation of radioarosols and computer processing. Our aim is to compare the results of <span class="elsevierStyleSup"> 99m</span>Tc-HMPAO aerosols on PACB studies with those of <span class="elsevierStyleSup"> 99m</span>Tc-DTPA aerosols, a standard technique. We compared the two techniques in separate samples: normal controls and patients with severe lung interstitial pathologies. Perfusion studies using <span class="elsevierStyleSup">99m</span>Tc-MAA have also been performed in all patients. The aerosols were produced using ultrasound and lowered surface tension solution of <span class="elsevierStyleSup">99m</span>Tc-HMPAO and <span class="elsevierStyleSup">99m</span>Tc-DTPA. The time-activity curves (TACs) for every pixel on the lung area were used to calculate the half-disappearance times (T<span class="elsevierStyleInf">1/2</span>). Parametric images were then generated with those times. The comparison of the results obtained with <span class="elsevierStyleSup">99m</span>Tc-HMPAO and <span class="elsevierStyleSup">99m</span>Tc-DTPA aerosols suggests that the first ones are more specific for local alterations of the lung epithelial transport in the pathologies studied.</p><p class="elsevierStylePara">This method distinguishes between permeability deficiency due to local perfusion decrease and ACB deterioration.</p><p class="elsevierStylePara"><span class="elsevierStyleBold">KEY WORDS: Lung epithelial permeability. Aerosols. <span class="elsevierStyleSup">99m</span>Tc-HMPAO. Surface tension.</span></p><hr></hr><p class="elsevierStylePara"><span class="elsevierStyleBold">INTRODUCTION</span></p><p class="elsevierStylePara">Alterations in the alveolar-capillary barrier (ACB) modify its permeability to gases and to solutes that are deposited on its surface.</p><p class="elsevierStylePara">Most of the alveolar-capillary membrane permeability studies using radioactive aerosols have been done with <span class="elsevierStyleSup"> 99m</span>Tc-DTPA. DTPA is a water-soluble molecule (492 daltons) that, in normal situations, goes slowly across the ACB by extracellular diffusion through the intercellular channels that exist in the alveolar epithelium and capillary endothelium <span class="elsevierStyleSup"> 1</span>. The process is ultimately controlled by the epithelial layer in which the channel diameters are the smallest. Apart from the physical and chemical differences, this process is not analogous to the phenomena which takes place during respiratory gas exchange in which transfer occurs virtually through the entire cellular membrane lining.</p><p class="elsevierStylePara">The transfer of lipid soluble molecules, deposited in the alveolar walls, through the respiratory barrier is an alternative approach to inform about gas exchange. Passive transport of these molecules across the lipid component of membranes is a fast process, mainly controlled by the exchange surface area and also depending on blood flow. The liquid layer in alveoli has a hydrophobic surface, due to surfactant, which hinders the diffusion of water-soluble molecules. Conversely, lipid soluble solutes diffuse freely through the liquid layer down to the alveolar membrane. Aerosols of hexamethyl-propylenamine oxime or hexametazyme (HMPAO) labeled with <span class="elsevierStyleSup">99m</span>Tc have already been used to study the permeability of the ACB <span class="elsevierStyleSup">2,3</span>. HMPAO has a molecular weight of 380 Dalton and a partition coefficient of 10.48 in n-octanol/(0.9%) NaCl which is much higher than DTPA for the same solvent which is on the order of 18 x 10<span class="elsevierStyleSup">-3</span>. The aim of the present study is to compare the information on ACB permeability of small particle size aerosols of <span class="elsevierStyleSup">99m</span>Tc HMPAO and <span class="elsevierStyleSup">99m</span>Tc DTPA. We describe a technique using ultrasound (US) applied to solutions of lowered surface tension. Particles of less than 0.2 µm diameter were obtained using solutions containing urea and subjected to 2.7 MHz US sonication.</p><p class="elsevierStylePara">Parametric images of the alveolar-capillary membrane permeability, using these aerosols, demonstrated good peripheral penetration, no central deposition, virtual absence of artifacts and consistent results in more than 100 clinical cases.</p><p class="elsevierStylePara">ACB permeability images obtained with <span class="elsevierStyleSup"> 99m</span>Tc-HMPAO in patients with pulmonary interstitial pathology were compared with images obtained with <span class="elsevierStyleSup">99m</span>Tc-DTPA aerosols and with perfusion images taken with <span class="elsevierStyleSup"> 99m</span>Tc-MAA.</p><p class="elsevierStylePara"><span class="elsevierStyleBold">MATERIALS AND METHODS</span></p><p class="elsevierStylePara"><span class="elsevierStyleBold">Theory</span></p><p class="elsevierStylePara">The diameter of particles produced by ultrasonic nebulization depends upon the frequency of the ultrasound, the surface tension of the solution and the specific mass of the liquid. Aerosol particles obtained by ultrasound vaporization of solutions are smaller if surface tension is diminished.</p><p class="elsevierStylePara">On a theoretical basis, an equation of the diameter <span class="elsevierStyleUnderline"> d </span> of aerosol particles produced by ultrasound was developed by our group <span class="elsevierStyleSup">1,4,5</span>.</p><p class="elsevierStylePara"><img src="125v18n1-13006303fig01.jpg"></img></p><p class="elsevierStylePara">where <span class="elsevierStyleUnderline"> * </span> is the surface tension of the solution, <span class="elsevierStyleUnderline"> f </span> is the frequency of ultrasound and <span class="elsevierStyleUnderline"> k'' </span> is a constant.</p><p class="elsevierStylePara">Eq. 1 was supported by our data and differs from the equation proposed by Brain and Valberg <span class="elsevierStyleSup">6</span>. The difference between the two equations is an increased dependence of <span class="elsevierStyleUnderline"> d </span> on both the surface tension and the specific mass of the liquid and a decreased dependence on the US frequency. The value of the constant, k'', was obtained by comparison with experimental results in 40 samples.</p><p class="elsevierStylePara">In our experiments the actual diameters of the aerosol particles produced were determined by optical microscopy <span class="elsevierStyleSup"> 4,5</span>. During production, the aerosol particles were made to collide with a microscope slide where they formed drops shaped as plano-convex lenses. The curved surface of the liquid on the slide was assumed to be spherical. The radius of the circumference contour of the liquid on the slide and the liquid thickness were measured and the volume of liquid calculated. An ocular micrometer was used to measure the radius and the micrometric screw of the microscope to measure the thickness. The diameter of a liquid sphere with the same volume is then calculated. Although close to the resolution limits of the optical nficroscope, the measurements can be done accurately if a small amount of dye is added to the solution. Generally, populations of particles produced by ultrasound waves, have a distribution of diameters that fit to a log-normal function <span class="elsevierStyleSup">1</span>. A narrow distribution of the diameter spectrum is desirable but monodisperse aerosols are difficult to obtain by conventional techniques.</p><p class="elsevierStylePara">After inhalation, the aerosol particles are under the action of several forces (weight, dragging, friction, diffusion, and inertia) which together determine their movements.</p><p class="elsevierStylePara">When a particle is large, the number of gas molecules coming from all directions which simultaneously collide with it is so high that the resultant effect is null, and the gaseous medium behaves as a continuum. When particles are very small, the number of collisions with gas molecules which occurs simultaneously becomes small and the resulting actions do not compensate for each other. As a result he particles have a statistical movement like a gas molecules.</p><p class="elsevierStylePara">The dynamic behavior of an aerosol particle can, to a certain extent, be predicted by the value of its Knudsen number (K<span class="elsevierStyleInf">n</span>) which relates the mean free path of the particles in air, *<span class="elsevierStyleInf">p</span>, to its diameter, D<span class="elsevierStyleInf">p</span><span class="elsevierStyleSup">1,7</span>.</p><p class="elsevierStylePara"><img src="125v18n1-13006303fig02.jpg"></img></p><p class="elsevierStylePara">The value of *<span class="elsevierStyleInf">p</span> for air at normal pressure and temperature conditions is close to 0.7 µm. Thus, in Eq. 2, when K<span class="elsevierStyleInf">n</span> < 0.1, D<span class="elsevierStyleInf">p</span> is great when compared with *<span class="elsevierStyleInf">p</span>, i.e., consistent with the situation described above. When K<span class="elsevierStyleInf">n</span> > 10, D<span class="elsevierStyleInf">p</span> is small with respect to *p, the latter situation is likely to occur.</p><p class="elsevierStylePara">Gravitational sedimentation is important with large particles and generally, results in small deposition velocities. For patients in the supine position and for particles greater than 2 µm diameter, sedimentation is the predominant factor.</p><p class="elsevierStylePara">Diffusion forces are associated with gradients of concentration (or chemical potential) and are important for small aerosol particles.</p><p class="elsevierStylePara">The deposition of the inhaled particles also depends on the type of respiration. In the pulmonary compartment, even at high ventilation rates, air flow is nominally laminar with relatively small Reynolds numbers, and diffusion and sedimentation are the most important disposition processes. Even when respiration is steady, turbulences created at the nasopharyngic level and at the proximal portion of the tracheobronchic compartment spread down to the third order bronchial tree. If the air flow is increased, these turbulences will be transmitted deeper into the bronchial tree. The impact of inertia is a function of air velocity and, for the same frequency, velocity and Reynolds number, increases with air flow. Respiratory frequency is also an important factor to consider since, for a constant ventilation, frequency and deposition vary inversely <span class="elsevierStyleSup">8,9</span>.</p><p class="elsevierStylePara">Generally speaking, deposition of particles with diameters above 1 µm occurs before they reach the lung compartment which is accessible only to smaller particles. The majority of the large particles with diameters above 10 µm deposit, by inertial impact and gravitational sedimentation. Such deposition occurs mainly in the upper portions of the respiratory tree, namely in the nasopharyngic compartment and, at a lesser extent, the tracheobronchial compartment.</p><p class="elsevierStylePara">However, several other factors may also be involved. Hydrophilic particles swell on contact with water, increasing the probability of deposition in the upper part of the respiratory tree and decreasing pulmonary deposition <span class="elsevierStyleSup">9,10,11</span>. Symmetry of particles also plays a role in wall deposition. Elongated particles have a more pronounced peripheral deposition than spherical particles of the same mass <span class="elsevierStyleSup">1</span>.</p><p class="elsevierStylePara">Several pathologic states also influence whether deposition of aerosols will occur in either central or peripheral airways. A partial airway obstruction decreasing the cross sectional area of the vessel causes an increase in the velocity of the inhaled gas mixture with an increase in the Reynolds number. This increase may be enough to induce turbulences and increase particle deposition due to the force of inertia. In chronic obstructive pulmonary disease this results in an increase in central deposition and a decrease in peripheral deposition is observed.</p><p class="elsevierStylePara">Additional factors linked to either the barrier itself or to the inhaled aerosol particles may affect the ACB permeability. The transport process through the barrier depends on the nature of the particles. The inter-cellular channels existing in the different types of cells are the pathways for the water-soluble particles and the process controls diffusion through the barrier. Since the diameter of the endothelial intercellular channels are about ten times larger than those in the epithelium, particles reaching the interstitial space have a higher probability to entering the blood circulation. Due to the high lipid composition of cellular walls, lipid soluble particles may go across the barrier virtually anywhere in the exposed barrier surface and they have a very high rate of transport <span class="elsevierStyleSup">12</span>.</p><p class="elsevierStylePara">For a given type of molecules the rate of transport through the ACB is a function of the barrier permeability. Changes in the integrity of any of the barrier components will induce changes in the overall permeability to inhaled substances. In several pathologic lung states, an increase in epithelial permeability to hydrophilic solutes is observed. This is the case when there is inflammation in the alveoli, such as in asbestosis, sarcoidosis, allergic alveolitis, idiopathic pulmonary fibrosis and pneumonia due to <span class="elsevierStyleItalic">Pneumocystis carinnii.</span></p><p class="elsevierStylePara">Owing to the phospholipid composition of cellular membranes, lipid soluble substances tend to diffuse easily through the membrane structure. This is a determining factor in the process of diffusion of lipid soluble solutes through the alveolar barrier.</p><p class="elsevierStylePara">The transfer of lipid soluble molecules through the barrier is so fast that the equilibrium between the concentrations in both sides can be reached during the capillary blood transit time (0.75 sec) <span class="elsevierStyleSup">12</span>. Coates and O''Brodovich and Effros and Mason, have shown in studies of permeability of the ACB, that the smaller the molecular weight of the solute, the easier its path through the alveolar barrier <span class="elsevierStyleSup">12,13</span>.</p><p class="elsevierStylePara">Surfactant has a phospholipid constitution and water soluble molecules, adsorbed at the surface, are more likely to be deposited on its surface rather than diffuse through it <span class="elsevierStyleSup"> 12</span>. Capillary blood flow is not a determinant factor of the transfer rate of water-soluble solutes. This results from the slowness of the diffusion process in this particular case.</p><p class="elsevierStylePara">In lipophilic solutes, the situation reverses, being notorious the dependency on the capillary blood flow <span class="elsevierStyleSup"> 22</span>.</p><p class="elsevierStylePara">Particle diffusion flow across the bronchial wall is slower than in ACB. Aerosols with large particles show longer disappearance half times. On the other hand, big particles deposit predominantly on apical regions <span class="elsevierStyleSup">14</span>.</p><p class="elsevierStylePara">Increased ACB permeability to water-soluble solutes, in situations of pulmonary pathology are quite frequent. Examples are pulmonary interstitial chronic diseases <span class="elsevierStyleSup">15</span>, amiodarone pneumonitis <span class="elsevierStyleSup">16</span>, pulmonary complications of human immunodeficiency virus infection <span class="elsevierStyleSup">17,18</span>, bleomycine lung toxicity <span class="elsevierStyleSup">19</span> and newborn and adult respiratory distress syndromes <span class="elsevierStyleSup">13,20</span>. Smokers also show increased ACB permeability even without any associated symptoms <span class="elsevierStyleSup"> 21,22</span>.</p><p class="elsevierStylePara"><span class="elsevierStyleBold">Nebulization Procedures</span></p><p class="elsevierStylePara"><span class="elsevierStyleItalic"><span class="elsevierStyleSup">99m</span>''Tc-HMPAO.</span> The solution to be nebulized consisted of 740 MBq of <span class="elsevierStyleSup">99m</span>TcO<span class="elsevierStyleInf">4</span> added to an aqueous solution (~ 2 ml) containing 0.5 mg HMPAO, 7.6 µg SnCl and 4.5 mg NaCl, maintained in a nitrogen atmosphere. The stability <span class="elsevierStyleItalic">in vitro</span> of this complex is low and three radioactive impurities are formed: the hydrophilic secondary complex <span class="elsevierStyleSup">99m</span>Tc-HMPAO, free pertechnetate and the unbound but reduced <span class="elsevierStyleSup">99m</span>Tc <span class="elsevierStyleSup"> 23</span>. We found that the addition of 320 µg of standard urea to this solution decreased the surface tension of the solutions of <span class="elsevierStyleSup">99m</span>Tc-HMPAO (0.5 mg/4 ml) to values of about 35 dyne/cm as measured with a Krüss interfacial tensiometer (model K8) at 20 °C. Ultrasound with a frequency 2.7 MHz (Nebulizer Heyer model 69) was applied to the bottom of a thin plastic cap which contained the <span class="elsevierStyleSup">99m</span>Tc-HMPAO solution to produce the aerosol.</p><p class="elsevierStylePara"><span class="elsevierStyleItalic"><span class="elsevierStyleSup">99m</span>Tc-DTPA.</span> The solution to be nebulized consisted of 740 MBq of <span class="elsevierStyleSup">99m</span>TcO<span class="elsevierStyleInf">4</span> added to an aqueous solution (~ 2 ml) containing 5 mg of DTPA and 0.25 mg SnCl maintained in a nitrogen atmosphere. As above, 320 µg of standard urea is added to this solution, to lower the surface tension to about 38 dyne/cm. The <span class="elsevierStyleSup"> 99m</span>Tc-DTPA complex is highly stable at room temperature.</p><p class="elsevierStylePara"><span class="elsevierStyleBold">Quality Control</span></p><p class="elsevierStylePara">Quality control was performed on all batches of the <span class="elsevierStyleSup"> 99m</span>Tc-HMPAO and <span class="elsevierStyleSup">99m</span>Tc-DTPA radiopharmaceutical solutions before and after nebulization for permeability studies, after the urea addition. For <span class="elsevierStyleSup">99m</span>Tc-DTPA quality control was carried out as described elsewhere <span class="elsevierStyleSup">24</span>. For <span class="elsevierStyleSup"> 99m</span>Tc-HMPAO a more elaborated procedure is required: With time, solutions of <span class="elsevierStyleSup">99m</span>Tc-HMPAO form a secondary hydrophilic complex of <span class="elsevierStyleSup">99m</span>Tc-hexametazime, free pertechnetate (<span class="elsevierStyleSup">99m</span>TcO<span class="elsevierStyleInf">4</span>) and free reduced technetium. Accurate analysis requires the application of three separate chromatography systems. We used two ITLC-SG (Gelman Sciences, Inc.) strips and one Whatman number 1 strip (Whatman Chromatography Products) that were 20 cm long and 2.5 cm wide <span class="elsevierStyleSup"> 25</span>. The eluents were butanone (Merck), NaCl 0.9% and acetonitrile (Merck) in a 50% aqueous solution. Samples (10 µl) were applied and after separation they were dried and counted. The relative amounts of the components were than calculated based on the total activity in the 3 strips.</p><p class="elsevierStylePara"><span class="elsevierStyleBold">Clinical Studies</span></p><p class="elsevierStylePara">In order to evaluate the disappearance half time in man, following pulmonary deposition of the labeled aerosol, gamma camera images were obtained and analyzed in the following manner:</p><p class="elsevierStylePara">The patient was in the supine position and inhaled the aerosol for a maximum of 2 minutes. A GE 400AC gamma camera equipped with a low energy, high sensitivity, parallel hole collimator was used to acquire sequential posterior images of both lung fields in a 64 x 64 array during and after inhalation using a DecStation 5000/200 - Interfaced to a PC. Acquisition time per image and total acquisition time varied with the radiopharmaceutical. For <span class="elsevierStyleSup">99m</span>Tc-HMPAO acquisition was 10 seconds per image and the total acquisition time was 20 minutes. For <span class="elsevierStyleSup">99m</span>Tc-DTPA, the acquisition time per array was 20 sec and the total acquisition time was 40 minutes.</p><p class="elsevierStylePara">After acquisition, the images were aligned using the following steps. An image was chosen as the reference and two easily identifiable anatomical points, supposed to be invariant, are joined by a straight line. In each subsequent image, the same two anatomic landmarks were also identified and connected. The images were realigned by superimposing of these lines by rotation and translation. Without this correction, significant errors in the calculus of the washout half times were observed.</p><p class="elsevierStylePara">After alignment, three ROI''s were drawn: right lung, left lung and background. The background area is taken in the lower mediastinal area between the two lungs. The mean background count rate per pixel is calculated and subtracted from every pixel of the ROI for the 2 lung fields. The mean values of the net total activity for each image of the sequence were used to obtain time/activity curves. Also time/activity curves for individual pixels in the lungs were used to calculate the local disappearance or washout half times to build up parametric images.</p><p class="elsevierStylePara">The time activity curves obtained with <span class="elsevierStyleSup"> 99m</span>Tc-HMPAO showed an initial rapid rise during inhalation followed by a two component or biexponential washout. This consists of a quick initial decrease followed by a slower decreasing phase. The washout half times were calculated from the linear correlation regression lines of the log of the time activity curves for the entire lung. The parametric images were generated using the washout half times for each pixel using a conventional color scale. The parametric images provided information about the local permeability in the pulmonary epithelium.</p><p class="elsevierStylePara">All patients had an evaluation of lung perfusion using 148 MBq of <span class="elsevierStyleSup">99m</span>Tc-MAA and conventional lung imaging. Studies were performed in a total of 21 subjects. Seven were controls and 14 had severe diffuse interstitial fibrosis due to various causes. These data were compared with those obtained with another group of individuals (16 normal controls and 21 patients with severe diffuse interstitial fibrosis) studied with <span class="elsevierStyleSup">99m</span>Tc-DTPA. None of the patients or controls were tobacco users.</p><p class="elsevierStylePara"><span class="elsevierStyleBold">RESULTS</span></p><p class="elsevierStylePara"><span class="elsevierStyleBold">Quality Control</span></p><p class="elsevierStylePara">The percent radioactivity in the preparation of the <span class="elsevierStyleSup"> 99m</span>Tc-HMPAO, before and after US application was respectively 10% and 12% for the secondary hydrophilic <span class="elsevierStyleSup"> 99m</span>Tc-hexametazime, 0% and 0% for <span class="elsevierStyleSup"> 99m</span>TcO-<span class="elsevierStyleInf">4</span> and 2% and 3% for the reduced but not bound <span class="elsevierStyleSup">99m</span>Tc. There were minimal variations between preparations.</p><p class="elsevierStylePara">The amount of <span class="elsevierStyleSup">99m</span>TcO-<span class="elsevierStyleInf">4</span> in <span class="elsevierStyleSup"> 99m</span>Tc-DTPA, after the ultrasonic nebulization was negligible. For 45 determinations, the percent activity in <span class="elsevierStyleSup"> 99m</span>Tc-DTPA before and after nebulization was 97.3% ± 0.5% and 96.2% ± 0.5% respectively.</p><p class="elsevierStylePara"><span class="elsevierStyleItalic">Particle Size</span> The mean of the <span class="elsevierStyleSup"> 99m</span>Tc-HMPAO aerosol particles in solutions containing urea, as described above, obtained by direct measurement was 0.158 µm ± 0.03 µm. Using equation 1 the calculated value was 0.117 µm.</p><p class="elsevierStylePara"><span class="elsevierStyleBold">Clinical Studies</span></p><p class="elsevierStylePara">Figures 1 and 2 show the outputs of the proposed method using <span class="elsevierStyleSup">99m</span>Tc-HMPAO aerosols in a 24 years old volunteer with normal lung function. In Fig. 1, the T<span class="elsevierStyleInf">1/2</span> (washout) for the first phase was 15.0 sec and 14.7 sec respectively for the left and the right lungs. For the second exponential T<span class="elsevierStyleInf">1/2</span> was 48.0 min for the left lung and 62.5 min for the right lung. The error associated with these curves is 1.8% and 1.7% respectively for the left and right lung. The images in the upper panels in Fig. 2 are the permeability images, obtained after <span class="elsevierStyleSup"> 99m</span>Tc-HMPAO aerosol inhalation in a normal control. The color scale in the perfusion and permeability images is different. In the perfusion image, the best perfusion is represented by white and the worst by black. In the patient permeability images, the color scale is normalized to the mean value for both lungs in the normal controls.</p><p class="elsevierStylePara"><img src="125v18n1-13006303fig03.jpg"></img></p><p class="elsevierStylePara"> </p><p class="elsevierStylePara">Fig 1.--<span class="elsevierStyleItalic">Normal control. The left panel provides information on the left lung and the right panel on the right lung. The top panel shows time activity curves for the upper, central and lower thirds of the lung fields and the bottom panel the log of the time/activity curve for the total lung field. Both the measured curves and the regression fines are shown for regional and global curves.</span></p><p class="elsevierStylePara"></p><p class="elsevierStylePara">Fig 2.--<span class="elsevierStyleItalic">Upper panels are the permeability parametric images, obtained after <span class="elsevierStyleSup"> 99m</span>Tc-HMPAO aerosol inhalation in a normal control. The images on the upper left were derived using the washout half times for the early washout component for every pixel in the pulmonary ROI and using the color scale shown on the lower right panel. The image on the upper right was derived from the late washout or second exponential decay. The perfusion image on the lower left were obtained after injection of 148 MBq (4 mCi) <span class="elsevierStyleSup"> 99m</span>Tc-HAM.</span></p><p class="elsevierStylePara">Since there exist two exponential terms, two mean disappearance half times were calculated. The normal mean disappearance time for the first exponential was 15 seconds, which on the color scale corresponds to 25%. For the second exponential component, the normal mean disappearance time is 60 minutes, that corresponds to 75% of the scale. Longer disappearance half times, will appear coded with colors above color 25% and 75% respectively, and inversely for shorter times.</p><p class="elsevierStylePara">Fig. 3 is part of the image sequence obtained with using <span class="elsevierStyleSup">99m</span>Tc-HMPAO in a patient with severe interstitial lung disease. Unlike conventional <span class="elsevierStyleSup">99m</span>Tc-DTPA images, where such patients are likely to have marked central clumping this feature is virtually absent in the <span class="elsevierStyleSup">99m</span>Tc-HMPAO aerosol images. The color scale used in this image sequence indicates increasing uptake from blue to yellow. Due to the metabolic properties of the radiopharmaceutical, liver is seen some time after the inhalation period.</p><p class="elsevierStylePara"></p><p class="elsevierStylePara">Fig 3.--<span class="elsevierStyleItalic">Part of the image sequence collected in a patient with severe interstitial disease after <span class="elsevierStyleSup">99m</span>Tc-HMPAO aerosol inhalation. Images are sequential in rows from left to right and from top to bottom. The color scale modulates the count rate, increasing from black to white.</span></p><p class="elsevierStylePara">The log of the time/activity curves using <span class="elsevierStyleSup"> 99m</span>Tc-HMPAO and the corresponding regression lines, with the same layout as in Fig. 1, in a patient with sarcoidosis, are shown in Fig. 4. The T<span class="elsevierStyleInf">1/2</span> of the first exponential for the total left lung is 21.4 sec and 44.1 sec for the total right lung. The mean T<span class="elsevierStyleInf">1/2</span>of the second exponential is 32.3 min for the left lung and 38.5 min in the right one. The fitting error is 3.1% for the left lung and 4.4% for the right lung.</p><p class="elsevierStylePara"><img src="125v18n1-13006303fig06.jpg"></img></p><p class="elsevierStylePara">Fig 4.--<span class="elsevierStyleItalic">Study in a patient with sarcoidosis using same layout as in Fig. 1. The fitting error is 3.1% for the left lung and 4.4% for the right lung.</span></p><p class="elsevierStylePara">The permeability parametric image of the fast early washout in Fig. 5 are in the yellow/green band, indicating that washout times are much longer than the normal controls, except for a longitudinal area on the right lung periphery. The permeability parametric image of the second exponential shows disappearance times that are nearly normal.</p><p class="elsevierStylePara"></p><p class="elsevierStylePara">Fig 5.--<span class="elsevierStyleItalic">In the upper panels are the permeability parametric images obtained after <span class="elsevierStyleSup"> 99m</span>Tc-HMPAO aerosol inhalation by the patient in Fig. 4. On the left upper is the paraimetric image of T<span class="elsevierStyleInf">1/2</span> or the earliest exponential decay. On the right hand side is the parametric image of T<span class="elsevierStyleInf">1/2</span> for the second exponential decay. The lower left panel is the parametric perfusion image after injection of 148 MBq (4 mCi) <span class="elsevierStyleSup">99m</span>Tc-MAA.</span></p><p class="elsevierStylePara">Fig. 6 shows the log of time/activity curves and the corresponding regression curves, for thirds and the total of both lungs in a patient with fibrosis. The mean value of T<span class="elsevierStyleInf">1/2</span>for the first exponential and for the left lung is 66.0 sec, attaining 1.2 min in the lower third. In the right lung the mean T<span class="elsevierStyleInf">1/2</span> is 35.9 sec, reaching 6.1 min in the middle third. The mean values of T<span class="elsevierStyleInf">1/2</span> for the second exponential components are 84.1 min and 87.1 min for left and right lungs respectively. The percent standard error associated with the fitting is 1.9% for the left lung and 2.1 % for the right lung. The parametric image of the first exponential shows longer T<span class="elsevierStyleInf">1/2</span> in the medial portion and some peripheral areas in the left lung, and smaller inner areas, in the right lung. The parametric images of the half times for the second exponential are about normal. The areas with longer T<span class="elsevierStyleInf">1/2</span>, in the first image, coincide with the smaller times in the second (Fig. 7).</p><p class="elsevierStylePara"><img src="125v18n1-13006303fig08.jpg"></img></p><p class="elsevierStylePara">Fig. 6.--<span class="elsevierStyleItalic">Case of fibrosis: Top left panel - log. time activity curve in thirds of left lung. Top right panel - log. time activity curve in thirds of right lung. Lower left panel - log. time activity curve in thirds in left lung. Lower right panel - log. time activity curve in right lung. The fitting lines are shown. The fitting error is 1.9% for the left lung and 2.1% for the right lung.</span></p><p class="elsevierStylePara"></p><p class="elsevierStylePara">Fig 7.--<span class="elsevierStyleItalic">Upper panels are the permeability parametric images, obtained after <span class="elsevierStyleSup"> 99m</span>Tc-HMPAO aerosol inhalation in a patient with pulmonary fibrosis. The image on the left in the left panel is for the earliest exponential decay. The perfusion image was obtained after injection of <span class="elsevierStyleSup">99m</span>Tc-MAA.</span></p><p class="elsevierStylePara">A total of 21 subjects has performed ACB permeability studies using <span class="elsevierStyleSup">99m</span>Tc-HMPAO. Seven of the patients had no previous history or symptoms of pulmonary pathology and were considered as normal controls. The remaining 14 patients had pulmonary fibrosis of different ethiologies confirmed by laboratory and imaging studies and had a mean age of 37 ± 4.7 years with a range of 29 to 42 years.</p><p class="elsevierStylePara">The T<span class="elsevierStyleInf">1/2</span> values for the ROIs indicated are in the rows that contain the initials of the patient. Two rows below the groups of patients are the mean and SD values obtained in the corresponding ROI. The last two rows show the results when the means ± SD of the two samples of controls and patients are compared, using the Student''s t test (table I).</p><table><tr><td colspan="19"><span class="elsevierStyleBold">Table I</span></td></tr><tr><td colspan="19">T<span class="elsevierStyleInf">1/2</span> VALUES STATISTICS-<span class="elsevierStyleSup">99m</span>Tc-HMPAO</td></tr><tr><td colspan="19"><hr></hr></td></tr><tr align="CENTER"><td><p class="elsevierStylePara"><span class="elsevierStyleItalic">Controls</span></p></td><td><span class="elsevierStyleItalic">Number</span></td><td colspan="2"><span class="elsevierStyleItalic"> L.1,s</span></td><td><span class="elsevierStyleItalic">L.2,m</span></td><td><span class="elsevierStyleItalic">R.1,s</span></td><td><span class="elsevierStyleItalic">R.2,m</span></td><td><span class="elsevierStyleItalic">L/3,u,1,s</span></td><td><span class="elsevierStyleItalic">L/3,m,1,s</span></td><td><span class="elsevierStyleItalic">L/3,I,1,s</span></td><td><span class="elsevierStyleItalic">R/3,u,1,s</span></td><td><span class="elsevierStyleItalic">R/3,m,1,s</span></td><td><span class="elsevierStyleItalic">R/3,I,1,s</span></td><td><span class="elsevierStyleItalic">L/3,u,2,m</span></td><td><span class="elsevierStyleItalic">L/3,m,2,m</span></td><td><span class="elsevierStyleItalic">L/3,I,2,m</span></td><td><span class="elsevierStyleItalic">R/3,u,2,m</span></td><td><span class="elsevierStyleItalic">R/3,m,2,m</span></td><td><span class="elsevierStyleItalic">R/3,I,2,m</span></td></tr><tr><td colspan="19"><hr></hr></td></tr><tr align="RIGHT"><td>N = 7</td><td>Mean</td><td colspan="2">15.8</td><td>65.3</td><td>14.7</td><td>56.6</td><td>13.2</td><td>18.4</td><td>21.8</td><td>17.5</td><td>11.7</td><td>9.7</td><td>64.8</td><td>67.9</td><td>70.3</td><td>60.8</td><td>59.6</td><td>85.2</td></tr><tr align="RIGHT"><td></td><td>SD</td><td colspan="2">5.7</td><td>21.4</td><td>7.0</td><td>13.8</td><td>7.1</td><td>9.6</td><td>15.3</td><td>9.8</td><td>3.8</td><td>5.2</td><td>24.6</td><td>27.6</td><td>36.1</td><td>27.4</td><td>29.6</td><td>43.9</td></tr><tr align="RIGHT"><td>Pathol.</td><td>Number</td><td></td><td>L.1,s</td><td>L.2,m</td><td>R.1,s</td><td>R.2,m</td><td>L/3,u,1,s</td><td>L/3,m,1,s</td><td>L/3,I,1,s</td><td>R/3,u,1,s</td><td>R/3,m,1,s</td><td>R/3,I,1,s</td><td>L/3,u,2,m</td><td>L/3,m,2,m</td><td>L/3,I,2,m</td><td>R/3,u,2,m</td><td>R/3,m,2,m</td><td>R/3,I,2,m</td></tr><tr align="RIGHT"><td>N = 14</td><td>Mean</td><td colspan="2">40.0</td><td>57.6</td><td>30.0</td><td>48.3</td><td>27.4</td><td>22.5</td><td>29.4</td><td>35.7</td><td>63.9</td><td>35.6</td><td>41.6</td><td>69.7</td><td>52.6</td><td>53.1</td><td>46.6</td><td>61.1</td></tr><tr align="RIGHT"><td></td><td>SD</td><td colspan="2">28.4</td><td>22.1</td><td>24.0</td><td>23.9</td><td>24.6</td><td>17.5</td><td>23.2</td><td>43.8</td><td>93.6</td><td>27.1</td><td>23.0</td><td>43.3</td><td>31.9</td><td>57.6</td><td>27.9</td><td>37.6</td></tr><tr align="RIGHT"><td>T Stud</td><td>t</td><td colspan="2">­3.06</td><td>0.77</td><td>­2.20</td><td>1.01</td><td>­1.99</td><td>­0.70</td><td>­0.90</td><td>­1.48</td><td>­2.08</td><td>­3.45</td><td>2.08</td><td>­0.12</td><td>1.10</td><td>0.42</td><td>0.96</td><td>1.24</td></tr><tr align="RIGHT"><td></td><td>p</td><td colspan="2">0.004</td><td>0.229</td><td>0.021</td><td>0.162</td><td>0.031</td><td>0.245</td><td>0.191</td><td>0.080</td><td>0.029</td><td>0.002</td><td>0.031</td><td>0.455</td><td>0.148</td><td>0.341</td><td>0.178</td><td>0.120</td></tr><tr><td colspan="19"><hr></hr></td></tr><tr><td colspan="19">L: Left lung; R: Right lung; 1: First exponential; 2: Second exponential; u-Upper third; m: Middle third; 1: Lower third; s: Seconds; m: Minutes.</td></tr><tr><td colspan="19"><hr></hr></td></tr></table><p class="elsevierStylePara">The values of ACB permeability studies with <span class="elsevierStyleSup"> 99m</span>Tc-DTPA in 16 normal controls and 21 patients with pulmonary interstitial pathology are shown in table II. The layout in this table shows the statistics of the results in a similar way as in table I. Since in this case there is just one exponential term, there are only eight columns: left and right lungs and the corresponding thirds.</p><table><tr><td colspan="24"><span class="elsevierStyleBold">Table II</span></td></tr><tr><td colspan="24">T<span class="elsevierStyleInf">1/2</span> VALUES STATISTICS-<span class="elsevierStyleSup">99m</span>Tc-DTPA</td></tr><tr><td colspan="24"><hr></hr></td></tr><tr align="CENTER"><td><span class="elsevierStyleItalic">Controls</span></td><td><span class="elsevierStyleItalic">Number</span></td><td></td><td colspan="2"><span class="elsevierStyleItalic">L, min</span></td><td></td><td><span class="elsevierStyleItalic">R,min</span></td><td></td><td colspan="2"><span class="elsevierStyleItalic"> L/3,u,min</span></td><td></td><td colspan="2"><span class="elsevierStyleItalic"> L/3,m,min</span></td><td></td><td colspan="2"><span class="elsevierStyleItalic"> L/3,I,min</span></td><td colspan="2"><span class="elsevierStyleItalic"> R/3,u,min</span></td><td></td><td colspan="2"><span class="elsevierStyleItalic"> R/3,m,min</span></td><td></td><td colspan="2"><span class="elsevierStyleItalic"> R/3,l,min</span></td></tr><tr><td colspan="24"><hr></hr></td></tr><tr align="RIGHT"><td>N = 16</td><td>Mean</td><td></td><td></td><td>73.1</td><td></td><td>69.9</td><td></td><td></td><td>71.3</td><td></td><td></td><td>84.4</td><td></td><td></td><td>68.3</td><td></td><td>66.3</td><td></td><td></td><td>72.8</td><td></td><td></td><td>68.0</td></tr><tr align="RIGHT"><td></td><td>SD</td><td></td><td></td><td>20.3</td><td></td><td>16.9</td><td></td><td></td><td>26.0</td><td></td><td></td><td>33.6</td><td></td><td></td><td>15.0</td><td></td><td>24.5</td><td></td><td></td><td>17.6</td><td></td><td></td><td>29.9</td></tr><tr align="CENTER"><td>Pathol.</td><td>Number</td><td colspan="3">L, min</td><td colspan="2">R, min</td><td colspan="3">L/3,u,min</td><td colspan="3">L/3,m,min</td><td colspan="3">L/3,I,min</td><td colspan="2">R/3,u,min</td><td colspan="3">R/3,m,min</td><td colspan="3">R/3,I,min</td></tr><tr align="RIGHT"><td>N = 21</td><td>Mean</td><td></td><td></td><td>58.0</td><td></td><td>59.5</td><td></td><td></td><td>61.7</td><td></td><td></td><td>64.6</td><td></td><td></td><td>57.0</td><td></td><td>53.4</td><td></td><td></td><td>61.6</td><td></td><td></td><td>54.2</td></tr><tr align="RIGHT"><td></td><td>SD</td><td></td><td></td><td>12.8</td><td></td><td>13.3</td><td></td><td></td><td>48.1</td><td></td><td></td><td>18.5</td><td></td><td></td><td>18.4</td><td></td><td>17.1</td><td></td><td></td><td>18.2</td><td></td><td></td><td>20.7</td></tr><tr align="RIGHT"><td>T Stud</td><td>t</td><td></td><td></td><td>2.61</td><td></td><td>2.04</td><td></td><td></td><td>0.77</td><td></td><td></td><td>2.13</td><td></td><td></td><td>2.06</td><td></td><td>1.80</td><td></td><td></td><td>1.90</td><td></td><td></td><td>1.58</td></tr><tr align="RIGHT"><td></td><td>p</td><td></td><td></td><td>0.008</td><td></td><td>0.026</td><td></td><td></td><td>0.222</td><td></td><td></td><td>0.022</td><td></td><td></td><td>0.023</td><td></td><td>0.041</td><td></td><td></td><td>0.033</td><td></td><td></td><td>0.064</td></tr><tr><td colspan="24"><hr></hr></td></tr><tr><td colspan="24"><p class="elsevierStylePara">L: Left lung; R: Right lung; Min: Minutes; u: Upper; m: Medium; 1: Lower.</p></td></tr><tr><td colspan="24"><hr></hr></td></tr></table><p class="elsevierStylePara">The comparison between the results obtained in the two normal samples, using respectively <span class="elsevierStyleSup">99m</span>Tc-HMPAO and <span class="elsevierStyleSup"> 99m</span>Tc-DTPA aerosols, by Student''s t test shows t = 1,269 with a p no signifficant, that means the two groups are extracted from the same population. These results validate the use of different samples for the comparision of the results of the two aerosols.</p><p class="elsevierStylePara"><span class="elsevierStyleBold">DISCUSSION</span></p><p class="elsevierStylePara">Several points about the techniques described above must be emphasized. First, the reduction of the surface tension in <span class="elsevierStyleSup"> 99m</span>Tc-HMPAO solutions to be nebulized is important as far as the dimension of the aerosol particles obtained by US waving is concerned. For the technical conditions described, the particle diameters measured were within the range of 0.158 to 0.256 µm. Virtual absence of central disposition is observed using this technique. We have reasons to believe that deep penetration of the aerosols into the lungs occurred due to the small dimension of the particles. The aerosols of solutions of <span class="elsevierStyleSup">99m</span>Tc-HMPAO deposited in the pulmonary space show a washout curve with two exponential components even in the normal controls. Quality control showed the presence of secondary hydrophilic complex. This complex and <span class="elsevierStyleSup">99m</span>Tc-HMPAO have about the same molecular weight (380 Dalton).</p><p class="elsevierStylePara">The first part of the time activity curve may correspond to the rapid diffusion of the lipophilic complex across the ACB. The second washout term may correspond to diffusion of the secondary hydrophilic complex through the extracellular channels. Since the molecular weight of the secondary hydrophilic complex of <span class="elsevierStyleSup">99m</span>Tc-HMPAO (380 Dalton) is smaller than that of <span class="elsevierStyleSup"> 99m</span>Tc-DTPA complex (490 Dalton), the disappearance half time of the latter is longer. This is shown in the T<span class="elsevierStyleInf">1/2</span>of the normal controls (table I and II), 65.3 min and 56.6 min for left and right lung for <span class="elsevierStyleSup">99m</span>Tc-HMPAO and 73.1 min and 69.9 min respectively, for <span class="elsevierStyleSup">99m</span>Tc-DTPA. This agrees with data published by other authors who have studied the permeability to hydrophilic solutes, with different molecular weights <span class="elsevierStyleSup"> 26</span>. The authors showed that the smaller the molecular weight of a hydrophilic solute, the faster it crosses through the ACB.</p><p class="elsevierStylePara">Comparison between parametric images of permeability (first exponential of the <span class="elsevierStyleSup">99m</span>Tc-HMPAO curve) and perfusion images (<span class="elsevierStyleSup">99m</span>Tc-MAA) show that regions of decreased washout match regions of decreased perfusion. This matching is not verified neither with the second exponential of the <span class="elsevierStyleSup">99m</span>Tc-HMPAO curve nor with the hydrophilic solutes.</p><p class="elsevierStylePara">This finding is in agreement with the dependence of the half times of disappearance of lipophilic solutes on capillary blood flow. When alteration in the permeability of the ACB occurs but perfusion is normal, the effective disappearance half time of the first exponential (<span class="elsevierStyleSup">99m</span>Tc-HMPAO aerosols) increases while the second one decreases, similarly to what happens with watersoluble molecules.</p><p class="elsevierStylePara">The small number of controls studied does not allow a definite statement about the difference between normal control values and pulmonary interstitial pathology values but a tendency is apparent to an increase of the values in the pathologic population. For total lung fields and for thirds of each lung, the mean T<span class="elsevierStyleInf">1/2</span> value for the fibrotic patients is greater than the normal data with significance.</p><p class="elsevierStylePara">Updating of the normalization parameters as a consequence of the increase in the number of controls is a facility of the software program developed.</p><p class="elsevierStylePara"><span class="elsevierStyleBold">CONCLUSION</span></p><p class="elsevierStylePara">Although somewhat limited by the number of cases examined, the results suggest that <span class="elsevierStyleSup">99m</span>Tc-HMPAO ACB studies with particle dimensions of about 0.2 µm are a means of showing local alterations of lung transport. This method distinguishes between permeability deficiency due to the potential deterioration of the two major membrane components: the lipidic segments and the proteic pores. Information on hydrophilic molecule transport is also supplied by the second exponential component of the pulmonary activity depuration curve.</p><p class="elsevierStylePara">Considering the additional information supplied, <span class="elsevierStyleSup"> 99m</span>Tc-HMPAO aerosols seem to be a better alternative to ACBP studies, than <span class="elsevierStyleSup">99m</span>Tc-DTPA. The production of the aerosol particles by ultrasonic techniques, allows particle dimension control by decreasing the surface tension of the starting solution and varying the frequency of the ultrasounds. This technique can be successfully used in routine practice to obtain small particle size aerosols for ACB permeability studies in Nuclear Medicine. The technique is reliable and easy to implement.</p><hr></hr><p class="elsevierStylePara"><span class="elsevierStyleBold">BIBLIOGRAPHY</span></p><p class="elsevierStylePara">1. Phalen RF. Inhalation Studies: Foundations and Techniques. Boca Raton: 1984. CRC Press Inc, Boca Raton.</p><p class="elsevierStylePara">2. Kawakami K, Takagi H. Pulmonary Clearance of Tc-<span class="elsevierStyleSup">99m</span> HMPAO Aerosols. A New Application of a Lipophilic Substance (Abstract). J Nucl Med 1989;30:743.</p><p class="elsevierStylePara">3. Kao CH, Lin HT, Yu SL, Wang SJ, Yeh SH. Supine Lung Clearance of <span class="elsevierStyleSup">99m</span>Tc-DTPA and HMPAO Aerosols. Clin Nucl Med 1995;20:633-5.</p><p class="elsevierStylePara">4. Botelho W, De Lima JJP, Godinho F, Femandes A, Simão P, Baganha W. Aerossóis e Permeabilidade Epitelial Pulmonar. Via Pneumológica 1990;III:159-63.</p><p class="elsevierStylePara">5. De Lima JJP, Botelho MF. Deposição de Aerossóis na Árvore Respiratória. 1. Considerações Dinâmicas. Coimbra Médica 1993;13:131-43.</p><p class="elsevierStylePara">6. Brain JD, Valberg PA. Deposition of Aerosol in the Respiratory Tract. Am Rev Respir Dis 1979;120:1325-73.</p><p class="elsevierStylePara">7. Pritchard JN. Particle Growth in the Airways and the Influence of Airflow. In: Newman SP, Moren F, Crompton, ed. A New Concept in Inhalation Therapy. Proceedings of an International Workshop on a New Inhaler. London: Medicom Europe B.V, 1987:3-24.</p><p class="elsevierStylePara">8. Tu KW, Knutson EO. Total Deposition of Ultrafine Hydrophobic and Hygroscopic Aerosols in the Human Respiratory System. Aerosol Sci Technol 1984;3:453-65.</p><p class="elsevierStylePara">9. Dautrebande L, Walkenhorst W. Deposition of Microaerosols in Human Lung with Special Reference to the Alveolar Spaces. Health Physics 1964-10:981-93.</p><p class="elsevierStylePara">10. O''Doherty MJ, Peters AM. Pulmonary technetium-<span class="elsevierStyleSup">99m</span> diethylene triamine penta-acetic acid aerosol clearance as an index of lung injury. Eur J Nucl Med 1997;24:81-7.</p><p class="elsevierStylePara">11. Uh S, Lee SM, Kim HT, Chung Y, Kim YH, Park CS. The clearance rate of alveolar epithelium using <span class="elsevierStyleSup"> 99m</span>Tc-DTPA in patients with dffuse infiltrative lung diseases. Chest 1994;106:161-5.</p><p class="elsevierStylePara">12. Effros RM, Masson GR. Measurements of Pulmonary Epithelial Permeability <span class="elsevierStyleItalic">in vivo</span>. Am Rev Respir Dis 1983-127(Supl):S59-S65.</p><p class="elsevierStylePara">13. Coates G, O''Brodovich H. Measurements of Pulmonary Epithelial Permeability with <span class="elsevierStyleSup">99m</span>Tc-DTPA Aerosol. Sem Nucl Med 1986;16:275-84.</p><p class="elsevierStylePara">14. Oberdorster G, Utell MJ, Morrow PE, Hyde RW, Weber DA. Bronchial and Alveolar Absorption of Inhaled <span class="elsevierStyleSup"> 99m</span>Tc-DTPA. Am Rev Respir Dis 1986;134:944-50.</p><p class="elsevierStylePara">15. Yeh SH, Liu RS, Wu LC, Peng NJ, Lu JY. <span class="elsevierStyleSup"> 99m</span>Tc-HMPAO and <span class="elsevierStyleSup">99m</span>Tc-DTPA Radioaerosol Clearance Measurements in Idiopathic Pulmonary Fibrosis. Nucl Med Commun 1995;16:140-4.</p><p class="elsevierStylePara">16. Terra-Filho K, Vargas FS, Meneguetti JC, Soares Júnior J, Cukier A, Teixeira LR, Camargo EE. Pulmonary Clearance of Technetium <span class="elsevierStyleSup">99m</span> Diethylene Triamine Penta-Acetic Acid Aerosol in patients with Amiodarone Pneumonitis. Eur J Nucl Med 1990;17:334-7.</p><p class="elsevierStylePara">17. Meignan M, Guillon JK, Denis M, Joly P, Rosso J, Carette MF, Baud L, Parquin F, Plata F, Debre P y cols. Increased Lung Epithelial Permeability in HIV-Infected Patients with Isolated Cytotoxic T-Lymphocytic Alveolitis. Am Rev Respir Dis 1990; 141:1241-8.</p><p class="elsevierStylePara">18. Rosso J, Guillon JM, Parrot A, Deis K Akoun G, Mayaud Ch. Sherrer M, Meignan M. Technetium-<span class="elsevierStyleSup">99m</span>-DTPA aerosol and galium-<span class="elsevierStyleSup">67</span> scanning in pulmonary complications of human immunodeficiency virus infection. J Nucl Med 1992-33:81-7.</p><p class="elsevierStylePara">19. Ugur Ö, Caner B, Balbay NO, Özen HA, Remzi D, Ulutuncel N. Bleomycin Lung Toxicity Detected by Technetium-<span class="elsevierStyleSup">99m</span> Diethylene Triamine Penta-Acetic Acid Aerosol Scintigraphy. Eur J Nucl Med 1993;20:114-8.</p><p class="elsevierStylePara">20. Jefferies AL, Coates G, O''Brodovich H. Pulmonary Epithelial Permeability in Hyaline-Membrane Disease. N Engl JMed 1984;311:1075-80.</p><p class="elsevierStylePara">21. Nolop KB, Maxwell DL, Fleming JS, Braude S, Hughes JMB, Royston D. A Comparison of <span class="elsevierStyleSup">99m</span>Tc-DTPA and <span class="elsevierStyleSup">113m</span>In-DTPA Aerosol Clearances in Humans. Am Rev Respir Dis 1987; 136:1112-6.</p><p class="elsevierStylePara">22. Jones JG, Minty BD, Lawler P, Hulands G, Crawley CW, Veall N. Increased Alveolar Epithelial Permeability in Cigarette Smokers. Lancet 1980-1:66-8.</p><p class="elsevierStylePara">23. Hung JC, Corlija M, Volkert WA, Holmes RA. Stabilization of Technetium-<span class="elsevierStyleSup">99m</span>-D,L-Hexametylpropyleneamine Oxime (<span class="elsevierStyleSup">99m</span>Tc-D,L-HM-PAO) Using Gentisic Acid. Nucl Med Biol 1989;16:675-80.</p><p class="elsevierStylePara">24. Robbins PJ. Chromatography of Technetium-<span class="elsevierStyleSup">99m</span> Radiopharmaceuticals. A Practical Guide. The Society of Nuclear Medicine 1984, Inc, New York.</p><p class="elsevierStylePara">25. Neirinckx RD, Canning LR, Piper IM, Nowotnik DP, Pickett RD, Holmes RA, Volkert WA, Forster AM, Weisner PS, Marriott JA, Chaplin SB. Technetium-<span class="elsevierStyleSup">99m</span> d,l-HM-PAO: A New Radiopharmaceutical for SPECT. Imaging of Regional Cerebral Blood Perfusion. J Nucl Med 1987-28:191-202.</p><p class="elsevierStylePara">26. Huchon GJ, Montgomery AB, Lipavsky A, Hoeffel JK, Murray JF. Respiratory Clearance of Aerosolized Radioactive Solutes of Varying Molecular Weight. J Nucl Med 1987-28:894-902.</p>" "tienePdf" => false "PalabrasClave" => array:1 [ "en" => array:1 [ 0 => array:4 [ "clase" => "keyword" "titulo" => "Keywords" "identificador" => "xpalclavsec236430" "palabras" => array:4 [ 0 => "Lung epithelial permeability" 1 => "Aerosols" 2 => "99mTc-HMPAO" 3 => "Surface tension" ] ] ] ] "multimedia" => array:5 [ 0 => array:6 [ "identificador" => "fig1" "tipo" => "MULTIMEDIAFIGURA" "mostrarFloat" => true "mostrarDisplay" => false "copyright" => "Elsevier España" "figura" => array:1 [ 0 => array:4 [ "imagen" => "125v18n1-13006303fig01.jpg" "Alto" => 86 "Ancho" => 160 "Tamanyo" => 2208 ] ] ] 1 => array:6 [ "identificador" => "fig2" "tipo" => "MULTIMEDIAFIGURA" "mostrarFloat" => true "mostrarDisplay" => false "copyright" => "Elsevier España" "figura" => array:1 [ 0 => array:4 [ "imagen" => "125v18n1-13006303fig02.jpg" "Alto" => 75 "Ancho" => 105 "Tamanyo" => 1477 ] ] ] 2 => array:6 [ "identificador" => "fig3" "tipo" => "MULTIMEDIAFIGURA" "mostrarFloat" => true "mostrarDisplay" => false "copyright" => "Elsevier España" "figura" => array:1 [ 0 => array:4 [ "imagen" => "125v18n1-13006303fig03.jpg" "Alto" => 261 "Ancho" => 400 "Tamanyo" => 9205 ] ] ] 3 => array:6 [ "identificador" => "fig4" "tipo" => "MULTIMEDIAFIGURA" "mostrarFloat" => true "mostrarDisplay" => false "copyright" => "Elsevier España" "figura" => array:1 [ 0 => array:4 [ "imagen" => "125v18n1-13006303fig06.jpg" "Alto" => 253 "Ancho" => 400 "Tamanyo" => 9668 ] ] ] 4 => array:6 [ "identificador" => "fig5" "tipo" => "MULTIMEDIAFIGURA" "mostrarFloat" => true "mostrarDisplay" => false "copyright" => "Elsevier España" "figura" => array:1 [ 0 => array:4 [ "imagen" => "125v18n1-13006303fig08.jpg" "Alto" => 278 "Ancho" => 400 "Tamanyo" => 10321 ] ] ] ] ] "idiomaDefecto" => "en" "url" => "/2253654X/0000001800000001/v0_201308011545/13006303/v0_201308011545/en/main.assets" "Apartado" => array:4 [ "identificador" => "17594" "tipo" => "SECCION" "es" => array:2 [ "titulo" => "Originales" "idiomaDefecto" => true ] "idiomaDefecto" => "es" ] "EPUB" => "https://multimedia.elsevier.es/PublicationsMultimediaV1/item/epub/13006303?idApp=UINPBA00004N" ]
Información de la revista
Vol. 18. Núm. 1.
Páginas 21-31 (enero 1998)
Vol. 18. Núm. 1.
Páginas 21-31 (enero 1998)
Evaluation of the alveolar-capillary membrane permeability using 99mTc-HMPAO aerosols in severe diffuse interstitial fibrosis
Evaluación de la permeabilidad de la membrana alveolocapilar utilizando aerosoles de 99m Tc-HMPAO en la fibrosis intersticial difusa.
Visitas
1184
Mª F Botelho, João J P de Lima, Manuel D Cerqueira
Este artículo ha recibido
Información del artículo
Opciones para acceder a los textos completos de la publicación Revista Española de Medicina Nuclear e Imagen Molecular
Socio
Si es usted socio de la Sociedad Española de Medicina Nuclear e Imagen Molecular (SEMNIM) puede acceder al texto completo de los contenidos de la Revista Española de Medicina Nuclear e Imagen Molecular desde los enlaces a la revista publicados en la web de la SEMNIN (enlace a https://semnim.es/iniciar-sesion/), previo inicio de sesión como socio. Si tiene problemas de acceso puede contactar con la Secretaría Técnica de la SEMNIM en el correo electrónico secretaria.tecnica@semnim.es o en el teléfono: + 34 619 594 780
Suscriptor
Suscribirse
Contactar
Teléfono para suscripciones e incidencias
De lunes a viernes de 9h a 18h (GMT+1) excepto los meses de julio y agosto que será de 9 a 15h
Llamadas desde España
932 415 960
Llamadas desde fuera de España
+34 932 415 960
E-mail