Individuals with schizophrenia are known to present a decreased life expectancy with respect to the general population1 that is due, at least in part, to a high prevalence of factors of cardiovascular risk.2 The appearance of these factors of risk is favoured by the intake of specific psychiatric drugs and by an unhealthy life style.3,4 For that reason, knowing the dietary habits of people with schizophrenia is always relevant and becomes essential when any intervention plan aimed at lowering cardiovascular risk is planned.
We studied 74 patients with schizophrenia (23 of them women) with an age range between 18 and 60 years. All of them were diagnosed according to ICD-10 criteria by trained psychiatrists. All the patients had more than 2 years of history of illness and were psychopathologically stable at the time of the study.
We collected sociodemographic, anthropometric (weight, height, abdominal perimeter, heart rate and blood pressure) and food intake data. The consumption of food was obtained retrospectively, using a semi-quantitative food questionnaire. All of the subjects and, as often as possible, their relatives, were interviewed in depth by a trained nurse (all the interviews were carried out by the same nurse, who belonged to the team for attention to severe mental disorders). The nurse collected data on the frequency and amount of each food ingested during the previous week. The quantification was performed by showing the patients images with different amounts of each type of food. The diets were analysed using the NUT5 programme, which makes it possible to convert frequency questionnaires into absolute intake of food or nutrients (the latter using the Spanish food composition tables prepared by the Consejo Superior de Investigaciones Científicas (Spanish Council for Scientific Research) in 1990.
Mean sample age was 40.38 years (standard deviation [SD]=11.33), significantly higher (P=0.048) in the females (44.36 years; SD=10.23), than in the males (38.67 years; SD=11.44). Average years of evolution of schizophrenia were 15.5 (SD=8.32).
Table 1 presents the values for the vital signs and the anthropometric measures. Criteria for obesity were fulfilled by 42.6% of the males and 62.8% of the females (P=0.047). It can be seen in this table that the average values for blood pressure (BP), body mass index (BMI) and the metabolic syndrome parameters are higher than the values considered to be normal by the International Diabetes Federation (IDF).6
Vital signs and anthropometric measures of the population studied, IDF reference values and comparison of means between males and females.
| Males | Females | Total | IDF values | M/F Comparison | |||||
|---|---|---|---|---|---|---|---|---|---|
| Mean | SD | Mean | SD | Mean | SD | ≤ | Student t value | P value | |
| Systolic BP | 148.70 | 25.60 | 138 | 26.2 | 145.36 | 26.14 | 130.00 | 1.602 | 0.114 |
| Diastolic BP | 90.76 | 13.34 | 91.1 | 13 | 90.76 | 13.34 | 85.00 | 0.319 | 0.750 |
| Heart rate | 87.90 | 18.30 | 84.2 | 21.2 | 86.80 | 26.14 | 0.742 | 0.461 | |
| Abdominal perimeter | 103.09 | 13.60 | 98.3 | 14.7 | 101.59 | 14.08 | 94 (M)/80 (F) | 1.308 | 0.195 |
| Body mass index | 29.80 | 5.30 | 31.2 | 6.3 | 30.26 | 5.65 | 25.00 | −0.996 | 0.323 |
BP: blood pressure; F: females; IDF: International Diabetes Federation; M: males; SD: standard deviation.
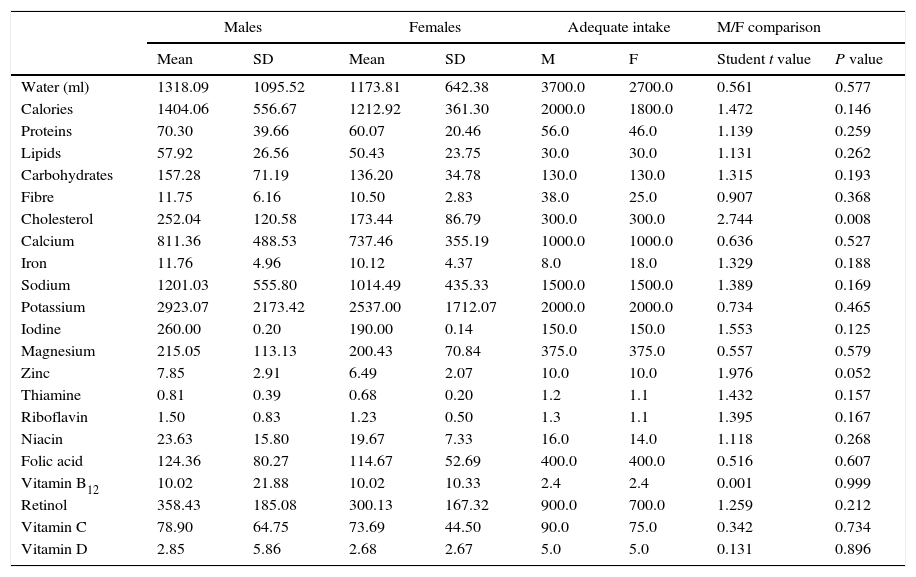
Table 2 presents the intake of the main nutrients according to sex. In the comparison, only a statistically significant (P=0.008) greater intake of cholesterol for the males and a difference nearly statistically significant (P=0.052) in zinc intake were found.
Daily nutrient consumption by sex, recommended daily intake values and comparison of means between males and females.
| Males | Females | Adequate intake | M/F comparison | |||||
|---|---|---|---|---|---|---|---|---|
| Mean | SD | Mean | SD | M | F | Student t value | P value | |
| Water (ml) | 1318.09 | 1095.52 | 1173.81 | 642.38 | 3700.0 | 2700.0 | 0.561 | 0.577 |
| Calories | 1404.06 | 556.67 | 1212.92 | 361.30 | 2000.0 | 1800.0 | 1.472 | 0.146 |
| Proteins | 70.30 | 39.66 | 60.07 | 20.46 | 56.0 | 46.0 | 1.139 | 0.259 |
| Lipids | 57.92 | 26.56 | 50.43 | 23.75 | 30.0 | 30.0 | 1.131 | 0.262 |
| Carbohydrates | 157.28 | 71.19 | 136.20 | 34.78 | 130.0 | 130.0 | 1.315 | 0.193 |
| Fibre | 11.75 | 6.16 | 10.50 | 2.83 | 38.0 | 25.0 | 0.907 | 0.368 |
| Cholesterol | 252.04 | 120.58 | 173.44 | 86.79 | 300.0 | 300.0 | 2.744 | 0.008 |
| Calcium | 811.36 | 488.53 | 737.46 | 355.19 | 1000.0 | 1000.0 | 0.636 | 0.527 |
| Iron | 11.76 | 4.96 | 10.12 | 4.37 | 8.0 | 18.0 | 1.329 | 0.188 |
| Sodium | 1201.03 | 555.80 | 1014.49 | 435.33 | 1500.0 | 1500.0 | 1.389 | 0.169 |
| Potassium | 2923.07 | 2173.42 | 2537.00 | 1712.07 | 2000.0 | 2000.0 | 0.734 | 0.465 |
| Iodine | 260.00 | 0.20 | 190.00 | 0.14 | 150.0 | 150.0 | 1.553 | 0.125 |
| Magnesium | 215.05 | 113.13 | 200.43 | 70.84 | 375.0 | 375.0 | 0.557 | 0.579 |
| Zinc | 7.85 | 2.91 | 6.49 | 2.07 | 10.0 | 10.0 | 1.976 | 0.052 |
| Thiamine | 0.81 | 0.39 | 0.68 | 0.20 | 1.2 | 1.1 | 1.432 | 0.157 |
| Riboflavin | 1.50 | 0.83 | 1.23 | 0.50 | 1.3 | 1.1 | 1.395 | 0.167 |
| Niacin | 23.63 | 15.80 | 19.67 | 7.33 | 16.0 | 14.0 | 1.118 | 0.268 |
| Folic acid | 124.36 | 80.27 | 114.67 | 52.69 | 400.0 | 400.0 | 0.516 | 0.607 |
| Vitamin B12 | 10.02 | 21.88 | 10.02 | 10.33 | 2.4 | 2.4 | 0.001 | 0.999 |
| Retinol | 358.43 | 185.08 | 300.13 | 167.32 | 900.0 | 700.0 | 1.259 | 0.212 |
| Vitamin C | 78.90 | 64.75 | 73.69 | 44.50 | 90.0 | 75.0 | 0.342 | 0.734 |
| Vitamin D | 2.85 | 5.86 | 2.68 | 2.67 | 5.0 | 5.0 | 0.131 | 0.896 |
F: females; M: males; SD: standard deviation.
Comparing the data obtained with the recommended dietary requirements,7 an intake lower than 75% of the recommended amount was detected in the overall sample in the following: water, fibre, magnesium, thiamine, folic acid, retinol and vitamin D. The females in particular consumed amounts below their needs of cholesterol, calcium, iron, sodium and zinc. A higher intake than those recommended were observed in: proteins, lipids, potassium, iodine, niacin and vitamin B12 in the overall sample; and in iron in the males. The low level of calorie intake reported by the patients and relatives was surprising. This datum did not coincide with the nutritional state of the patients and might reveal a tendency to not report (intentionally or not) part of the food ingested (food eaten outside mealtimes or away from home). This would represent a limiting element for introducing any dietary modification (especially if the patients and their relatives were not totally conscious of their habit) and would involve the need to include aspects of physical health in the well-known intervention programmes that have been shown to be effective for controlling other aspects of individuals with schizophrenia.8 It would also be necessary to take into consideration new research data that would allow better understanding of clinical, environmental and genetic factors involved in the increase in weight and in the associated metabolic disorders.9
Our results should be analysed with caution, given that the study has several limitations. There was no control group to make it possible to compare the dietary habits of the patients with the healthy population in the same geographical area. In addition, retrospective information was used, which might be biased by the memory of those interviewed and their desire to answer sincerely.
However, in spite of these limitations, our data suggest that: (1) the patients in the sample studied have an inadequate food intake, and (2) considering the dietary information reported and its comparison with the anthropometric parameters, this population might have a tendency to underestimate the amount of food that they consume.
Please cite this article as: Iglesias-García C, Toimil A, Iglesias-Alonso A. Hábitos dietéticos de una muestra de pacientes con esquizofrenia. Rev Psiquiatr Salud Ment (Barc.). 2016;9:123–125.


